 8-Plex
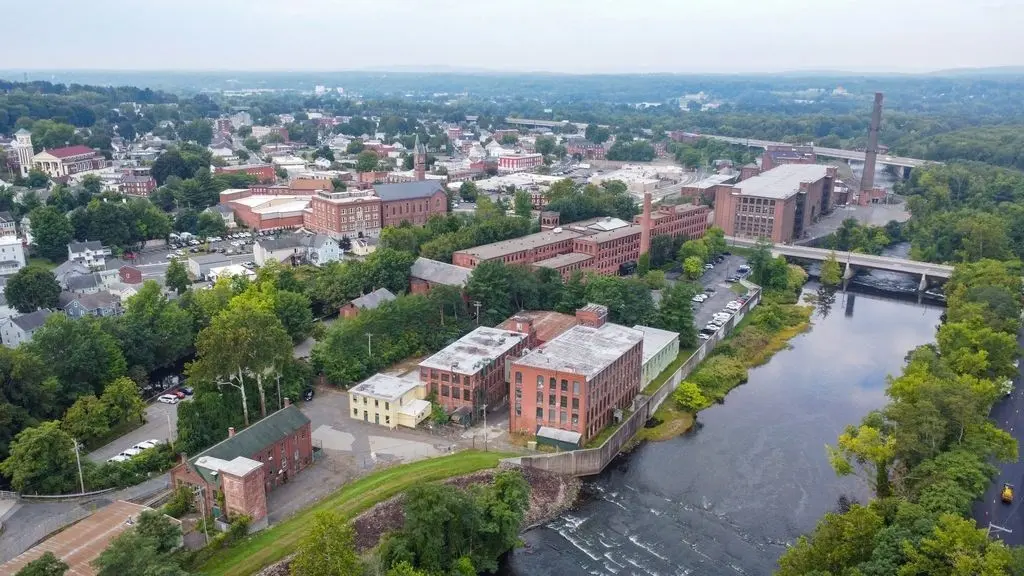
35 Lower Grape St · Chicopee, MA
Flood risk No data
- FEMA flood zone
- —
- Chance of flooding over 30 yrs
- —
- Est. flood insurance / yr
- —
Fire risk No data
- Est. fire insurance / yr
- —
Heat risk No data
- Hot days now (above threshold)
- —
- Hot days in 30 yrs
- —
Wind risk No data
- Chance of severe wind over 30 yrs
- —
Air-quality risk No data
- Unhealthy air days now
- —
- Unhealthy air days in 30 yrs
- —
Risk factors via First Street. Map © Google.
Why this score? — see what drove the B- grade
The composite is a weighted blend of 9 inputs, each scored 0–100. Each bar is that input's sub-score; the figure is the points it added to the 100-point composite (weight × sub-score).
- Cash flow +29.8/30.0
- DSCR +10.0/10.0
- 1% rule +8.4/10.0
- ARV discount +7.5/15.0
- Livability +3.8/5.0
- Rent growth +2.5/5.0
- Schools +2.3/10.0
- Condition / age +1.0/5.0
- Appreciation +0.0/10.0
$1,199,900
🖨 Deal sheet 📄 Offer letter ✓ Due diligence
Multi-family units
County records classify this as Multi-Family (5+ Unit). Listing-text estimate: 8 units. confirmed
5+ unit building — per-unit beds/baths from public records are typically unavailable; the breakdown below (if shown) is an estimate from the listing text.
Listing remarks MLS
Proud to present the Historic Ames Sword Co Buildings! Situated in the heart of Chicopee, MA by Chicopee River, this mill presents a unique redevelopment opportunity, with great enthusiasm and collaboration from town officials to help create a vibrant residential and or commercial destination. This 5-building parcel spans over 2 acres and is zoned both Commercial & Industrial! Potential to develop affordable housing, condos, 55+ community, medical offices, luxury living units, self storage and more. Rentable Warehouse and Heated storage potential. Equipped with loading docks and freight elevators offering endless potential in an established Opportunity Zone with possible grant funding. The property is structurally sound and ideally positioned for conversion into apartments or mixed-use development. 11’ to 16’ ceilings! Don’t miss this rare chance to transform a riverside compound into a signature waterfront development with long-term value and community impact.
Key facts
- Chicopee river
- 5 building parcel
- Luxury living units
Tags
Neighborhood map
What this means for you Summary
Snapshot
- This is a 8 × 3-bed/?-bath units multifamily listed at $1.20M. Condition is rated poor.
Deal economics
- At list price, monthly cash flow is $4k ($53k/yr) — positive. Per door: $549/mo.
- The deal already cash-flows at list — no discount required.
- Meets the 1% rule at list price ($16k rent vs $1.20M).
- Recommended offer: $1.06M (12.0% below list) — sets the bar for market timing.
- Cap rate 10.7% vs local median 4.6% in Chicopee — top-decile yield for the area; either an underpriced asset or a hidden risk that comps aren't pricing in. Stress-test before assuming the spread holds.
Location & tenants
- Location reads 76/100 on livability (#66 in MA, #3,658 nationally) — a middle-class / working-renter tenant base. Strengths: commute A+, housing A+, health & safety A+; Watch: employment D+, schools D, crime F.
- Chicopee (suburban): math 20% / reading 33% proficiency, ranked #270 of 302 in MA (top 89%) — low school quality limits family demand, transient renter base, plan for 1-2y turnover.
- Market conditions: 12 active listings in the ZIP; 453 units permitted in Hampden County in 2024 (116 in 5+ unit buildings).
- At $16,061/mo this rent would consume 323% of the median local household income ($60k/yr) (locally 895% of renters already pay >50% of income on rent) — very limited rent-growth headroom before tenants either downsize or default.
Forward outlook
- Local home prices are declining (-3.0%/yr); year-one equity from $8k of loan paydown is wiped out by about $36k of value loss. Plan a longer hold.
- Hampden County population projected at +5% by 2050 — modest demand growth; plan on rents tracking national, not racing it.
- At projected returns (-3.0% appreciation + 3.0% rent growth), your $336k cash investment doubles in ~8 years — after that, you're playing with house money.
Negotiation context
- It's been on market 167 days — a 12% lower offer ($1.06M) is reasonable based on typical stale-listing flexibility.
Risks & watch-outs
- Watch-outs: built in 1810 — expect roof / HVAC / electrical / plumbing capex.
Questions for the listing agent
- It's been on market 167 days. Have you received any prior offers? Is the seller open to a 12% concession, seller financing, or rate buy-down credit?
- Can we see the unit-by-unit rent roll, current vacancy, and any below-market leases? What's the average tenancy length?
- What capital expenditures (roof, boiler, parking lot, exteriors) have been made in the last 5 years, and what's planned in the next 2?
- Have any recent inspections been done? Can we get a copy of the seller's disclosures and any deferred-maintenance estimates?
- Built in 1810 — when were the roof, HVAC, electrical panel, plumbing, and water heater last replaced?
- Why hasn't it sold? Are there any deal-killer items the seller is aware of (foundation, flood, title, zoning, code violations)?
- Is there a deadline driving the sale (1031 exchange, divorce, estate, relocation)? That informs how much negotiation room exists.
- Schools are D-rated, which usually means shorter tenancies and higher turnover. Who's the typical renter profile here, and what's been the actual vacancy rate?
- Crime grade is F in this area — have there been break-ins, vandalism, or insurance claims at this property in the last 3 years? What carrier currently insures it and at what premium?
- What's the average days-on-market for RENTAL listings here right now (not sales)? A rising rental-DOM trend means longer vacancies and softer asking-rent achievability than the comps imply.
- What's the recent tenant-quality profile in this submarket — average credit score on applications, eviction rate, late-payment / NSF rate, and stable-employment percentage? A property-management company in the area should have these aggregated.
- How much new apartment / multifamily construction is in the pipeline within 1–3 miles? Heavy new supply (>2% of stock underway) typically softens rents 12–24 months out; light construction supports rent growth.
Investment metrics
- 1% rule
- 1.34% ✓
- Cap rate
- 10.69%
- Cash-on-cash
- 15.70%
- DSCR
- 1.70
- GRM
- 6.2
CMA / ARV
No comps found within radius.
Projected returns pro-forma
-3.0% appreciation · 3.0% rent growth · sell at horizon
- IRR
- 6.5%
- Equity multiple
- 1.26×
- Total profit
- $85,787
- Equity at exit
- $178,909
- IRR
- 15.9%
- Equity multiple
- 2.30×
- Total profit
- $436,206
- Equity at exit
- $103,745
Cash invested: $335,972 (down + closing). Projections, not guarantees.
Landlord ↔ Tenant lean methodology
- Overall (STATE)
- 20 Strongly Tenant-Friendly
- State Massachusetts
- 20 Strongly Tenant-Friendly · D+15
- County
- — inherits STATE
- City
- — inherits STATE
ZIP-level market 01013
- Home prices YoY
- -23.1%
- Active inventory
- 12
- Price-to-rent
- 49.8×
Monthly cashflow live
- Estimated rent
- $16,061 medium interval (Pro) →
- Mortgage (P&I)
- −$6,292
- Tax est. 1.5%
- −$1,500 /mo · $17,998/yr
- Insurance
- −$500
- HOA
- −$0
- Vacancy / Maint / Mgmt
- −$3,373
- Net cashflow
- $4,396
Break-even live
8-unit breakdown (identical units grouped — click to expand)
| Units | Beds | Baths | Est. rent |
|---|---|---|---|
| 8× units | 3 | — | $16,064 |
| #1 | 3 | — | $2,008 |
| #2 | 3 | — | $2,008 |
| #3 | 3 | — | $2,008 |
| #4 | 3 | — | $2,008 |
| #5 | 3 | — | $2,008 |
| #6 | 3 | — | $2,008 |
| #7 | 3 | — | $2,008 |
| #8 | 3 | — | $2,008 |
| Total (8 units) | $16,061 | ||
UW: 25.0% down · 7.5% · 30yr · 1.5% tax · 5.0% vac · 8.0% maint · 8.0% mgmt
Financing live
Cash to close
- Down payment
- $299,975
- Closing costs
- $35,997
- Reserves months
- —
- Total cash needed
- —
Loan-product check · same deal, 3 products live
Conventional
25% down · 7.5% · 30yr
- Down + closing
- —
- Monthly P&I
- —
- Monthly cashflow
- —
- DSCR
- —
- Eligible?
- —
Personal DTI + credit; lowest rate.
DSCR
20% down · 8.5% · 30yr
- Down + closing
- —
- Monthly P&I
- —
- Monthly cashflow
- —
- DSCR
- —
- Eligible?
- —
No personal income docs; deal must DSCR.
Hard money
10% down · 12.0% · 12mo
- Down + closing
- —
- Monthly P&I
- —
- Monthly cashflow
- —
- DSCR
- —
- Eligible?
- —
Short-term bridge; refi at stabilization.
Listing history 16 events
-
2026-06-18days on market $1,199,900 Active 167 DOM
-
2026-06-17days on market $1,199,900 Active 166 DOM
-
2026-06-16days on market $1,199,900 Active 165 DOM
-
2026-06-15days on market $1,199,900 Active 164 DOM
-
2026-06-14days on market $1,199,900 Active 162 DOM
-
2026-06-13days on market $1,199,900 Active 161 DOM
-
2026-06-10days on market $1,199,900 Active 159 DOM
-
2026-06-09days on market $1,199,900 Active 158 DOM
-
2026-06-08days on market $1,199,900 Active 157 DOM
-
2026-06-07days on market $1,199,900 Active 156 DOM
-
2026-06-03days on market $1,199,900 Active 152 DOM
-
2026-06-02days on market $1,199,900 Active 151 DOM
-
2026-06-01days on market $1,199,900 Active 150 DOM
-
2026-05-31days on market $1,199,900 Active 149 DOM
-
2026-05-30days on market $1,199,900 Active 148 DOM
-
2026-01-02$1,199,900 New 997-char remark
Show marketing remark (997 chars)
Proud to present the Historic Ames Sword Co Buildings! Situated in the heart of Chicopee, MA by Chicopee River, this mill presents a unique redevelopment opportunity, with great enthusiasm and collaboration from town officials to help create a vibrant residential and or commercial destination. This 5-building parcel spans over 2 acres and is zoned both Commercial & Industrial! Potential to develop affordable housing, condos, 55+ community, medical offices, luxury living units, self storage and more. Rentable Warehouse and Heated storage potential. Equipped with loading docks and freight elevators offering endless potential in an established Opportunity Zone with possible grant funding. The property is structurally sound and ideally positioned for conversion into apartments or mixed-use development. 11’ to 16’ ceilings! Don’t miss this rare chance to transform a riverside compound into a signature waterfront development with long-term value and community impact.
ⓘ Source: listings_history table (triggers on properties + properties_extension) + one-shot
backfill from property_details.listing_events for pre-trigger history.
Nearby sold comps map
Loading sold comps map…
Walkable amenities ~0.75 mi
Loading nearby amenities…
Taxation est. · year 1
- Rental income
- $192,732
- − Mortgage interest
- −$67,213
- − Property taxes
- −$17,998
- − Insurance
- −$6,000
- − Repairs & maintenance
- −$15,419
- − Management
- −$15,419
- − Depreciation
- −$34,906
- Taxable income
- $35,778
- Est. tax owed @ 24.0%
- −$8,587
- After-tax cash flow
- $44,165/yr
For passive investors: Depreciation is non-cash, so a rental often shows a tax loss while cash-flowing — sheltering income. Rental losses are passive: they offset passive income freely, and up to $25,000/yr can offset ordinary (W-2) income if you actively participate and your MAGI is under $100k (phasing out to $0 by $150k); unused losses carry forward. On sale, claimed depreciation is recaptured at up to 25%, and gains may owe capital-gains tax (a 1031 exchange can defer both). Figures are a year-1 estimate at your 24.0% rate — not tax advice; consult a CPA.
Condition & rehab AI · 12 photos
This historic multi-family property requires extensive repairs and improvements to become move-in ready. Significant investments in structural, safety, and aesthetic upgrades are necessary to increase its resale and rental value.
Repairs flagged
- Major Exposed brick — Structural integrity compromised
- Major Broken windows — Safety hazard
- Major Missing fixtures — Safety hazard
- Major Exposed ductwork — Safety hazard
- Major Overgrown vegetation — Safety hazard
Value-add opportunities
- Both Landscaping and curb appeal improvements — Enhances property's visual appeal and safety
- Both HVAC system upgrade — Improves comfort and energy efficiency
- Both Window replacements — Enhances safety and energy efficiency
- Both Fixtures installation — Enhances safety and functionality
- Both Exterior repairs — Enhances safety and visual appeal
Renovation cost estimate screening
| Repair item | Severity | Est. cost |
|---|---|---|
| Exposed brick · Structural integrity compromised | Major | $15,000–50,000 |
| Broken windows · Safety hazard | Major | $15,000–50,000 |
| Missing fixtures · Safety hazard | Major | $15,000–50,000 |
| Exposed ductwork · Safety hazard | Major | $15,000–50,000 |
| Overgrown vegetation · Safety hazard | Major | $15,000–50,000 |
| Total estimated repair cost · 5 items | $75,000–250,000 |
Value-add ROI direction
- Both Landscaping and curb appeal improvements — Enhances property's visual appeal and safety ↑
- Both HVAC system upgrade — Improves comfort and energy efficiency ↑
- Both Window replacements — Enhances safety and energy efficiency ↑
- Both Fixtures installation — Enhances safety and functionality ↑
- Both Exterior repairs — Enhances safety and visual appeal ↑
ⓘ Cost ranges are severity-bucket heuristics (US national rule-of-thumb). Get contractor quotes + a written scope before underwriting a rehab budget.
Schools (NCES district)
- District
- Chicopee
- NCES district ID
- 2503660
- Math proficiency
- 20% ▼ -22.00%
- Reading proficiency
- 33% ▼ -10.00%
- Median HH income
- $46,414
- Composite
- 22.91/100
- National rank
- #7997
- State rank
- #270 of 302 in MA
Livability — Chicopee
- Score
- 76/100
- State rank
- #66
- US rank
- #3658
Category grades
Schools grade is shown separately in the Schools card above.
Census & demographics
- Census place
- Chicopee, MA
- County
- Hampden County · 230,965 people
- City population
- 53,451
- Metro
- Springfield, MA
- Population (ZIP)
- 23,284
- Household income
- $59,759
- Rent vs Own
- Severe rent burden
- 895.0
Population outlook (Hampden County) Hauer SSP2
- Today (2025)
- 485,646 people
- By 2030
- 491,517 · +1.2%
- By 2040
- 500,539 · +3.1%
- By 2050
- 508,827 · +4.8%
- By 2075
- 539,167 · +11.0%
- By 2100
- 545,698 · +12.4%
Race, ethnicity, and origin ACS 2023
- Neighborhood character
- Majority White (58%)
- Race & ethnicity
- White 58% Hispanic / Latino 34% Two or more races 13% Black 3% Asian 2%
- Hispanic origin (detail)
- Puerto Rican 29% Dominican 2%
- Common ancestry
- Romanian 16% Lithuanian 11% Russian 2%
- Foreign-born
- 10% · Canada, Jamaica
- Languages at home
- 70% English-only · Spanish 21% Russian/Polish/Slavic 4% Other Indo-European 3%
Political lean MEDSL · Hampden
- 2024 margin
- Lean D (+8.9) · D 53.4% · R 44.5% · Other 2.1%
- 2008→2024 swing
- -16.4pp toward R · 2008: 25.3pp · 2024: 8.9pp
- All cycles
- 2024: D+8.9 2020: D+17.7 2016: D+16.0 2012: D+25.4 2008: D+25.3
Not yet ingested
- Civics
- —
Market trends
- HPI YoY
- ▼ -89.92%
- Current HPI
- 298.8896
- Rent YoY
- —
- Metro
- Springfield, MA
- State GDP YoY
- ▲ 2.28%
- F500 in state
- 38
Industry mix (Fortune 500 HQ in MA)
| Industry | F500 HQs | Revenue |
|---|---|---|
| Technology | 3 | $17B |
|
||
| Insurance | 2 | $84B |
|
||
| Retail | 2 | $76B |
|
||
| Life Sciences | 1 | $43B |
|
||
| Energy Technology | 1 | $31B |
|
||
| Aerospace / Defense | 1 | $18B |
|
||
Price history
1 event — show timeline
- 2026-01-02 Listed $1,199,900 MLS PIN
Cash-flow waterfall
monthlySold comps — $/sqft
last 12 mo · ≤1 miLoading sold comps…