 Duplex
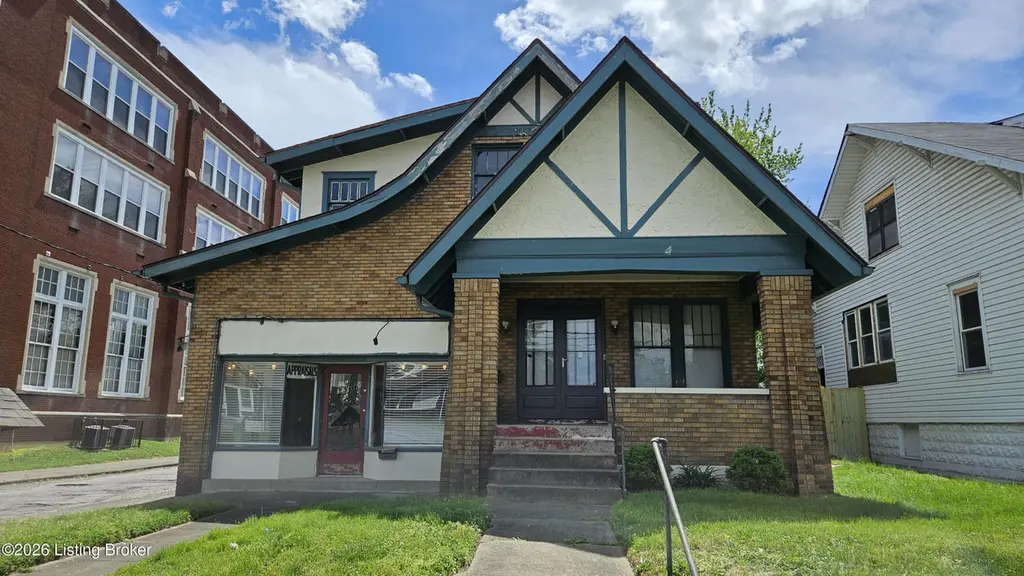
3600-3602 W Market St · Louisville, KY
Flood risk No data
- FEMA flood zone
- —
- Chance of flooding over 30 yrs
- —
- Est. flood insurance / yr
- —
Fire risk No data
- Est. fire insurance / yr
- —
Heat risk No data
- Hot days now (above threshold)
- —
- Hot days in 30 yrs
- —
Wind risk No data
- Chance of severe wind over 30 yrs
- —
Air-quality risk No data
- Unhealthy air days now
- —
- Unhealthy air days in 30 yrs
- —
Risk factors via First Street. Map © Google.
Why this score? — see what drove the A- grade
The composite is a weighted blend of 9 inputs, each scored 0–100. Each bar is that input's sub-score; the figure is the points it added to the 100-point composite (weight × sub-score).
- Cash flow +30.0/30.0
- ARV discount +15.0/15.0
- 1% rule +10.0/10.0
- DSCR +10.0/10.0
- Appreciation +10.0/10.0
- Livability +3.2/5.0
- Rent growth +2.6/5.0
- Schools +2.3/10.0
- Condition / age +1.0/5.0
$144,999
🖨 Deal sheet (PDF) 📄 Offer letter ✓ Due diligence
Multi-family units
County records classify this as Multi-Family (2-4 Unit). Listing-text estimate: 2 units. confirmed
Listing remarks
Welcome to 3600-3602 W. Market Street. Attention investors! Come check out this unique opportunity on one of the best designed houses in Louisville's West End, part of the Shawnee Neighborhood Historic District, and a genuinely great piece of history. This combination residence and commercial property duplex is a true example of Craftsman-style architecture with Tudor Revival accents: steep front-facing gable with decorative half-timbering against stucco, brick body, deep eaves, tapered porch columns on brick piers. The interior is equally impressive: a tiled fireplace with a radiating voussoir (sunburst arch) pattern in classic Arts and Crafts matte mottled brown tile, quartersawn oak trim
Key facts
- Tiled fireplace
- Large basement
- Quartersawn oak trim
Tags
Property features AI
Finance
- Other: Total building area listed by agent; Separate unit meters (multi-unit)
- HOA & community: No association fee
Exterior
- Parking: No covered parking
- Utilities: Electricity connected; Natural gas available
- Home design: Duplex; Bungalow style; Less than 1/4 acre lot
- Construction: Built in 1937; Brick and stucco construction; Shingle roof
- Exterior features: Sidewalk; Exterior details: See Remarks
Interior
- Kitchen: Kitchen on the second level
- Bedrooms: Two bedrooms (both on the second level)
- Bathrooms: One full bathroom (on the second level); One partial bathroom (on the first level)
- Heating & cooling: Forced air heating (natural gas); Wall/window cooling unit(s)
- Interior features: Basement present; Second level includes living room and dining room; See remarks for additional exterior-related interior details
- Laundry & utility: Separate meters for units (multi-unit); One furnace
Neighborhood map
What this means for you Summary
Snapshot
- This is a 2 × 2-bed/1.5-bath units multifamily listed at $145k. Condition is rated poor.
Deal economics
- At list price, monthly cash flow is $809 ($10k/yr) — positive. Per door: $405/mo.
- The deal already cash-flows at list — no discount required.
- Meets the 1% rule at list price ($2k rent vs $145k).
- Recommended offer: $136k (6.0% below list) — sets the bar for market timing.
- Cap rate 13.0% vs local median 5.0% in Louisville — top-decile yield for the area; either an underpriced asset or a hidden risk that comps aren't pricing in. Stress-test before assuming the spread holds.
Location & tenants
- Location reads 63/100 on livability (#333 in KY) — a middle-class / working-renter tenant base. Strengths: cost of living A+, housing A+; Watch: employment C-, health & safety D+, schools D-.
- Jefferson County (urban): math 19% / reading 35% proficiency, ranked #121 of 165 in KY (top 73%) — low school quality limits family demand, transient renter base, plan for 1-2y turnover.
- Market conditions: Rents flat; 140 active listings in the ZIP; 2 comparable units currently listed for rent nearby; lower-income renter base — watch delinquency; 2,836 units permitted in Jefferson County in 2024 (1,558 in 5+ unit buildings).
- At $2,293/mo this rent would consume 77% of the median local household income ($36k/yr) (locally 1148% of renters already pay >50% of income on rent) — very limited rent-growth headroom before tenants either downsize or default.
Forward outlook
- In year one you build about $16k of equity ($1k loan paydown + $14k appreciation (10.0% local appreciation)).
- Jefferson County population projected at +13% by 2050 — modest demand growth; plan on rents tracking national, not racing it.
- At projected returns (10.0% appreciation + 0.5% rent growth), your $41k cash investment doubles in ~2 years — after that, you're playing with house money.
- By year 3, paydown + projected appreciation supports a ~$39k cash-out refi (75% LTV) — recoverable capital for the next deal without selling this one.
Negotiation context
- It's been on market 63 days — a 6% lower offer ($136k) is reasonable based on typical stale-listing flexibility.
Risks & watch-outs
- Watch-outs: built in 1937 — expect roof / HVAC / electrical / plumbing capex.
Questions for the listing agent
- It's been on market 63 days. Have you received any prior offers? Is the seller open to a 6% concession, seller financing, or rate buy-down credit?
- Can we see the unit-by-unit rent roll, current vacancy, and any below-market leases? What's the average tenancy length?
- What capital expenditures (roof, boiler, parking lot, exteriors) have been made in the last 5 years, and what's planned in the next 2?
- Have any recent inspections been done? Can we get a copy of the seller's disclosures and any deferred-maintenance estimates?
- Built in 1937 — when were the roof, HVAC, electrical panel, plumbing, and water heater last replaced?
- Why hasn't it sold? Are there any deal-killer items the seller is aware of (foundation, flood, title, zoning, code violations)?
- Is there a deadline driving the sale (1031 exchange, divorce, estate, relocation)? That informs how much negotiation room exists.
- Schools are D-rated, which usually means shorter tenancies and higher turnover. Who's the typical renter profile here, and what's been the actual vacancy rate?
- Crime grade is F in this area — have there been break-ins, vandalism, or insurance claims at this property in the last 3 years? What carrier currently insures it and at what premium?
- What's the average days-on-market for RENTAL listings here right now (not sales)? A rising rental-DOM trend means longer vacancies and softer asking-rent achievability than the comps imply.
- What's the recent tenant-quality profile in this submarket — average credit score on applications, eviction rate, late-payment / NSF rate, and stable-employment percentage? A property-management company in the area should have these aggregated.
- How much new apartment / multifamily construction is in the pipeline within 1–3 miles? Heavy new supply (>2% of stock underway) typically softens rents 12–24 months out; light construction supports rent growth.
Investment metrics
- 1% rule
- 1.58% ✓
- Cap rate
- 12.99%
- Cash-on-cash
- 23.92%
- DSCR
- 2.06
- GRM
- 5.3
CMA / ARV
- ARV (on-the-fly)
- $215,208
- Comps found
- 2
Show comp detail 2 sales within ~0.75 mi
| Address | Dist | Beds/Ba | Sqft | Sold | Price | $/sf | Match |
|---|---|---|---|---|---|---|---|
| 2821 Rowan St | 0.65mi | 4/— | 2,272 (-11%) | 2mo | $190,000 | $84 | 50 |
| 670 S 38th St | 0.70mi | 4/2.0 | 2,322 (-9%) | 4mo | $82,000 | $35 | 44 |
Match score weights: distance 35% · size 25% · config 20% · recency 20%. Top-matched comps best support the ARV.
Projected returns pro-forma
10.0% appreciation · 0.51% rent growth · sell at horizon
- IRR
- 40.9%
- Equity multiple
- 4.08×
- Total profit
- $124,951
- Equity at exit
- $130,627
- IRR
- 34.3%
- Equity multiple
- 8.81×
- Total profit
- $317,233
- Equity at exit
- $281,701
Cash invested: $40,600 (down + closing). Projections, not guarantees.
Landlord ↔ Tenant lean methodology
- Overall (STATE)
- 83 Strongly Landlord-Friendly
- State Kentucky
- 83 Strongly Landlord-Friendly · R+16
- County
- — inherits STATE
- City
- — inherits STATE
ZIP-level market 40212
- Home prices YoY
- 11.0%
- Rents YoY
- 0.5%
- Active inventory
- 140
- Price-to-rent
- 10.5×
Monthly cashflow live
- Estimated rent
- $2,293 high interval (Pro) →
- Mortgage (P&I)
- −$760
- Tax est. 1.5%
- −$181 /mo · $2,175/yr
- Insurance
- −$60
- HOA
- −$0
- Vacancy / Maint / Mgmt
- −$482
- Net cashflow
- $809
Break-even live
Sensitivity live
| Price | -10% $910 | -5% $860 | +0% $809 | +5% $759 | +10% $709 |
|---|---|---|---|---|---|
| Rent | -10% $628 | -5% $719 | +0% $809 | +5% $900 | +10% $991 |
| Rate | -1.0pp $882 | -0.5pp $846 | base $809 | +0.5pp $772 | +1.0pp $734 |
2-unit breakdown (identical units grouped — click to expand)
| Units | Beds | Baths | Est. rent |
|---|---|---|---|
| 2× units | 2 | 1.5 | $2,294 |
| #1 | 2 | 1.5 | $1,147 |
| #2 | 2 | 1.5 | $1,147 |
| Total (2 units) | $2,293 | ||
UW: 25.0% down · 7.5% · 30yr · 1.5% tax · 5.0% vac · 8.0% maint · 8.0% mgmt
Financing live
Cash to close
- Down payment
- $36,250
- Closing costs
- $4,350
- Reserves months
- —
- Total cash needed
- —
Loan-product check · same deal, 3 products live
Conventional
25% down · 7.5% · 30yr
- Down + closing
- —
- Monthly P&I
- —
- Monthly cashflow
- —
- DSCR
- —
- Eligible?
- —
Personal DTI + credit; lowest rate.
DSCR
20% down · 8.5% · 30yr
- Down + closing
- —
- Monthly P&I
- —
- Monthly cashflow
- —
- DSCR
- —
- Eligible?
- —
No personal income docs; deal must DSCR.
Hard money
10% down · 12.0% · 12mo
- Down + closing
- —
- Monthly P&I
- —
- Monthly cashflow
- —
- DSCR
- —
- Eligible?
- —
Short-term bridge; refi at stabilization.
Rent comps 2 comps
| Address | Beds | Baths | Sqft | Rent | $/sqft | DOM | Units | Dist |
|---|---|---|---|---|---|---|---|---|
| 3909 W Broadway Louisville, KY | 5.0 | 2.0 | 2000 | $1,745 | $0.87 | 17d | 1 | 0.83mi |
| 820 Hazel St Louisville, KY | 4.0 | 2.0 | 1872 | $1,395 | $0.75 | 4d | 1 | 1.04mi |
Listing history 14 events
-
2026-06-18days on market $144,999 Active 63 DOM
-
2026-06-17days on market $144,999 Active 62 DOM
-
2026-06-16pricedays on market $144,999 Active 61 DOM
-
2026-06-15days on market $149,000 Active 60 DOM
-
2026-06-13days on market $149,000 Active 58 DOM
-
2026-06-10days on market $149,000 Active 55 DOM
-
2026-06-09days on market $149,000 Active 54 DOM
-
2026-06-08days on market $149,000 Active 53 DOM
-
2026-06-07days on market $149,000 Active 52 DOM
-
2026-06-03days on market $149,000 Active 48 DOM
-
2026-06-02days on market $149,000 Active 47 DOM
-
2026-06-01days on market $149,000 Active 46 DOM
-
2026-05-31days on market $149,000 Active 45 DOM
-
2026-04-16$149,000 Active
ⓘ Source: listings_history table (triggers on properties + properties_extension) + one-shot
backfill from property_details.listing_events for pre-trigger history.
Nearby sold comps map
Loading sold comps map…
Walkable amenities ~0.75 mi
Loading nearby amenities…
Taxation est. · year 1
- Rental income
- $27,516
- − Mortgage interest
- −$8,122
- − Property taxes
- −$2,175
- − Insurance
- −$725
- − Repairs & maintenance
- −$2,201
- − Management
- −$2,201
- − Depreciation
- −$4,218
- Taxable income
- $7,873
- Est. tax owed @ 24.0%
- −$1,890
- After-tax cash flow
- $7,823/yr
For passive investors: Depreciation is non-cash, so a rental often shows a tax loss while cash-flowing — sheltering income. Rental losses are passive: they offset passive income freely, and up to $25,000/yr can offset ordinary (W-2) income if you actively participate and your MAGI is under $100k (phasing out to $0 by $150k); unused losses carry forward. On sale, claimed depreciation is recaptured at up to 25%, and gains may owe capital-gains tax (a 1031 exchange can defer both). Figures are a year-1 estimate at your 24.0% rate — not tax advice; consult a CPA.
Condition & rehab AI · 12 photos
This property requires extensive repairs and maintenance to bring it up to a livable condition. Immediate attention is needed to address plumbing issues and missing fixtures. Once these repairs are completed, the property can be considered for renovation or rental.
Repairs flagged
- Major Exposed plumbing in kitchen — Needs immediate repair to prevent further damage
- Major Missing cabinets in kitchen — Needs replacement for functionality
- Major Dirty countertops in kitchen — Needs cleaning and possibly replacement
- Major Dirty floor in bathroom — Needs cleaning and possibly replacement
- Major Missing fixtures in bathroom — Needs replacement for functionality
- Major Peeling paint on exterior — Needs repainting for aesthetics
- Major Broken windows — Needs replacement for safety and aesthetics
Value-add opportunities
- Resale Painting exterior — Enhances curb appeal and value
- Resale Replacing countertops and cabinets — Improves functionality and aesthetics
- Resale Replacing missing fixtures — Improves functionality and aesthetics
- Resale Cleaning and replacing floor in bathroom — Improves functionality and aesthetics
Renovation cost estimate screening
| Repair item | Severity | Est. cost |
|---|---|---|
| Exposed plumbing in kitchen · Needs immediate repair to prevent further damage | Major | $15,000–50,000 |
| Missing cabinets in kitchen · Needs replacement for functionality | Major | $15,000–50,000 |
| Dirty countertops in kitchen · Needs cleaning and possibly replacement | Major | $15,000–50,000 |
| Dirty floor in bathroom · Needs cleaning and possibly replacement | Major | $15,000–50,000 |
| Missing fixtures in bathroom · Needs replacement for functionality | Major | $15,000–50,000 |
| Peeling paint on exterior · Needs repainting for aesthetics | Major | $15,000–50,000 |
| Broken windows · Needs replacement for safety and aesthetics | Major | $15,000–50,000 |
| Total estimated repair cost · 7 items | $105,000–350,000 |
Value-add ROI direction
- Resale Painting exterior — Enhances curb appeal and value ↑
- Resale Replacing countertops and cabinets — Improves functionality and aesthetics ↑
- Resale Replacing missing fixtures — Improves functionality and aesthetics ↑
- Resale Cleaning and replacing floor in bathroom — Improves functionality and aesthetics ↑
ⓘ Cost ranges are severity-bucket heuristics (US national rule-of-thumb). Get contractor quotes + a written scope before underwriting a rehab budget.
Schools (NCES district)
- District
- Jefferson County
- NCES district ID
- 2102990
- Math proficiency
- 19% ▼ -17.00%
- Reading proficiency
- 35% ▼ -11.00%
- Median HH income
- $47,885
- Composite
- 23.45/100
- National rank
- #7884
- State rank
- #121 of 165 in KY
Livability — Louisville
- Score
- 63/100
- State rank
- #333
- US rank
- #15887
Category grades
Schools grade is shown separately in the Schools card above.
Census & demographics
- Census place
- Louisville, KY
- County
- Jefferson County · 790,184 people
- City population
- 769,292
- Metro
- Louisville/Jefferson County, KY-IN
- Population (ZIP)
- 14,661
- Household income
- $35,753
- Rent vs Own
- Severe rent burden
- 1148.0
Population outlook (Jefferson County) Hauer SSP2
- Today (2025)
- 823,112 people
- By 2030
- 849,343 · +3.2%
- By 2040
- 895,696 · +8.8%
- By 2050
- 933,630 · +13.4%
- By 2075
- 1,028,262 · +24.9%
- By 2100
- 1,072,675 · +30.3%
Race, ethnicity, and origin ACS 2023
- Neighborhood character
- Majority Black (60%)
- Race & ethnicity
- Black 60% White 37% Two or more races 2% Hispanic / Latino 1%
- Common ancestry
- Slovak 1% Lithuanian 1% Iranian 1%
- Foreign-born
- 1% · Canada
- Languages at home
- 98% English-only · Spanish 1%
Political lean MEDSL · Jefferson
- 2024 margin
- D (+16.6) · D 57.4% · R 40.9% · Other 1.7%
- 2008→2024 swing
- +4.5pp toward D · 2008: 12.0pp · 2024: 16.6pp
- All cycles
- 2024: D+16.6 2020: D+20.1 2016: D+13.3 2012: D+11.1 2008: D+12.0
Not yet ingested
- Civics
- —
Market trends
- HPI YoY
- ▲ 29.02%
- Current HPI
- 293.2624
- Rent YoY
- ▲ 0.51%
- Metro
- Louisville/Jefferson County, KY-IN
- State GDP YoY
- ▲ 1.81%
- F500 in state
- 4
Industry mix (Fortune 500 HQ in KY)
| Industry | F500 HQs | Revenue |
|---|---|---|
| Healthcare | 1 | $118B |
|
||
| Food / Beverage | 1 | $7B |
|
||
Price history
1 event — show timeline
- 2026-04-16 Listed $149,000 Metro Search MLS
Cash-flow waterfall
monthlySold comps — $/sqft
last 12 mo · ≤1 miLoading sold comps…