521 Mallard Ct · Poinciana, FL
Flood risk 1/10 · Minimal
- FEMA flood zone
- A
- Chance of flooding over 30 yrs
- 0.0%
- Est. flood insurance / yr
- $1,009 – $1,996
Fire risk 6/10 · Moderate
- Est. fire insurance / yr
- $947 – $1,759
Heat risk 8/10 · Major
- Hot days now (above 108°F)
- 7 days/yr
- Hot days in 30 yrs
- 24 days/yr
Wind risk 9/10 · Severe
- Chance of severe wind over 30 yrs
- 99.0%
Air-quality risk 1/10 · Minimal
- Unhealthy air days now
- 0 days/yr
- Unhealthy air days in 30 yrs
- 0 days/yr
Risk factors via First Street. Map © Google.
Why this score? — see what drove the B grade
The composite is a weighted blend of 9 inputs, each scored 0–100. Each bar is that input's sub-score; the figure is the points it added to the 100-point composite (weight × sub-score).
- Cash flow +30.0/30.0
- 1% rule +10.0/10.0
- DSCR +10.0/10.0
- ARV discount +7.5/15.0
- Appreciation +4.3/10.0
- Schools +3.5/10.0
- Livability +2.9/5.0
- Rent growth +2.8/5.0
- Condition / age +2.5/5.0
$119,999
🖨 Deal sheet 📄 Offer letter ✓ Due diligence
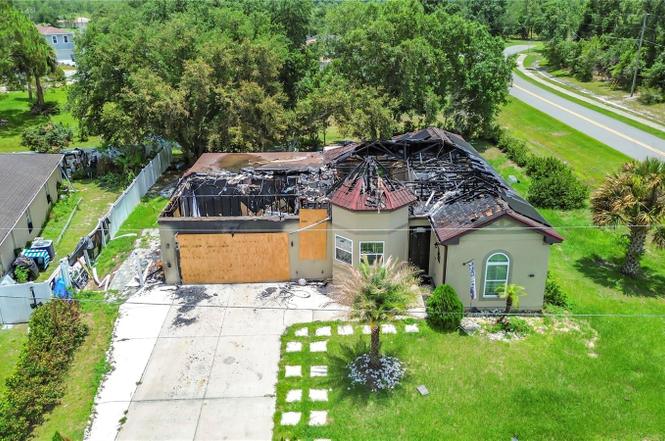
Listing remarks
Investor Special! Rare opportunity to acquire a fire-damaged property on a spacious corner lot with tremendous redevelopment potential. The existing structure sustained significant fire damage and is being sold strictly As-Is. Ideal for investors, builders, contractors, or anyone seeking their next renovation or rebuild project. Situated on a desirable corner homesite, this property offers a head start with existing utilities, driveway, and established footprint already in place. Whether you choose to renovate, rebuild, or explore other development possibilities, this property presents an excellent value-add opportunity in a growing area. Buyer is responsible for conducting all due diligenc
Key facts
- Existing utilities
- Spacious corner lot
- 0.27 acre lot
Tags
Property features AI
Finance
- Other: Pets allowed
- Financial info: Monthly HOA $91; Total monthly fees listed as $91; Total annual fees listed as $1,092
- HOA & community: Has HOA (monthly fee $91); Association name: Mark Maldonado; Association fee required
Exterior
- Parking: Attached garage; 2-car garage
- Utilities: Public sewer; Cable available; Electricity available; Water available; No water source listed
- Home design: Single Family Residence; One story; Faces northwest; PUD zoning; Homestead exemption
- Construction: Block construction; Shingle roof; Slab foundation; Built as single-story (one level)
- Exterior features: Other exterior features; Paved road access
Interior
- Kitchen: No appliances included
- Bedrooms: 3 bedrooms
- Flooring: Other flooring
- Bathrooms: 2 full bathrooms
- Heating & cooling: Central heating; Central air conditioning
- Interior features: Other interior features
- Laundry & utility: Dedicated laundry room
Neighborhood map
What this means for you Summary
Snapshot
- This is a 3-bed/2.0-bath single-family listed at $120k.
Deal economics
- At list price, monthly cash flow is $330 ($4k/yr) — positive.
- The deal already cash-flows at list — no discount required.
- Meets the 1% rule at list price ($2k rent vs $120k).
- Cap rate 10.8% vs local median 4.3% in Poinciana — top-decile yield for the area; either an underpriced asset or a hidden risk that comps aren't pricing in. Stress-test before assuming the spread holds.
Location & tenants
- Location reads 57/100 on livability (#859 in FL) — a working-class tenant base; expect higher turnover. Strengths: cost of living A+, housing A+; Watch: employment D+, schools F, amenities F.
- Polk (suburban): math 39% / reading 43% proficiency, ranked #62 of 73 in FL (top 85%) — families likely to look elsewhere, expect single-tenant / working-renter base with shorter leases.
- Market conditions: Rents rising (+1.1%/yr); 1151 active listings in the ZIP; 40 comparable units currently listed for rent nearby; rentals at typical pace (median 24d on market — plan ~3-4 weeks tenant-placement turnaround); 10,384 units permitted in Polk County in 2024 (1,716 in 5+ unit buildings).
- This rent runs 33% of the median local income ($69k/yr) — at the standard rent-burdened threshold; future hikes will face affordability resistance.
Forward outlook
- Local home prices are declining (-1.5%/yr); year-one equity from $829 of loan paydown is wiped out by about $2k of value loss. Plan a longer hold.
- Polk County population projected at +33% by 2050 — long-run rental-demand tailwind backs the buy-and-hold thesis.
- At projected returns (-1.5% appreciation + 1.1% rent growth), your $34k cash investment doubles in ~10 years — after that, you're playing with house money.
Negotiation context
- Only 1 days on market — expect competitive offers; lowballing is unlikely to land.
- 2 sale attempts since 4y ago with the ask held roughly flat each time — persistent listings suggest the price (not the market) is what's stuck; bring a comps-based counter.
Risks & watch-outs
- Watch-outs: property tax is 2.6% of price; flood insurance adds $125/mo.
- Climate carrying-cost: in FEMA flood zone A (mandatory federal flood insurance); severe wind risk, 99% chance of damaging wind over 30y; major wildfire risk; extreme-heat days projected 7→24/yr by 2055 (HVAC capex compounding) — expect insurance premiums to compound above CPI over the hold.
Questions for the listing agent
- Property tax is high relative to price — has the assessment been appealed recently, and will the sale trigger a re-assessment?
- What's the actual annual flood-insurance premium (NFIP or private), and is the property in a SFHA with mandatory coverage?
- What does the HOA fee cover, when was the last increase, and are there any pending special assessments or reserve-fund shortfalls?
- Is there a deadline driving the sale (1031 exchange, divorce, estate, relocation)? That informs how much negotiation room exists.
- Schools are F-rated, which usually means shorter tenancies and higher turnover. Who's the typical renter profile here, and what's been the actual vacancy rate?
- What's the average days-on-market for RENTAL listings here right now (not sales)? A rising rental-DOM trend means longer vacancies and softer asking-rent achievability than the comps imply.
- What's the recent tenant-quality profile in this submarket — average credit score on applications, eviction rate, late-payment / NSF rate, and stable-employment percentage? A property-management company in the area should have these aggregated.
- How much new for-sale + rental construction is in the pipeline within 1–3 miles? Heavy new supply typically softens prices + rents 12–24 months out; constrained supply supports both.
Investment metrics
- 1% rule
- 1.57% ✓
- Cap rate
- 10.85%
- Cash-on-cash
- 16.27%
- DSCR
- 1.72
- GRM
- 5.3
CMA / ARV
No comps found within radius.
Projected returns pro-forma
-1.48% appreciation · 1.14% rent growth · sell at horizon
- IRR
- 4.4%
- Equity multiple
- 1.18×
- Total profit
- $6,205
- Equity at exit
- $26,234
- IRR
- 9.5%
- Equity multiple
- 1.80×
- Total profit
- $26,933
- Equity at exit
- $25,283
Cash invested: $33,600 (down + closing). Projections, not guarantees.
Landlord ↔ Tenant lean methodology
- Overall (STATE)
- 87 Strongly Landlord-Friendly
- State Florida
- 87 Strongly Landlord-Friendly · R+3
- County
- — inherits STATE
- City
- — inherits STATE
ZIP-level market 34759
- Home prices YoY
- -0.5%
- Rents YoY
- 1.1%
- Active inventory
- 1151
- Price-to-rent
- 5.3×
Monthly cashflow live
- Estimated rent
- $1,884 high interval (Pro) →
- Mortgage (P&I)
- −$629
- Tax from tax record
- −$263 /mo · $3,150/yr
- Insurance
- −$50
- Flood insurance flood zone
- −$125 /mo · $1,502/yr
- HOA
- −$91
- Vacancy / Maint / Mgmt
- −$396
- Net cashflow
- $330
Break-even live
UW: 25.0% down · 7.5% · 30yr · 1.5% tax · 5.0% vac · 8.0% maint · 8.0% mgmt
Financing live
Cash to close
- Down payment
- $30,000
- Closing costs
- $3,600
- Reserves months
- —
- Total cash needed
- —
Loan-product check · same deal, 3 products live
Conventional
25% down · 7.5% · 30yr
- Down + closing
- —
- Monthly P&I
- —
- Monthly cashflow
- —
- DSCR
- —
- Eligible?
- —
Personal DTI + credit; lowest rate.
DSCR
20% down · 8.5% · 30yr
- Down + closing
- —
- Monthly P&I
- —
- Monthly cashflow
- —
- DSCR
- —
- Eligible?
- —
No personal income docs; deal must DSCR.
Hard money
10% down · 12.0% · 12mo
- Down + closing
- —
- Monthly P&I
- —
- Monthly cashflow
- —
- DSCR
- —
- Eligible?
- —
Short-term bridge; refi at stabilization.
Rent comps 40 comps
| Address | Beds | Baths | Sqft | Rent | $/sqft | DOM | Units | Dist |
|---|---|---|---|---|---|---|---|---|
| 435 Magpie Ct Kissimmee, FL | 4.0 | 2.0 | 1413 | $1,725 | $1.22 | 23d | 1 | 0.27mi |
| 568 Kingfisher Dr Kissimmee, FL | 3.0 | 2.0 | 1278 | $1,750 | $1.37 | 23d | 1 | 0.28mi |
| 567 Hummingbird Ct Kissimmee, FL | 4.0 | 2.5 | 2113 | $2,000 | $0.95 | 14d | 1 | 0.35mi |
| 568 Finch Ct Kissimmee, FL | 3.0 | 2.0 | 1904 | $1,800 | $0.95 | 23d | 1 | 0.57mi |
| 442 Flamingo Ct Kissimmee, FL | 3.0 | 2.0 | 1456 | $1,695 | $1.16 | 23d | 1 | 0.60mi |
| 1405 Teal Ct Poinciana, FL | 4.0 | 2.0 | 1605 | $1,700 | $1.06 | 23d | 1 | 0.60mi |
| 606 Robin Ln Kissimmee, FL | 4.0 | 2.0 | 1513 | $1,750 | $1.16 | 14d | 1 | 0.60mi |
| 606 Robin Ln Kissimmee, FL | 4.0 | 2.0 | 1513 | $1,750 | $1.16 | 23d | 1 | 0.60mi |
| 445 Eagle Dr Kissimmee, FL | 4.0 | 2.0 | 1580 | $1,839 | $1.16 | 21d | 1 | 0.65mi |
| 539 Finch Ct Kissimmee, FL | 4.0 | 2.0 | 1867 | $1,749 | $0.94 | 10d | 1 | 0.67mi |
| 539 Finch Ct Kissimmee, FL | 4.0 | 2.0 | 1867 | $1,749 | $0.94 | 23d | 1 | 0.67mi |
| 575 Eagle Ct Unit 116 Kissimmee, FL | 3.0 | 2.0 | 1183 | $1,000 | $0.85 | 3d | 1 | 0.69mi |
| 557 Eagle Ct Kissimmee, FL | 4.0 | 3.0 | 1672 | $2,000 | $1.20 | 3d | 1 | 0.70mi |
| 426 Eagle Dr Kissimmee, FL | 4.0 | 2.0 | 1750 | $1,995 | $1.14 | 23d | 1 | 0.70mi |
| 1431 Teal Dr Kissimmee, FL | 4.0 | 2.5 | 2215 | $2,445 | $1.10 | 2d | 1 | 0.73mi |
| 510 Eagle Ct Kissimmee, FL | 3.0 | 2.0 | 1332 | $1,650 | $1.24 | 23d | 1 | 0.74mi |
| 701 Pelican Ct Kissimmee, FL | 3.0 | 2.0 | 1522 | $1,785 | $1.17 | 19d | 1 | 0.76mi |
| 723 Parrot Ct Kissimmee, FL | 3.0 | 2.0 | 1535 | $1,850 | $1.21 | 23d | 1 | 0.83mi |
| 601 Dunlin Ln Kissimmee, FL | 4.0 | 2.0 | 1750 | $2,064 | $1.18 | 3d | 1 | 0.83mi |
| 754 Pelican Ct Kissimmee, FL | 3.0 | 2.0 | 1306 | $1,695 | $1.30 | 3d | 1 | 0.85mi |
| 747 Pelican Ct Kissimmee, FL | 4.0 | 2.5 | 2113 | $2,100 | $0.99 | 14d | 1 | 0.87mi |
| 535 Cardinal Dr Kissimmee, FL | 4.0 | 2.0 | 1647 | $1,774 | $1.08 | 3d | 1 | 0.88mi |
| 612 Bluebill Ct Unit A Kissimmee, FL | 3.0 | 2.0 | 1162 | $1,650 | $1.42 | 3d | 1 | 0.97mi |
| 514 Blackbird Ln Unit B Kissimmee, FL | 3.0 | 2.0 | 1394 | $1,600 | $1.15 | 21d | 1 | 1.00mi |
| 510 Blackbird Ln Kissimmee, FL | 3.0 | 2.0 | 1207 | $1,599 | $1.32 | 23d | 1 | 1.00mi |
| 510 Blackbird Ln Kissimmee, FL | 3.0 | 2.0 | 1207 | $1,650 | $1.37 | 10d | 1 | 1.00mi |
| 517 Blackbird Ln Kissimmee, FL | 3.0 | 2.0 | 1304 | $1,530 | $1.17 | 23d | 1 | 1.03mi |
| 519 Blackbird Ln Kissimmee, FL | 3.0 | 2.0 | 1200 | $1,700 | $1.42 | 23d | 1 | 1.03mi |
| 627 Bluebill Ct Kissimmee, FL | 3.0 | 2.0 | 1430 | $1,760 | $1.23 | 23d | 1 | 1.03mi |
| 539 Albatross Dr Unit B Kissimmee, FL | 3.0 | 2.0 | 1220 | $1,500 | $1.23 | 23d | 1 | 1.05mi |
| 702 Bluebill Pl Unit A Poinciana, FL | 3.0 | 2.0 | 1240 | $1,650 | $1.33 | 23d | 1 | 1.05mi |
| 411 Blackbird Way Kissimmee, FL | 3.0 | 2.0 | 1440 | $1,550 | $1.08 | 23d | 1 | 1.06mi |
| 627B Bittern Ct Kissimmee, FL | 2.0 | 2.0 | 1113 | $1,400 | $1.26 | 12d | 1 | 1.06mi |
| 627 Bittern Ct Unit B Kissimmee, FL | 2.0 | 2.0 | 1113 | $1,400 | $1.26 | 3d | 1 | 1.06mi |
| 439 Albatross Ct Unit B Kissimmee, FL | 3.0 | 2.0 | 1344 | $1,700 | $1.26 | 23d | 1 | 1.07mi |
| 639 Bittern Ct Poinciana, FL | 3.0 | 2.0 | 1837 | $1,730 | $0.94 | 19d | 1 | 1.08mi |
| 504 Albatross Dr Kissimmee, FL | 3.0 | 2.0 | 1250 | $1,700 | $1.36 | 23d | 1 | 1.10mi |
| 504 Albatross Dr Kissimmee, FL | 3.0 | 2.0 | 1250 | $1,700 | $1.36 | 3d | 1 | 1.10mi |
| 401 Albatross Ct Unit B Kissimmee, FL | 3.0 | 2.0 | 1200 | $1,650 | $1.38 | 23d | 1 | 1.12mi |
| 736 Bittern Ln Kissimmee, FL | 3.0 | 2.0 | 1200 | $1,775 | $1.48 | 23d | 1 | 1.13mi |
HOA detail
- Monthly dues
- $91 · $1,092/yr
Listing history 2 events
-
2026-06-19remarks 699-char remark
-
2026-06-19$119,999 Active 1 DOM
ⓘ Source: listings_history table (triggers on properties + properties_extension) + one-shot
backfill from property_details.listing_events for pre-trigger history.
Tax reassessment forecast FL · Resets to sale price
- Current annual tax
- $3,150 · $263/mo
- Projected year-2 tax
- $3,150 · $263/mo
- Expected delta
- $0/yr ($0/mo · 0.0%)
ⓘ Screening estimate from a state-policy table — verify with the county assessor before closing.
Climate risk First Street
- Flood 1/10 Low FEMA zone A · 0% chance over 30 yrs
- Wildfire 6/10 Major
- Heat 8/10 Severe 7 d/yr ≥108°F today · 24 d/yr by 30 yrs out
- Wind 9/10 Extreme 99% chance of damaging wind over 30 yrs
- Air quality 1/10 Low 0 unhealthy d/yr today · 0 by 30 yrs out
Nearby sold comps map
Loading sold comps map…
Walkable amenities ~0.75 mi
Loading nearby amenities…
Taxation est. · year 1
- Rental income
- $22,608
- − Mortgage interest
- −$6,722
- − Property taxes
- −$3,150
- − Insurance
- −$2,102
- − Repairs & maintenance
- −$1,809
- − Management
- −$1,809
- − HOA
- −$1,092
- − Depreciation
- −$3,491
- Taxable income
- $2,433
- Est. tax owed @ 24.0%
- −$584
- After-tax cash flow
- $3,380/yr
For passive investors: Depreciation is non-cash, so a rental often shows a tax loss while cash-flowing — sheltering income. Rental losses are passive: they offset passive income freely, and up to $25,000/yr can offset ordinary (W-2) income if you actively participate and your MAGI is under $100k (phasing out to $0 by $150k); unused losses carry forward. On sale, claimed depreciation is recaptured at up to 25%, and gains may owe capital-gains tax (a 1031 exchange can defer both). Figures are a year-1 estimate at your 24.0% rate — not tax advice; consult a CPA.
Schools (NCES district)
- District
- Polk
- NCES district ID
- 1201590
- Math proficiency
- 39% ▼ -11.00%
- Reading proficiency
- 43% ▼ -4.00%
- Median HH income
- $43,979
- Composite
- 34.74/100
- National rank
- #5132
- State rank
- #62 of 73 in FL
Livability — Poinciana
- Score
- 57/100
- State rank
- #859
- US rank
- #21760
Category grades
Schools grade is shown separately in the Schools card above.
Census & demographics
- Census place
- Poinciana, FL
- County
- Polk County · 740,051 people
- City population
- 91,336
- Metro
- Lakeland-Winter Haven, FL
- Population (ZIP)
- 44,568
- Household income
- $69,373
- Rent vs Own
- Severe rent burden
- 1186.0
Population outlook (Polk County) Hauer SSP2
- Today (2025)
- 752,975 people
- By 2030
- 804,621 · +6.9%
- By 2040
- 906,117 · +20.3%
- By 2050
- 1,000,476 · +32.9%
- By 2075
- 1,197,520 · +59.0%
- By 2100
- 1,271,518 · +68.9%
Race, ethnicity, and origin ACS 2023
- Neighborhood character
- Diverse neighborhood (Simpson 0.62)
- Race & ethnicity
- Hispanic / Latino 55% White 21% Two or more races 20% Black 19%
- Hispanic origin (detail)
- Mexican 2% Puerto Rican 38% Cuban 6% Dominican 3%
- Common ancestry
- Hispanic 3% Romanian 2% Scotch-Irish 1%
- Foreign-born
- 17% · Canada, Jamaica
- Languages at home
- 49% English-only · Spanish 48% French/Haitian/Cajun 2%
Political lean MEDSL · Polk
- 2024 margin
- Strong R (+20.7) · D 39.2% · R 59.9%
- 2008→2024 swing
- -14.6pp toward R · 2008: -6.1pp · 2024: -20.7pp
- All cycles
- 2024: R+20.7 2020: R+14.4 2016: R+14.1 2012: R+6.8 2008: R+6.1
Not yet ingested
- Civics
- —
Market trends
- HPI YoY
- ▼ -1.48%
- Current HPI
- 276.6861
- Rent YoY
- ▲ 1.14%
- Metro
- Lakeland-Winter Haven, FL
- State GDP YoY
- ▲ 3.28%
- F500 in state
- 36
Industry mix (Fortune 500 HQ in FL)
| Industry | F500 HQs | Revenue |
|---|---|---|
| Industrial Technology | 2 | $29B |
|
||
| Insurance | 2 | $17B |
|
||
| Retail | 1 | $60B |
|
||
| Technology Distribution | 1 | $58B |
|
||
| Homebuilding | 1 | $35B |
|
||
| Technology Manufacturing | 1 | $35B |
|
||
Price history
-53.1% since first listed5 events — show timeline
- 2026-06-18 Listed $119,999 Stellar MLS as Distributed by MLS Grid
- 2022-11-30 Listing Removed — Stellar MLS as Distributed by MLS Grid
- 2022-08-30 Price Changed $369,997 Stellar MLS as Distributed by MLS Grid
- 2022-08-17 Listed $389,997 Stellar MLS as Distributed by MLS Grid
- 2018-08-09 Sold (Public Records) $256,000 Public Records
Property tax history
+33.2%/yrLatest (2025): $3,150 · +6.0% YoY. Source: county tax records.
Cash-flow waterfall
monthlySold comps — $/sqft
last 12 mo · ≤1 miLoading sold comps…