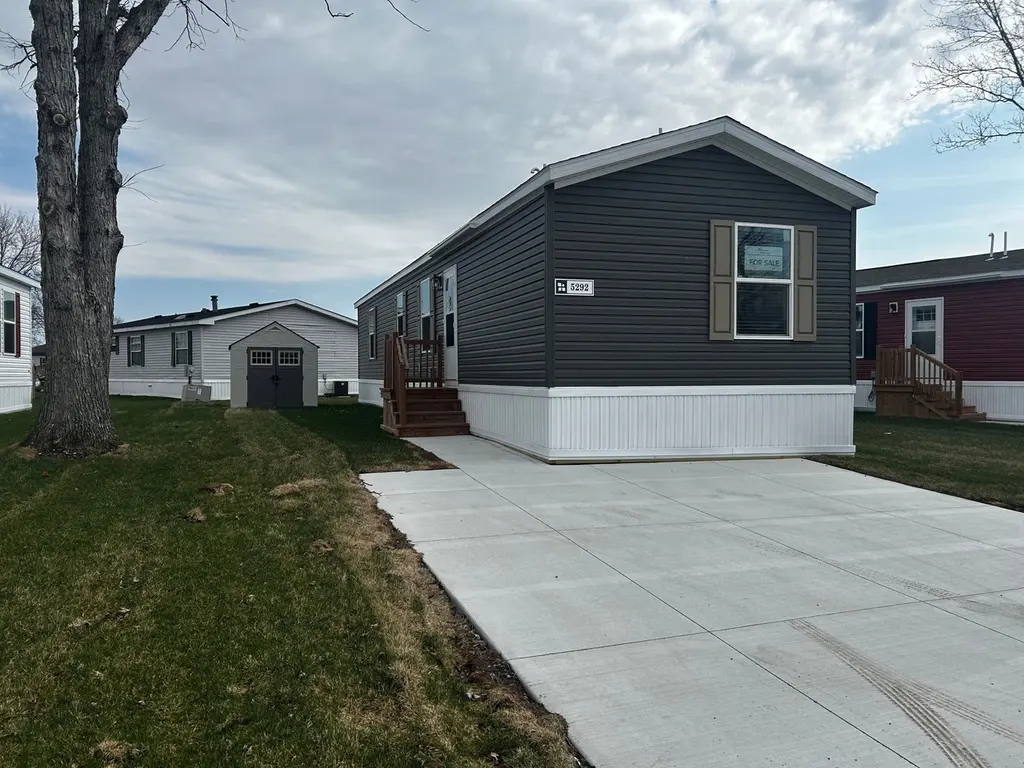
5292 Americana · New Baltimore, MI
Flood risk No data
- FEMA flood zone
- —
- Chance of flooding over 30 yrs
- —
- Est. flood insurance / yr
- —
Fire risk No data
- Est. fire insurance / yr
- —
Heat risk No data
- Hot days now (above threshold)
- —
- Hot days in 30 yrs
- —
Wind risk No data
- Chance of severe wind over 30 yrs
- —
Air-quality risk No data
- Unhealthy air days now
- —
- Unhealthy air days in 30 yrs
- —
Risk factors via First Street. Map © Google.
Why this score? — see what drove the B grade
The composite is a weighted blend of 9 inputs, each scored 0–100. Each bar is that input's sub-score; the figure is the points it added to the 100-point composite (weight × sub-score).
- Cash flow +30.0/30.0
- 1% rule +10.0/10.0
- DSCR +10.0/10.0
- ARV discount +7.5/15.0
- Schools +4.4/10.0
- Livability +4.2/5.0
- Condition / age +4.0/5.0
- Rent growth +2.5/5.0
- Appreciation +0.0/10.0
$56,900
🖨 Deal sheet (PDF) 📄 Offer letter ✓ Due diligence
Listing remarks MLS
Land is leased, not owned.
Key facts
- Built 2026
- Listed 71 days
Neighborhood map
What this means for you Summary
Snapshot
- This is a 2-bed/2.0-bath manufactured listed at $57k. Condition is rated good.
Deal economics
- At list price, monthly cash flow is $554 ($7k/yr) — positive.
- The deal already cash-flows at list — no discount required.
- Meets the 1% rule at list price ($1k rent vs $57k).
- Recommended offer: $53k (6.0% below list) — sets the bar for market timing.
- Cap rate 18.0% vs local median 2.6% in New Baltimore — top-decile yield for the area; either an underpriced asset or a hidden risk that comps aren't pricing in. Stress-test before assuming the spread holds.
Location & tenants
- Location reads 85/100 on livability (#30 in MI, #597 nationally) — a professional / high-income tenant draw. Strengths: crime A+, employment A+, cost of living A+; Watch: health & safety D+, amenities F.
- Anchor Bay School District (suburban): math 44% / reading 54% proficiency, ranked #91 of 540 in MI (top 17%) — families likely to look elsewhere, expect single-tenant / working-renter base with shorter leases; only 20% free/reduced lunch — higher-income household profile.
- Market conditions: 29 active listings in the ZIP; 1 comparable units currently listed for rent nearby; 232 units permitted in St. Clair County in 2024 (0 in 5+ unit buildings).
Forward outlook
- Local home prices are declining (-3.0%/yr); year-one equity from $393 of loan paydown is wiped out by about $2k of value loss. Plan a longer hold.
- St. Clair County population projected at -20% by 2050 — secular population decline; favor cash flow + early exit over multi-decade hold.
- At projected returns (-3.0% appreciation + 3.0% rent growth), your $16k cash investment doubles in ~3 years — after that, you're playing with house money.
Negotiation context
- It's been on market 72 days — a 6% lower offer ($53k) is reasonable based on typical stale-listing flexibility.
Questions for the listing agent
- It's been on market 72 days. Have you received any prior offers? Is the seller open to a 6% concession, seller financing, or rate buy-down credit?
- Why hasn't it sold? Are there any deal-killer items the seller is aware of (foundation, flood, title, zoning, code violations)?
- Is there a deadline driving the sale (1031 exchange, divorce, estate, relocation)? That informs how much negotiation room exists.
- Schools are B-rated — typically a magnet for longer-tenancy family renters. What's the average tenant stay here, and is there a school-zone premium baked into asking?
- What's the average days-on-market for RENTAL listings here right now (not sales)? A rising rental-DOM trend means longer vacancies and softer asking-rent achievability than the comps imply.
- What's the recent tenant-quality profile in this submarket — average credit score on applications, eviction rate, late-payment / NSF rate, and stable-employment percentage? A property-management company in the area should have these aggregated.
- How much new for-sale + rental construction is in the pipeline within 1–3 miles? Heavy new supply typically softens prices + rents 12–24 months out; constrained supply supports both.
Investment metrics
- 1% rule
- 2.11% ✓
- Cap rate
- 17.98%
- Cash-on-cash
- 41.73%
- DSCR
- 2.86
- GRM
- 4.0
CMA / ARV
- ARV (median comp)
- $19,000
- List price
- $56,900
- Delta
- 199.47%
- Verdict
- OVERPRICED
- Comps
- 1 within 2.0 mi
Show comp detail 1 sale within ~0.75 mi
| Address | Dist | Beds/Ba | Sqft | Sold | Price | $/sf | Match |
|---|---|---|---|---|---|---|---|
| 5238 Bud Ln | 0.09mi | 2/1.0 | 1,000 (+4%) | 3mo | $19,000 | $19 | 82 |
Match score weights: distance 35% · size 25% · config 20% · recency 20%. Top-matched comps best support the ARV.
Projected returns pro-forma
-3.0% appreciation · 3.0% rent growth · sell at horizon
- IRR
- 38.4%
- Equity multiple
- 2.64×
- Total profit
- $26,082
- Equity at exit
- $8,484
- IRR
- 44.8%
- Equity multiple
- 5.28×
- Total profit
- $68,218
- Equity at exit
- $4,920
Cash invested: $15,932 (down + closing). Projections, not guarantees.
Landlord ↔ Tenant lean methodology
- Overall (STATE)
- 62 Landlord-Friendly
- State Michigan
- 62 Landlord-Friendly · EVEN
- County
- — inherits STATE
- City
- — inherits STATE
ZIP-level market 48064
- Home prices YoY
- -34.8%
- Active inventory
- 29
- Price-to-rent
- 4.0×
Monthly cashflow live
- Estimated rent
- $1,199 medium interval (Pro) →
- Mortgage (P&I)
- −$298
- Tax est. 1.5%
- −$71 /mo · $854/yr
- Insurance
- −$24
- HOA
- −$0
- Vacancy / Maint / Mgmt
- −$252
- Net cashflow
- $554
Break-even live
Sensitivity live
| Price | -10% $593 | -5% $574 | +0% $554 | +5% $534 | +10% $515 |
|---|---|---|---|---|---|
| Rent | -10% $459 | -5% $507 | +0% $554 | +5% $601 | +10% $649 |
| Rate | -1.0pp $583 | -0.5pp $568 | base $554 | +0.5pp $539 | +1.0pp $524 |
UW: 25.0% down · 7.5% · 30yr · 1.5% tax · 5.0% vac · 8.0% maint · 8.0% mgmt
Financing live
Cash to close
- Down payment
- $14,225
- Closing costs
- $1,707
- Reserves months
- —
- Total cash needed
- —
Loan-product check · same deal, 3 products live
Conventional
25% down · 7.5% · 30yr
- Down + closing
- —
- Monthly P&I
- —
- Monthly cashflow
- —
- DSCR
- —
- Eligible?
- —
Personal DTI + credit; lowest rate.
DSCR
20% down · 8.5% · 30yr
- Down + closing
- —
- Monthly P&I
- —
- Monthly cashflow
- —
- DSCR
- —
- Eligible?
- —
No personal income docs; deal must DSCR.
Hard money
10% down · 12.0% · 12mo
- Down + closing
- —
- Monthly P&I
- —
- Monthly cashflow
- —
- DSCR
- —
- Eligible?
- —
Short-term bridge; refi at stabilization.
Rent comps 1 comps
| Address | Beds | Baths | Sqft | Rent | $/sqft | DOM | Units | Dist |
|---|---|---|---|---|---|---|---|---|
| 5407 Aloha Ln Casco, MI | 2.0–3.0 | 2.0–3.0 | 1152 | $1,199 | $1.04 | 0d | 1 | 0.21mi |
Listing history 15 events
-
2026-06-21days on market $56,900 Active 72 DOM
-
2026-06-18days on market $56,900 Active 69 DOM
-
2026-06-17days on market $56,900 Active 68 DOM
-
2026-06-16days on market $56,900 Active 67 DOM
-
2026-06-15days on market $56,900 Active 66 DOM
-
2026-06-13days on market $56,900 Active 64 DOM
-
2026-06-09days on market $56,900 Active 60 DOM
-
2026-06-08days on market $56,900 Active 59 DOM
-
2026-06-07days on market $56,900 Active 58 DOM
-
2026-06-04days on market $56,900 Active 55 DOM
-
2026-06-03days on market $56,900 Active 54 DOM
-
2026-06-02days on market $56,900 Active 53 DOM
-
2026-06-01days on market $56,900 Active 52 DOM
-
2026-05-31days on market $56,900 Active 51 DOM
-
2026-04-10$56,900 Active 26-char remark
Show marketing remark (26 chars)
Land is leased, not owned.
ⓘ Source: listings_history table (triggers on properties + properties_extension) + one-shot
backfill from property_details.listing_events for pre-trigger history.
Nearby sold comps map
Loading sold comps map…
Walkable amenities ~0.75 mi
Loading nearby amenities…
Taxation est. · year 1
- Rental income
- $14,388
- − Mortgage interest
- −$3,187
- − Property taxes
- −$854
- − Insurance
- −$284
- − Repairs & maintenance
- −$1,151
- − Management
- −$1,151
- − Depreciation
- −$1,655
- Taxable income
- $6,105
- Est. tax owed @ 24.0%
- −$1,465
- After-tax cash flow
- $5,183/yr
For passive investors: Depreciation is non-cash, so a rental often shows a tax loss while cash-flowing — sheltering income. Rental losses are passive: they offset passive income freely, and up to $25,000/yr can offset ordinary (W-2) income if you actively participate and your MAGI is under $100k (phasing out to $0 by $150k); unused losses carry forward. On sale, claimed depreciation is recaptured at up to 25%, and gains may owe capital-gains tax (a 1031 exchange can defer both). Figures are a year-1 estimate at your 24.0% rate — not tax advice; consult a CPA.
Condition & rehab AI · 2 photos
This modern manufactured home in Ravinia Anchor Bay is in excellent condition with a good condition score of 80. It is move-in ready with smart home features and energy-efficient appliances, making it an attractive option for both resale and rental markets.
Value-add opportunities
- Both Smart home features — Enhances comfort and energy efficiency.
- Both Smart thermostats — Improves energy efficiency and comfort.
- Both Smart lighting — Enhances energy efficiency and ambiance.
- Both Smart security systems — Enhances safety and convenience.
Renovation cost estimate screening
Value-add ROI direction
- Both Smart home features — Enhances comfort and energy efficiency. ↑
- Both Smart thermostats — Improves energy efficiency and comfort. ↑
- Both Smart lighting — Enhances energy efficiency and ambiance. ↑
- Both Smart security systems — Enhances safety and convenience. ↑
ⓘ Cost ranges are severity-bucket heuristics (US national rule-of-thumb). Get contractor quotes + a written scope before underwriting a rehab budget.
Schools (NCES district)
- District
- Anchor Bay School District
- NCES district ID
- 2602790
- Math proficiency
- 44% ▼ -12.00%
- Reading proficiency
- 54% ▼ -7.00%
- Median HH income
- $70,173
- Composite
- 43.85/100
- National rank
- #2925
- State rank
- #91 of 540 in MI
Livability — New Baltimore
- Score
- 85/100
- State rank
- #30
- US rank
- #597
Category grades
Schools grade is shown separately in the Schools card above.
Census & demographics
- Population (ZIP)
- 3,996
Population outlook (St. Clair County) Hauer SSP2
- Today (2025)
- 154,587 people
- By 2030
- 150,031 · -2.9%
- By 2040
- 138,177 · -10.6%
- By 2050
- 124,390 · -19.5%
- By 2075
- 95,825 · -38.0%
- By 2100
- 68,672 · -55.6%
Race, ethnicity, and origin ACS 2023
- Neighborhood character
- Predominantly White (92%)
- Race & ethnicity
- White 92% Hispanic / Latino 6% Two or more races 1%
- Hispanic origin (detail)
- Mexican 4%
- Common ancestry
- Romanian 16% Lithuanian 11% German 2%
- Foreign-born
- 4% · Canada
- Languages at home
- 94% English-only · Spanish 4% German/W. Germanic 1% French/Haitian/Cajun 1%
Political lean MEDSL · St. Clair
- 2024 margin
- Solid R (+34.6) · D 32.0% · R 66.6% · Other 1.4%
- 2008→2024 swing
- -37.3pp toward R · 2008: 2.6pp · 2024: -34.6pp
- All cycles
- 2024: R+34.6 2020: R+30.2 2016: R+31.4 2012: R+7.1 2008: D+2.6
Not yet ingested
- Civics
- —
Market trends
- HPI YoY
- ▼ -123.97%
- Current HPI
- 232.1357
- Rent YoY
- —
- Metro
- —
- State GDP YoY
- ▲ 1.37%
- F500 in state
- 28
Industry mix (Fortune 500 HQ in MI)
| Industry | F500 HQs | Revenue |
|---|---|---|
| Automotive Parts | 3 | $48B |
|
||
| Automotive | 2 | $372B |
|
||
| Chemicals | 1 | $45B |
|
||
| Automotive Retail | 1 | $29B |
|
||
| Healthcare / Medical Devices | 1 | $23B |
|
||
| Automotive Technology | 1 | $20B |
|
||
Price history
1 event — show timeline
- 2026-04-10 Listed $56,900 Zillow
Cash-flow waterfall
monthlySold comps — $/sqft
last 12 mo · ≤1 miLoading sold comps…