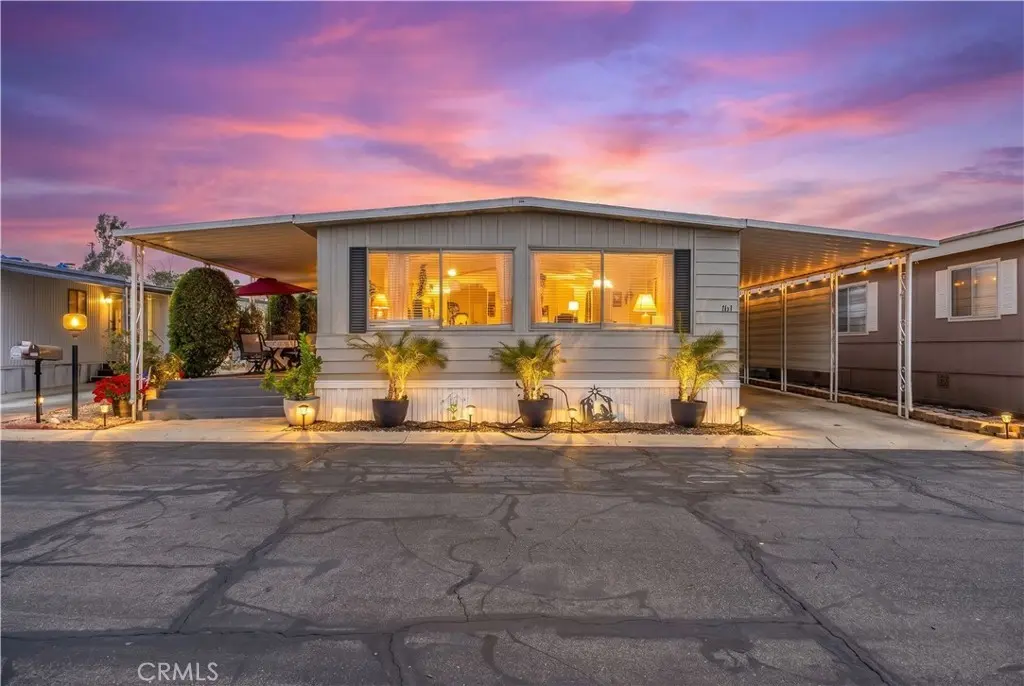
31816 Avenue Ave E #101 · Yucaipa, CA
Flood risk 1/10 · Minimal
- FEMA flood zone
- D
- Chance of flooding over 30 yrs
- 0.0%
- Est. flood insurance / yr
- $544 – $1,084
Fire risk 10/10 · Severe
- Est. fire insurance / yr
- $659 – $1,223
Heat risk 7/10 · Major
- Hot days now (above 100°F)
- 6 days/yr
- Hot days in 30 yrs
- 17 days/yr
Wind risk 1/10 · Minimal
- Chance of severe wind over 30 yrs
- —
Air-quality risk 10/10 · Severe
- Unhealthy air days now
- 30 days/yr
- Unhealthy air days in 30 yrs
- 37 days/yr
Risk factors via First Street. Map © Google.
Why this score? — see what drove the C grade
The composite is a weighted blend of 9 inputs, each scored 0–100. Each bar is that input's sub-score; the figure is the points it added to the 100-point composite (weight × sub-score).
- Cash flow +26.1/30.0
- DSCR +8.8/10.0
- 1% rule +7.0/10.0
- Schools +3.8/10.0
- Livability +3.3/5.0
- Condition / age +2.5/5.0
- Rent growth +2.2/5.0
- ARV discount +1.4/15.0
- Appreciation +0.0/10.0
$199,999
🖨 Deal sheet 📄 Offer letter ✓ Due diligence
Listing remarks MLS
~~REMODELED TO PERFECTION, IMMACULATE THROUGHOUT~~SHOWS LIKE A MODEL HOME~~ LARGE 3 BEDROOM NICELY LOCATED ALONG THE PERIMETER, LOCATED IN CRAFTON HILLS YUCAIPA'S HIGHLY REQUESTED FAMILY PARK, SPACE RENT ONLY $357~~ROOF RECOATED OCTOBER 2020~~RECENT REMODEL 2018-2019 INCLUDED. .. NEW HARDWOOD LAMINATE FLOORS AND NEW PLUSH CARPETING IN BEDROOMS WITH MEMORY FOAM PADDING~NEUTRALLY PAINTED INTERIOR~~NEW 6 PANEL DOORS AND NEW WATER HEATER!! ~HEATING & AIR NEW IN 2009~NEW ELECTRICAL SUB PANEL IN 2013~GREAT LAYOUT WITH HUGE BRIGHT LIVING ROOM AND FULL SIZE DINING ROOM WITH BUILT IN HUTCH~SPACIOUS GREAT ROOM/FAMILY ROOM OFF KITCHEN~REMODELED KITCHEN WITH NEWER CABINETS, COUNTERS AND APPLICANCES. .. FRIDGE INCLUDED~SEPARATE LAUNDRY ROOM . .. WASHER & DRYER INCLUDED~MASTER BEDROOM IS KING SIZE WITH MIRRORED CLOSET DOORS~MASTER BATH WITH NEW VANITY, TOILET AND NEWER TUB/SHOWER~BEDROOMS 2 & 3 ARE QUEEN/KING SIZE WITH MIRRORED CLOSET DOORS~BEAUTIFUL JACK & JILL BATHROOM WITH NEW MABLE VANITY WITH DUAL SINKS AND SOFT CLOSE DOORS AND DRAWERS PLUS NEWER TOILET AND TUB/SHOWER~~HUGE CONCRETE FRONT PORCH~PERFECT SIZE PRIVATE BACK YARD WITH BLOCK WALL AND NO NEIGHBORS BEHIND~ * * * CALL FOR A TOUR, FUSSIEST BUYERS WELCOME * * *
Key facts
- Laundry facilities
- Clubhouse
- Community amenities
Tags
Property features AI
Finance
- Financial info: Monthly land lease approximately $416 (seller-provided)
- HOA & community: Land lease in place (monthly); Rent includes all utilities; Community features include sidewalks and a park; Manager approval required for tenancy; Pets allowed
Exterior
- Parking: Attached carport; Public parking available; Park name: Crafton Hills Mobile Home Park
- Utilities: Public sewer; District/Public water
- Home design: Single-story mobile home; Mobile home remains on site; Mobile dimensions approximately 12 ft by 65 ft; Facing/directions available from I-10: exit Yucaipa Blvd north, right on Avenue E (located in Crafton Hills Mobile Estates)
- Construction: Year built per assessor; Living area per assessor's data
- Exterior features: Association-maintained pool; Front yard; Has a view
Interior
- Bathrooms: 2 full bathrooms
- Interior features: One-level home; Main entry on the first level
- Laundry & utility: Inside laundry
Neighborhood map
What this means for you Summary
Snapshot
- This is a 3-bed/2.0-bath manufactured listed at $200k.
Deal economics
- At list price, monthly cash flow is $507 ($6k/yr) — positive.
- The deal already cash-flows at list — no discount required.
- Meets the 1% rule at list price ($2k rent vs $200k).
- Recommended offer: $197k (1.5% below list) — sets the bar for market timing.
- Cap rate 9.3% vs local median 2.7% in Yucaipa — top-decile yield for the area; either an underpriced asset or a hidden risk that comps aren't pricing in. Stress-test before assuming the spread holds.
Location & tenants
- Location reads 66/100 on livability (#334 in CA) — a middle-class / working-renter tenant base. Strengths: housing A+, employment B+; Watch: schools D, health & safety D, amenities F.
- Yucaipa-Calimesa Joint Unified (suburban): math 32% / reading 55% proficiency, ranked #195 of 517 in CA (top 38%) — families likely to look elsewhere, expect single-tenant / working-renter base with shorter leases.
- Market conditions: Rents soft (-1.3%/yr); 205 active listings in the ZIP; 1 comparable units currently listed for rent nearby; solid renter incomes; 5,458 units permitted in San Bernardino County in 2024 (1,500 in 5+ unit buildings).
- This rent runs 31% of the median local income ($92k/yr) — at the standard rent-burdened threshold; future hikes will face affordability resistance.
Forward outlook
- Local home prices are declining (-3.0%/yr); year-one equity from $1k of loan paydown is wiped out by about $6k of value loss. Plan a longer hold.
- San Bernardino County population projected at +15% by 2050 — modest demand growth; plan on rents tracking national, not racing it.
Negotiation context
- It's been on market 16 days — a 2% lower offer ($197k) is reasonable based on typical stale-listing flexibility.
- 6 sale attempts since 23y ago with the ask held roughly flat each time — persistent listings suggest the price (not the market) is what's stuck; bring a comps-based counter.
- Current owner paid $117k; list at $200k implies a 71% gain — meaningful room to come down on a strong offer.
Risks & watch-outs
- Climate carrying-cost: severe wildfire risk; extreme-heat days projected 6→17/yr by 2055 (HVAC capex compounding) — expect insurance premiums to compound above CPI over the hold.
Questions for the listing agent
- Built in 1972 — when were the roof, HVAC, electrical panel, plumbing, and water heater last replaced?
- Is there a deadline driving the sale (1031 exchange, divorce, estate, relocation)? That informs how much negotiation room exists.
- Schools are D-rated, which usually means shorter tenancies and higher turnover. Who's the typical renter profile here, and what's been the actual vacancy rate?
- What's the average days-on-market for RENTAL listings here right now (not sales)? A rising rental-DOM trend means longer vacancies and softer asking-rent achievability than the comps imply.
- What's the recent tenant-quality profile in this submarket — average credit score on applications, eviction rate, late-payment / NSF rate, and stable-employment percentage? A property-management company in the area should have these aggregated.
- How much new for-sale + rental construction is in the pipeline within 1–3 miles? Heavy new supply typically softens prices + rents 12–24 months out; constrained supply supports both.
Investment metrics
- 1% rule
- 1.20% ✓
- Cap rate
- 9.33%
- Cash-on-cash
- 10.86%
- DSCR
- 1.48
- GRM
- 7.0
CMA / ARV
- ARV (on-the-fly)
- $176,280
- Comps found
- 3
Show comp detail 3 sales within ~0.75 mi
| Address | Dist | Beds/Ba | Sqft | Sold | Price | $/sf | Match |
|---|---|---|---|---|---|---|---|
| 31816 E Ave #144 | 0.00mi | 3/2.0 | 1,488 (-5%) | 1mo | $192,000 | $129 | 91 |
| 31816 Avenue E #33 | 0.07mi | 2/2.0 (-1) | 1,536 (-2%) | 7mo | $167,000 | $109 | 83 |
| 31816 Avenue Ave E #16 | 0.00mi | 2/2.0 (-1) | 1,664 (+7%) | 3mo | $188,000 | $113 | 81 |
Match score weights: distance 35% · size 25% · config 20% · recency 20%. Top-matched comps best support the ARV.
Projected returns pro-forma
-3.0% appreciation · 0.0% rent growth · sell at horizon
- IRR
- -3.5%
- Equity multiple
- 0.87×
- Total profit
- $-7,097
- Equity at exit
- $29,821
- IRR
- 2.4%
- Equity multiple
- 1.15×
- Total profit
- $8,455
- Equity at exit
- $17,292
Cash invested: $56,000 (down + closing). Projections, not guarantees.
Landlord ↔ Tenant lean methodology
- Overall (STATE)
- 18 Strongly Tenant-Friendly
- State California
- 18 Strongly Tenant-Friendly · D+13
- County
- — inherits STATE
- City
- — inherits STATE
ZIP-level market 92399
- Rents YoY
- -1.3%
- Active inventory
- 205
- Price-to-rent
- 7.0×
Monthly cashflow live
- Estimated rent
- $2,391 medium interval (Pro) →
- Mortgage (P&I)
- −$1,049
- Tax est. 1.5%
- −$250 /mo · $3,000/yr
- Insurance
- −$83
- HOA
- −$0
- Vacancy / Maint / Mgmt
- −$502
- Net cashflow
- $507
Break-even live
UW: 25.0% down · 7.5% · 30yr · 1.5% tax · 5.0% vac · 8.0% maint · 8.0% mgmt
Financing live
Cash to close
- Down payment
- $50,000
- Closing costs
- $6,000
- Reserves months
- —
- Total cash needed
- —
Loan-product check · same deal, 3 products live
Conventional
25% down · 7.5% · 30yr
- Down + closing
- —
- Monthly P&I
- —
- Monthly cashflow
- —
- DSCR
- —
- Eligible?
- —
Personal DTI + credit; lowest rate.
DSCR
20% down · 8.5% · 30yr
- Down + closing
- —
- Monthly P&I
- —
- Monthly cashflow
- —
- DSCR
- —
- Eligible?
- —
No personal income docs; deal must DSCR.
Hard money
10% down · 12.0% · 12mo
- Down + closing
- —
- Monthly P&I
- —
- Monthly cashflow
- —
- DSCR
- —
- Eligible?
- —
Short-term bridge; refi at stabilization.
Rent comps 1 comps
| Address | Beds | Baths | Sqft | Rent | $/sqft | DOM | Units | Dist |
|---|---|---|---|---|---|---|---|---|
| 12766 13th St Yucaipa, CA | 3.0 | 2.0 | 1400 | $2,795 | $2.00 | 3d | 1 | 1.12mi |
Listing history 12 events
-
2026-06-18days on market $199,999 Active 16 DOM
-
2026-06-17days on market $199,999 Active 15 DOM
-
2026-06-16days on market $199,999 Active 14 DOM
-
2026-06-15days on market $199,999 Active 13 DOM
-
2026-06-13days on market $199,999 Active 11 DOM
-
2026-06-13days on market $199,999 Active 10 DOM
-
2026-06-09days on market $199,999 Active 7 DOM
-
2026-06-08days on market $199,999 Active 6 DOM
-
2026-06-07days on market $199,999 Active 5 DOM
-
2026-06-04days on market $199,999 Active 2 DOM
-
2026-06-02remarks 693-char remark
-
2026-06-02$199,999 Active 1 DOM
ⓘ Source: listings_history table (triggers on properties + properties_extension) + one-shot
backfill from property_details.listing_events for pre-trigger history.
Climate risk First Street
- Flood 1/10 Low FEMA zone D · 0% chance over 30 yrs
- Wildfire 10/10 Extreme
- Heat 7/10 Severe 6 d/yr ≥100°F today · 17 d/yr by 30 yrs out
- Wind 1/10 Low
- Air quality 10/10 Extreme 30 unhealthy d/yr today · 37 by 30 yrs out
Nearby sold comps map
Loading sold comps map…
Walkable amenities ~0.75 mi
Loading nearby amenities…
Taxation est. · year 1
- Rental income
- $28,694
- − Mortgage interest
- −$11,203
- − Property taxes
- −$3,000
- − Insurance
- −$1,000
- − Repairs & maintenance
- −$2,296
- − Management
- −$2,296
- − Depreciation
- −$5,818
- Taxable income
- $3,082
- Est. tax owed @ 24.0%
- −$740
- After-tax cash flow
- $5,343/yr
For passive investors: Depreciation is non-cash, so a rental often shows a tax loss while cash-flowing — sheltering income. Rental losses are passive: they offset passive income freely, and up to $25,000/yr can offset ordinary (W-2) income if you actively participate and your MAGI is under $100k (phasing out to $0 by $150k); unused losses carry forward. On sale, claimed depreciation is recaptured at up to 25%, and gains may owe capital-gains tax (a 1031 exchange can defer both). Figures are a year-1 estimate at your 24.0% rate — not tax advice; consult a CPA.
Schools (NCES district)
- District
- Yucaipa-Calimesa Joint Unified
- NCES district ID
- 0643560
- Math proficiency
- 32% ▼ -4.00%
- Reading proficiency
- 55% ▲ 6.00%
- Median HH income
- $58,243
- Composite
- 38.09/100
- National rank
- #4277
- State rank
- #195 of 517 in CA
Livability — Yucaipa
- Score
- 66/100
- State rank
- #334
- US rank
- #11542
Category grades
Schools grade is shown separately in the Schools card above.
Census & demographics
- Census place
- Yucaipa, CA
- County
- San Bernardino County · 2,030,291 people
- City population
- 55,366
- Metro
- Riverside-San Bernardino-Ontario, CA
- Population (ZIP)
- 55,366
- Household income
- $92,440
- Rent vs Own
- Severe rent burden
- 1110.0
Population outlook (San Bernardino County) Hauer SSP2
- Today (2025)
- 2,300,329 people
- By 2030
- 2,378,907 · +3.4%
- By 2040
- 2,523,137 · +9.7%
- By 2050
- 2,642,388 · +14.9%
- By 2075
- 2,880,769 · +25.2%
- By 2100
- 2,909,436 · +26.5%
Race, ethnicity, and origin ACS 2023
- Neighborhood character
- Diverse neighborhood (Simpson 0.57)
- Race & ethnicity
- White 55% Hispanic / Latino 36% Two or more races 15% Asian 3% Black 2%
- Hispanic origin (detail)
- Mexican 31%
- Common ancestry
- Italian 4% Iranian 2% Lithuanian 2%
- Foreign-born
- 10% · Canada
- Languages at home
- 77% English-only · Spanish 19% Other Indo-European 1% Other Asian/Pacific 1%
Political lean MEDSL · San Bernardino
- 2024 margin
- Toss-up / Even · D 47.5% · R 49.7% · Other 2.8%
- 2008→2024 swing
- -8.5pp toward R · 2008: 6.3pp · 2024: -2.1pp
- All cycles
- 2024: R+2.1 2020: D+10.7 2016: D+9.8 2012: D+5.4 2008: D+6.3
Not yet ingested
- Civics
- —
Market trends
- HPI YoY
- ▼ -632.71%
- Current HPI
- 353.4762
- Rent YoY
- ▼ -1.27%
- Metro
- Riverside-San Bernardino-Ontario, CA
- State GDP YoY
- ▲ 3.21%
- F500 in state
- 116
Industry mix (Fortune 500 HQ in CA)
| Industry | F500 HQs | Revenue |
|---|---|---|
| Technology | 27 | $1,492B |
|
||
| Financial Services | 3 | $174B |
|
||
| Retail | 3 | $44B |
|
||
| Insurance | 3 | $26B |
|
||
| Media / Entertainment | 2 | $115B |
|
||
| Pharmaceuticals / Biotech | 2 | $62B |
|
||
Price history
+473.1% since first listed14 events — show timeline
- 2026-06-02 Listed $199,999 CRMLS
- 2025-12-09 Pending — CRMLS
- 2025-12-01 Listing Removed — CRMLS
- 2025-11-21 Listed $210,000 CRMLS
- 2020-12-02 Sold (MLS) $117,000 CRMLS
- 2020-11-07 Pending — CRMLS
- 2020-10-21 Listed $117,000 CRMLS
- 2008-07-18 Sold (MLS) $68,000 CRMLS
- 2008-07-14 Listing Removed — CRMLS
- 2008-05-02 Listed $68,900 CRMLS
- 2008-05-02 Listing Removed — CRMLS
- 2008-04-13 Listed $75,000 CRMLS
- 2003-12-30 Listing Removed — CRMLS
- 2003-09-16 Listed $34,900 CRMLS
Property tax history
-1.5%/yrLatest (2025): $100 · +1.2% YoY. Source: county tax records.
Cash-flow waterfall
monthlySold comps — $/sqft
last 12 mo · ≤1 miLoading sold comps…