6217 24th St · Lubbock, TX
Flood risk 1/10 · Minimal
- FEMA flood zone
- X (unshaded)
- Chance of flooding over 30 yrs
- 0.0%
- Est. flood insurance / yr
- $507 – $1,088
Fire risk 1/10 · Minimal
- Est. fire insurance / yr
- $1,222 – $2,270
Heat risk 5/10 · Moderate
- Hot days now (above 99°F)
- 7 days/yr
- Hot days in 30 yrs
- 21 days/yr
Wind risk 2/10 · Minimal
- Chance of severe wind over 30 yrs
- —
Air-quality risk 2/10 · Minimal
- Unhealthy air days now
- 1 days/yr
- Unhealthy air days in 30 yrs
- 1 days/yr
Risk factors via First Street. Map © Google.
Why this score? — see what drove the C grade
The composite is a weighted blend of 9 inputs, each scored 0–100. Each bar is that input's sub-score; the figure is the points it added to the 100-point composite (weight × sub-score).
- Cash flow +23.1/30.0
- ARV discount +7.5/15.0
- DSCR +7.4/10.0
- 1% rule +5.6/10.0
- Schools +4.4/10.0
- Livability +4.0/5.0
- Condition / age +2.8/5.0
- Rent growth +2.5/5.0
- Appreciation +0.0/10.0
$109,950
🖨 Deal sheet 📄 Offer letter ✓ Due diligence
Listing remarks
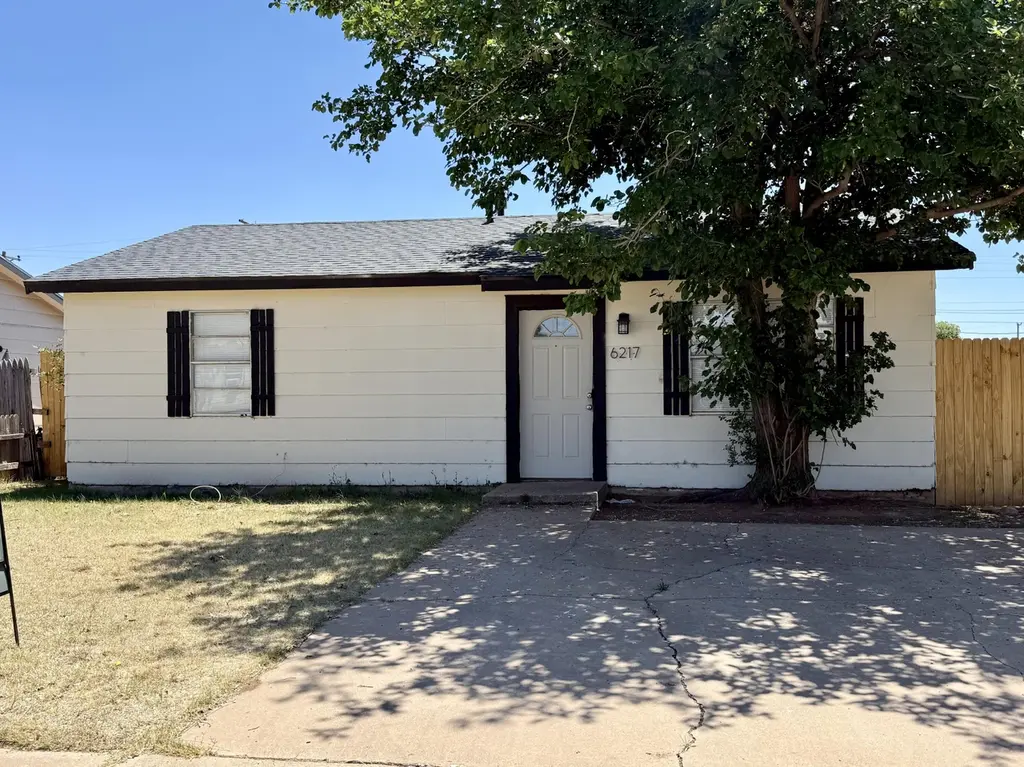
Imagine yourself in this two-bedroom, one-bath bungalow on the West side of Lubbock in the Frenship school district. This updated home with tile/vinyl flooring is ready for a new owner. It sits on a generous lot and has a fenced-in backyard and a large tree in the front, which shades the home. The bathroom is beautifully renovated, and the large kitchen/dining area provides a cozy spot to create meals and community. Spread out in the spacious living area, a great place to host friends on game days! This home will check off many of the boxes for you! The owner will actively seek out a renter and has another home like this for sale next door, 6219 24th St. (off market). Contact a local Lubb
Key facts
- 7,200 sq ft lot
- Built 1984
- Listed 37 days
Property features AI
Finance
- HOA & community: Curbs, sidewalks, street lights, and nearby park
Exterior
- Parking: Additional parking; Concrete driveway; Off-street parking; On-street parking; Parking pad
- Utilities: Public water; Public sewer; Electricity connected; Natural gas available; Cable available; Sewer connected
- Home design: Single family residence; Updated/remodeled; 1 story; Slab foundation
- Construction: Masonite exterior
- Exterior features: Private yard; Garden; Side porch; Fenced with wood fencing; Composition roof
Interior
- Kitchen: Range / Electric cooktop / Electric range / Free‑standing electric range; Refrigerator; Range hood; Electric water heater
- Bedrooms: Total rooms: 5
- Flooring: Tile; Vinyl
- Bathrooms: 1 full bathroom
- Heating & cooling: Ductless heating and cooling; Electric heating; Zoned heating; Ceiling fans; Wall/window air conditioning units
- Interior features: Ceiling fans; Eat-in kitchen; Smart thermostat; Walk-in closet(s); Blinds; Wood window frames
- Laundry & utility: Washer hookup inside (main level, in kitchen); Electric dryer hookup
Neighborhood map
What this means for you Summary
Snapshot
- This is a 2-bed/1.0-bath single-family listed at $110k. Condition is rated average.
Deal economics
- At list price, monthly cash flow is $197 ($2k/yr) — positive.
- The deal already cash-flows at list — no discount required.
- Meets the 1% rule at list price ($1k rent vs $110k).
- Recommended offer: $107k (3.0% below list) — sets the bar for market timing.
Location & tenants
- Location reads 80/100 on livability (#37 in TX, #1,749 nationally) — a professional / high-income tenant draw. Strengths: commute A+, cost of living A+, housing A+; Watch: employment C-, crime F.
- Frenship ISD (urban): math 47% / reading 54% proficiency, ranked #162 of 826 in TX (top 20%) — acceptable for families but not a draw, mixed tenant base, ~2y average lease.
- Zoned schools: Westwind El (math 34% / reading 37%, grade F, #1,946 of 4,322 statewide, top 45%, 601 students, 71% FRL); Heritage Middle (math 47% / reading 59%, grade C+, #281 of 1,662 statewide, top 18%, 766 students, 42% FRL) — zoned schools average 57% FRL vs 36% district-wide (20 pts higher); higher-poverty schools than district average — tighter screening recommended.
- Market conditions: Rents soft (-0.1%/yr); 610 active listings in the ZIP; 14 comparable units currently listed for rent nearby; rentals lingering (median 44d on market — plan ~5-8 weeks vacancy on turnover, expect pricing pressure); 86% of comp listings sitting > 30 days — soft ceiling on asking rent; 2,219 units permitted in Lubbock County in 2024 (252 in 5+ unit buildings).
Forward outlook
- Local home prices are declining (-3.0%/yr); year-one equity from $760 of loan paydown is wiped out by about $3k of value loss. Plan a longer hold.
- Lubbock County population projected at +39% by 2050 — long-run rental-demand tailwind backs the buy-and-hold thesis.
Negotiation context
- It's been on market 37 days — a 3% lower offer ($107k) is reasonable based on typical stale-listing flexibility.
Risks & watch-outs
- Climate carrying-cost: extreme-heat days projected 7→21/yr by 2055 (HVAC capex compounding) — expect insurance premiums to compound above CPI over the hold.
Questions for the listing agent
- It's been on market 37 days. Have you received any prior offers? Is the seller open to a 3% concession, seller financing, or rate buy-down credit?
- Is there a deadline driving the sale (1031 exchange, divorce, estate, relocation)? That informs how much negotiation room exists.
- Schools are D-rated, which usually means shorter tenancies and higher turnover. Who's the typical renter profile here, and what's been the actual vacancy rate?
- Crime grade is F in this area — have there been break-ins, vandalism, or insurance claims at this property in the last 3 years? What carrier currently insures it and at what premium?
- What's the average days-on-market for RENTAL listings here right now (not sales)? A rising rental-DOM trend means longer vacancies and softer asking-rent achievability than the comps imply.
- What's the recent tenant-quality profile in this submarket — average credit score on applications, eviction rate, late-payment / NSF rate, and stable-employment percentage? A property-management company in the area should have these aggregated.
- How much new for-sale + rental construction is in the pipeline within 1–3 miles? Heavy new supply typically softens prices + rents 12–24 months out; constrained supply supports both.
Investment metrics
- 1% rule
- 1.06% ✓
- Cap rate
- 8.45%
- Cash-on-cash
- 7.69%
- DSCR
- 1.34
- GRM
- 7.9
CMA / ARV
No comps found within radius.
Projected returns pro-forma
-3.0% appreciation · 0.0% rent growth · sell at horizon
- IRR
- -7.9%
- Equity multiple
- 0.72×
- Total profit
- $-8,662
- Equity at exit
- $16,394
- IRR
- -2.5%
- Equity multiple
- 0.85×
- Total profit
- $-4,537
- Equity at exit
- $9,506
Cash invested: $30,786 (down + closing). Projections, not guarantees.
Landlord ↔ Tenant lean methodology
- Overall (STATE)
- 87 Strongly Landlord-Friendly
- State Texas
- 87 Strongly Landlord-Friendly · R+5
- County
- — inherits STATE
- City
- — inherits STATE
ZIP-level market 79407
- Home prices YoY
- -16.3%
- Rents YoY
- -0.1%
- Active inventory
- 610
- Price-to-rent
- 7.9×
Monthly cashflow live
- Estimated rent
- $1,160 high interval (Pro) →
- Mortgage (P&I)
- −$577
- Tax from tax record
- −$97 /mo · $1,163/yr
- Insurance
- −$46
- HOA
- −$0
- Vacancy / Maint / Mgmt
- −$244
- Net cashflow
- $197
Break-even live
UW: 25.0% down · 7.5% · 30yr · 1.5% tax · 5.0% vac · 8.0% maint · 8.0% mgmt
Financing live
Cash to close
- Down payment
- $27,488
- Closing costs
- $3,298
- Reserves months
- —
- Total cash needed
- —
Loan-product check · same deal, 3 products live
Conventional
25% down · 7.5% · 30yr
- Down + closing
- —
- Monthly P&I
- —
- Monthly cashflow
- —
- DSCR
- —
- Eligible?
- —
Personal DTI + credit; lowest rate.
DSCR
20% down · 8.5% · 30yr
- Down + closing
- —
- Monthly P&I
- —
- Monthly cashflow
- —
- DSCR
- —
- Eligible?
- —
No personal income docs; deal must DSCR.
Hard money
10% down · 12.0% · 12mo
- Down + closing
- —
- Monthly P&I
- —
- Monthly cashflow
- —
- DSCR
- —
- Eligible?
- —
Short-term bridge; refi at stabilization.
Rent comps 14 comps
| Address | Beds | Baths | Sqft | Rent | $/sqft | DOM | Units | Dist |
|---|---|---|---|---|---|---|---|---|
| 6223 24th St Unit Labs Lubbock, TX | 2.0 | 1.0 | 884 | $1,150 | $1.30 | 43d | 1 | 0.04mi |
| 2104 La Salle Ave Lubbock, TX | 1.0–2.0 | 1.0–2.0 | 741 | $1,250 | $1.69 | 43d | 1 | 0.31mi |
| 2001 Milwaukee Ave Lubbock, TX | 1.0 | 1.0 | 698 | $975 | $1.40 | 43d | 1 | 0.35mi |
| 2102 W Loop 289 Lubbock, TX | 1.0–2.0 | 1.0–1.5 | 702 | $890 | $1.27 | 43d | 1 | 0.36mi |
| 6333 29th St Lubbock, TX | 3.0 | 2.0 | 1051 | $1,350 | $1.28 | 13d | 1 | 0.36mi |
| 6509 21st St Unit B Lubbock, TX | 2.0 | 1.5 | 1044 | $925 | $0.89 | 43d | 1 | 0.43mi |
| 6801 19th St Unit 179 Lubbock, TX | 3.0 | 2.0 | 1008 | $1,100 | $1.09 | 43d | 1 | 0.64mi |
| 2702 Frankford Ave Lubbock, TX | 2.0 | 1.0 | 940 | $888 | $0.94 | 43d | 1 | 0.67mi |
| 3201 W Loop 289 Lubbock, TX | 1.0–2.0 | 1.0–2.0 | 771 | $1,095 | $1.42 | 43d | 1 | 0.78mi |
| 6108 37th St Unit B Lubbock, TX | 2.0 | 1.5 | 894 | $799 | $0.89 | 43d | 1 | 0.81mi |
| 6104 37th St Unit A Lubbock, TX | 2.0 | 1.5 | 950 | $780 | $0.82 | 43d | 1 | 0.81mi |
| 5818 8th St Lubbock, TX | 2.0 | 2.0 | 1000 | $995 | $0.99 | 43d | 1 | 1.30mi |
| 5863 6th St Lubbock, TX | 3.0 | 2.0 | 1116 | $1,325 | $1.19 | 21d | 1 | 1.36mi |
| 7324 26th St Lubbock, TX | 2.0 | 1.0 | 936 | $850 | $0.91 | 43d | 1 | 1.43mi |
Listing history 18 events
-
2026-06-18days on market $109,950 Active 37 DOM
-
2026-06-17days on market $109,950 Active 36 DOM
-
2026-06-16days on market $109,950 Active 35 DOM
-
2026-06-15days on market $109,950 Active 34 DOM
-
2026-06-13days on market $109,950 Active 31 DOM
-
2026-06-10days on market $109,950 Active 29 DOM
-
2026-06-09days on market $109,950 Active 28 DOM
-
2026-06-08days on market $109,950 Active 27 DOM
-
2026-06-07days on market $109,950 Active 26 DOM
-
2026-06-05days on market $109,950 Active 23 DOM
-
2026-06-03days on market $109,950 Active 22 DOM
-
2026-06-02days on market $109,950 Active 21 DOM
-
2026-06-01days on market $109,950 Active 20 DOM
-
2026-05-31days on market $109,950 Active 19 DOM
-
2026-05-30days on market $109,950 Active 18 DOM
-
2026-05-22price $109,950
-
2026-05-11$114,950 Active
-
2026-01-13soldstatus $466,745
ⓘ Source: listings_history table (triggers on properties + properties_extension) + one-shot
backfill from property_details.listing_events for pre-trigger history.
Tax reassessment forecast TX · Resets to sale price
- Current annual tax
- $1,163 · $97/mo
- Projected year-2 tax
- $2,012 · $168/mo
- Expected delta
- +$850/yr (+$71/mo · 73.1%)
ⓘ Screening estimate from a state-policy table — verify with the county assessor before closing.
Climate risk First Street
- Flood 1/10 Low FEMA zone X (unshaded) · 0% chance over 30 yrs
- Wildfire 1/10 Low
- Heat 5/10 Major 7 d/yr ≥99°F today · 21 d/yr by 30 yrs out
- Wind 2/10 Low
- Air quality 2/10 Low 1 unhealthy d/yr today · 1 by 30 yrs out
Nearby sold comps map
Loading sold comps map…
Walkable amenities ~0.75 mi
Loading nearby amenities…
Taxation est. · year 1
- Rental income
- $13,922
- − Mortgage interest
- −$6,159
- − Property taxes
- −$1,163
- − Insurance
- −$550
- − Repairs & maintenance
- −$1,114
- − Management
- −$1,114
- − Depreciation
- −$3,199
- Taxable income
- $624
- Est. tax owed @ 24.0%
- −$150
- After-tax cash flow
- $2,217/yr
For passive investors: Depreciation is non-cash, so a rental often shows a tax loss while cash-flowing — sheltering income. Rental losses are passive: they offset passive income freely, and up to $25,000/yr can offset ordinary (W-2) income if you actively participate and your MAGI is under $100k (phasing out to $0 by $150k); unused losses carry forward. On sale, claimed depreciation is recaptured at up to 25%, and gains may owe capital-gains tax (a 1031 exchange can defer both). Figures are a year-1 estimate at your 24.0% rate — not tax advice; consult a CPA.
Condition & rehab AI · 12 photos
This updated bungalow is in average condition with some cosmetic improvements needed. It offers a good starting point for a potential buyer or renter.
Repairs flagged
- Minor Paint touch-ups — Minor scuff marks on walls
- Minor Landscaping — Overgrown grass in yard
Value-add opportunities
- Both Painting and touch-ups — Enhances curb appeal and interior aesthetics
- Both Landscaping — Improves curb appeal and enhances property value
- Rental HVAC maintenance — Ensures comfort and energy efficiency
Renovation cost estimate screening
| Repair item | Severity | Est. cost |
|---|---|---|
| Paint touch-ups · Minor scuff marks on walls | Minor | $500–3,000 |
| Landscaping · Overgrown grass in yard | Minor | $500–3,000 |
| Total estimated repair cost · 2 items | $1,000–6,000 |
Value-add ROI direction
- Both Painting and touch-ups — Enhances curb appeal and interior aesthetics ↑
- Both Landscaping — Improves curb appeal and enhances property value ↑
- Rental HVAC maintenance — Ensures comfort and energy efficiency ↑
ⓘ Cost ranges are severity-bucket heuristics (US national rule-of-thumb). Get contractor quotes + a written scope before underwriting a rehab budget.
Schools (NCES district)
- District
- Frenship ISD
- NCES district ID
- 4819830
- Math proficiency
- 47% ▼ -8.00%
- Reading proficiency
- 54% ▬ 0.00%
- Median HH income
- $54,376
- Composite
- 43.59/100
- National rank
- #2976
- State rank
- #162 of 826 in TX
Livability — Lubbock
- Score
- 80/100
- State rank
- #37
- US rank
- #1749
Category grades
Schools grade is shown separately in the Schools card above.
Census & demographics
- Census place
- Lubbock, TX
- County
- Lubbock County · 293,542 people
- City population
- 283,030
- Metro
- Lubbock, TX
- Population (ZIP)
- 24,000
- Household income
- $61,509
- Rent vs Own
- Severe rent burden
- 1914.0
Population outlook (Lubbock County) Hauer SSP2
- Today (2025)
- 345,960 people
- By 2030
- 371,449 · +7.4%
- By 2040
- 424,539 · +22.7%
- By 2050
- 481,150 · +39.1%
- By 2075
- 633,467 · +83.1%
- By 2100
- 746,853 · +115.9%
Race, ethnicity, and origin ACS 2023
- Neighborhood character
- Diverse neighborhood (Simpson 0.56)
- Race & ethnicity
- White 58% Hispanic / Latino 31% Two or more races 17% Black 4% Asian 3%
- Hispanic origin (detail)
- Mexican 27%
- Common ancestry
- Italian 2% Lithuanian 1% Slovak 1%
- Foreign-born
- 5% · Canada, South Korea, China
- Languages at home
- 83% English-only · Spanish 13% Other Asian/Pacific 1% Chinese 1%
Political lean MEDSL · Lubbock
- 2024 margin
- Solid R (+39.5) · D 29.7% · R 69.2% · Other 1.0%
- 2008→2024 swing
- -2.8pp toward R · 2008: -36.7pp · 2024: -39.5pp
- All cycles
- 2024: R+39.5 2020: R+32.2 2016: R+38.4 2012: R+40.9 2008: R+36.7
Not yet ingested
- Civics
- —
Market trends
- HPI YoY
- ▼ -44.87%
- Current HPI
- 229.9895
- Rent YoY
- ▼ -0.07%
- Metro
- Lubbock, TX
- State GDP YoY
- ▲ 3.95%
- F500 in state
- 110
Industry mix (Fortune 500 HQ in TX)
| Industry | F500 HQs | Revenue |
|---|---|---|
| Energy | 16 | $1,198B |
|
||
| Technology | 5 | $198B |
|
||
| Engineering / Construction | 4 | $72B |
|
||
| Energy Services | 3 | $60B |
|
||
| Utilities | 3 | $41B |
|
||
| Healthcare | 2 | $330B |
|
||
Price history
-76.4% since first listed3 events — show timeline
- 2026-05-22 Price Changed $109,950 LARMLS
- 2026-05-11 Listed $114,950 LARMLS
- 2026-01-13 Sold (Public Records) $466,745 Public Records
Property tax history
+1.9%/yrLatest (2025): $1,163 · +8.7% YoY. Source: county tax records.
Cash-flow waterfall
monthlySold comps — $/sqft
last 12 mo · ≤1 miLoading sold comps…