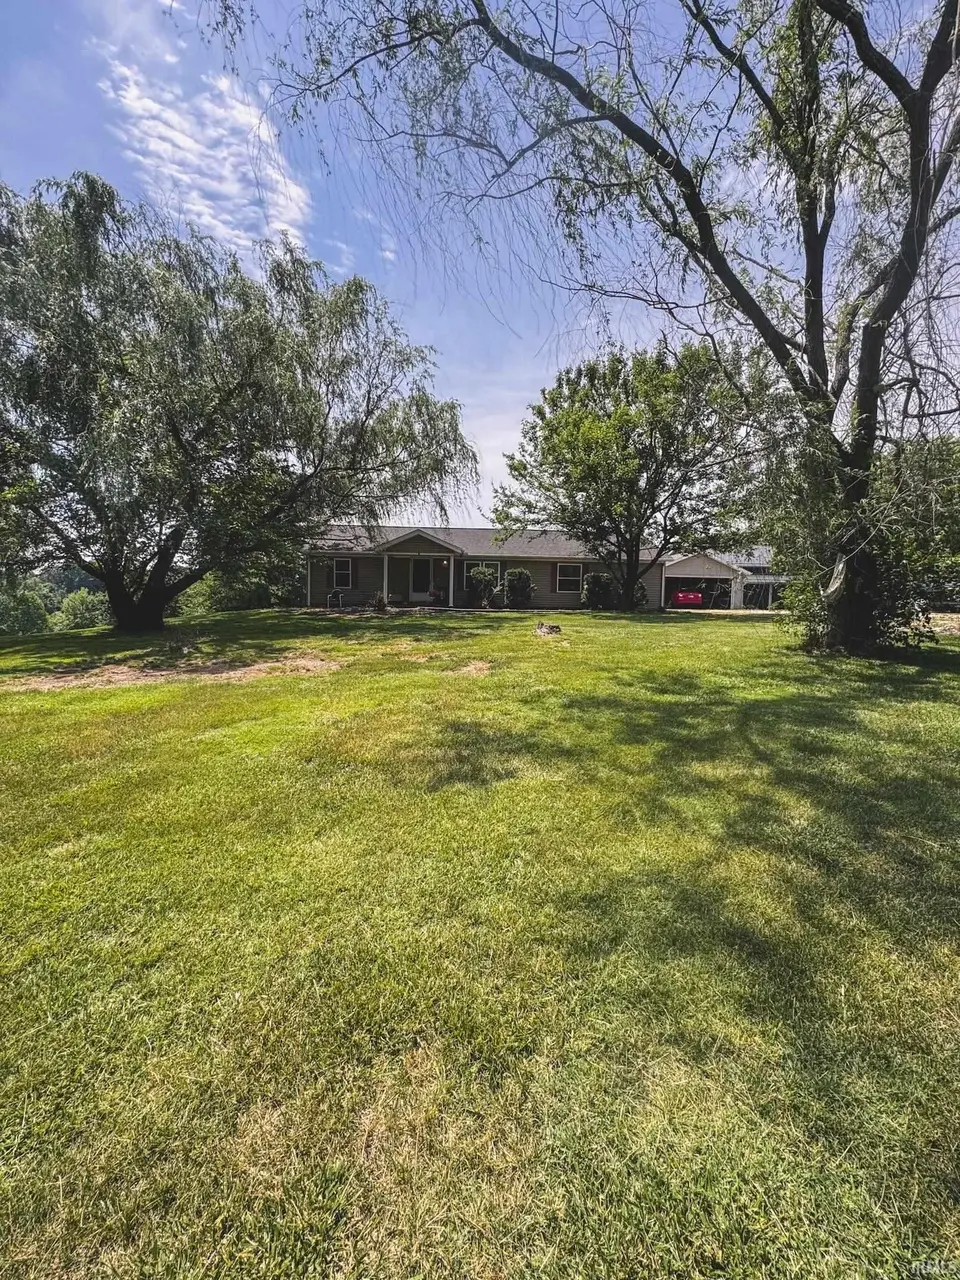
4415 S Pine Ridge Rd · Schnellville, IN
Flood risk 1/10 · Minimal
- FEMA flood zone
- X (unshaded)
- Chance of flooding over 30 yrs
- 0.0%
- Est. flood insurance / yr
- $507 – $1,088
Fire risk 1/10 · Minimal
- Est. fire insurance / yr
- $717 – $1,331
Heat risk 5/10 · Moderate
- Hot days now (above 104°F)
- 7 days/yr
- Hot days in 30 yrs
- 19 days/yr
Wind risk 2/10 · Minimal
- Chance of severe wind over 30 yrs
- 2.0%
Air-quality risk 2/10 · Minimal
- Unhealthy air days now
- 1 days/yr
- Unhealthy air days in 30 yrs
- 3 days/yr
Risk factors via First Street. Map © Google.
Why this score? — see what drove the D+ grade
The composite is a weighted blend of 9 inputs, each scored 0–100. Each bar is that input's sub-score; the figure is the points it added to the 100-point composite (weight × sub-score).
- Cash flow +12.5/30.0
- Appreciation +9.4/10.0
- ARV discount +7.5/15.0
- Schools +5.7/10.0
- DSCR +3.7/10.0
- Rent growth +2.5/5.0
- Livability +2.5/5.0
- Condition / age +2.5/5.0
- 1% rule +2.4/10.0
$189,900
🖨 Deal sheet (PDF) 📄 Offer letter ✓ Due diligence
Listing remarks
Room to roam! Welcome to this beautiful one-owner home situated on 2 scenic acres less than half a mile from Pine Ridge Elementary School. This rare property features a 1,539 sq. ft manufactured home built in 2000 with a detached 2-car garage. Inside, you'll find spacious living and dining areas, a large primary suite with a roomy private bath, and 3 additional nicely sized bedrooms offering plenty of space for family, guests, or a home office. Enjoy peaceful country living with beautiful scenic views in every direction. Major updates include a brand-new roof in 2026 plus an HVAC system that is less than 2 years old for added peace of mind. If you've been looking for space and country char
Key facts
- Brand new roof
- 2 acre lot
- 2 garage spots
Tags
Property features AI
Finance
- Financial info: Annual tax amount listed (financial details provided)
Exterior
- Parking: Detached garage; Gravel and off-street parking; 2 garage spaces
- Utilities: Public water; Septic sewer
- Home design: Single-story manufactured home; Residential property
- Construction: Vinyl siding
- Exterior features: Asphalt roof; Shed(s) on property; Rolling slope lot
Interior
- Kitchen: Dishwasher; Refrigerator; Electric oven and range
- Bedrooms: Total of 7 rooms (bedroom counts not separately specified)
- Flooring: Carpet; Vinyl
- Bathrooms: 2 full bathrooms, both on the main level
- Heating & cooling: Forced air heating (electric); Central air conditioning
- Interior features: Dishwasher; Refrigerator; Electric oven; Electric range; Electric water heater; Water heater; One fireplace; Basement (other type)
- Laundry & utility: Main-level laundry with electric dryer hookup
Neighborhood map
What this means for you Summary
Snapshot
- This is a 4-bed/2.0-bath single-family listed at $190k.
Deal economics
- At list price, monthly cash flow is $-29 ($-345/yr) — negative.
- To cash-flow at today's rent, offer at most $185k (2.7% below list).
- To meet the 1% rule (rent ≥ 1% of price), the offer needs to be $140k (26.2% below list).
- Recommended offer: $140k (26.2% below list) — sets the bar for 1% rule.
Location & tenants
- Location reads: area grade D — affects rentability + tenant quality, not the cash-flow math above.
- Southeast Dubois County School Corporation (rural): math 67% / reading 67% proficiency, ranked #5 of 301 in IN (top 2%) — acceptable for families but not a draw, mixed tenant base, ~2y average lease; only 14% free/reduced lunch — higher-income household profile.
- Zoned schools: Pine Ridge Elementary School (math 82% / reading 57%, grade A-, #40 of 994 statewide, top 5%, 236 students, 37% FRL); Forest Park Jr-Sr High School (math 56% / reading 72%, grade B-, #38 of 369 statewide, top 10%, 533 students, 23% FRL) — zoned schools average 30% FRL vs 14% district-wide (16 pts higher); higher-poverty schools than district average — tighter screening recommended.
- Market conditions: 9 active listings in the ZIP; 197 units permitted in Dubois County in 2024 (20 in 5+ unit buildings).
Forward outlook
- In year one you build about $18k of equity ($1k loan paydown + $17k appreciation (8.8% local appreciation)).
- Dubois County population projected to shrink 5% by 2050 — rents likely to lag national; underwrite the cash flow, not the appreciation.
- At projected returns (8.8% appreciation + 3.0% rent growth), your $53k cash investment doubles in ~3 years — after that, you're playing with house money.
- By year 3, paydown + projected appreciation supports a ~$45k cash-out refi (75% LTV) — recoverable capital for the next deal without selling this one.
Negotiation context
- It's been on market 16 days — a 2% lower offer ($187k) is reasonable based on typical stale-listing flexibility.
Risks & watch-outs
- Climate carrying-cost: extreme-heat days projected 7→19/yr by 2055 (HVAC capex compounding) — expect insurance premiums to compound above CPI over the hold.
Questions for the listing agent
- What do current leases actually rent for vs. the listed asking? Can we see a recent rent roll and the last 12 months of T-12 income?
- Is there a deadline driving the sale (1031 exchange, divorce, estate, relocation)? That informs how much negotiation room exists.
- The area grade is low — what's the realistic commute time and amenity access for the typical tenant pool here? Any planned neighborhood developments (good or bad) we should know about?
- What's the average days-on-market for RENTAL listings here right now (not sales)? A rising rental-DOM trend means longer vacancies and softer asking-rent achievability than the comps imply.
- What's the recent tenant-quality profile in this submarket — average credit score on applications, eviction rate, late-payment / NSF rate, and stable-employment percentage? A property-management company in the area should have these aggregated.
- How much new for-sale + rental construction is in the pipeline within 1–3 miles? Heavy new supply typically softens prices + rents 12–24 months out; constrained supply supports both.
Investment metrics
- 1% rule
- 0.74% ✗
- Cap rate
- 6.11%
- Cash-on-cash
- -0.65%
- DSCR
- 0.97
- GRM
- 11.3
CMA / ARV
No comps found within radius.
Projected returns pro-forma
8.76% appreciation · 3.0% rent growth · sell at horizon
- IRR
- 21.2%
- Equity multiple
- 2.61×
- Total profit
- $85,674
- Equity at exit
- $154,233
- IRR
- 19.3%
- Equity multiple
- 5.71×
- Total profit
- $250,592
- Equity at exit
- $316,172
Cash invested: $53,172 (down + closing). Projections, not guarantees.
Landlord ↔ Tenant lean methodology
- Overall (STATE)
- 90 Strongly Landlord-Friendly
- State Indiana
- 90 Strongly Landlord-Friendly · R+11
- County
- — inherits STATE
- City
- — inherits STATE
ZIP-level market 47513
- Home prices YoY
- 4.1%
- Active inventory
- 9
- Price-to-rent
- 11.3×
Monthly cashflow live
- Estimated rent
- $1,401 medium interval (Pro) →
- Mortgage (P&I)
- −$996
- Tax from tax record
- −$61 /mo · $727/yr
- Insurance
- −$79
- HOA
- −$0
- Vacancy / Maint / Mgmt
- −$294
- Net cashflow
- $-29
Break-even live
Sensitivity live
| Price | -10% $79 | -5% $25 | +0% $-29 | +5% $-82 | +10% $-136 |
|---|---|---|---|---|---|
| Rent | -10% $-139 | -5% $-84 | +0% $-29 | +5% $27 | +10% $82 |
| Rate | -1.0pp $67 | -0.5pp $20 | base $-29 | +0.5pp $-78 | +1.0pp $-128 |
UW: 25.0% down · 7.5% · 30yr · 1.5% tax · 5.0% vac · 8.0% maint · 8.0% mgmt
Financing live
Cash to close
- Down payment
- $47,475
- Closing costs
- $5,697
- Reserves months
- —
- Total cash needed
- —
Loan-product check · same deal, 3 products live
Conventional
25% down · 7.5% · 30yr
- Down + closing
- —
- Monthly P&I
- —
- Monthly cashflow
- —
- DSCR
- —
- Eligible?
- —
Personal DTI + credit; lowest rate.
DSCR
20% down · 8.5% · 30yr
- Down + closing
- —
- Monthly P&I
- —
- Monthly cashflow
- —
- DSCR
- —
- Eligible?
- —
No personal income docs; deal must DSCR.
Hard money
10% down · 12.0% · 12mo
- Down + closing
- —
- Monthly P&I
- —
- Monthly cashflow
- —
- DSCR
- —
- Eligible?
- —
Short-term bridge; refi at stabilization.
Listing history 7 events
-
2026-06-07statusdays on market $189,900 Pending 16 DOM
-
2026-06-04days on market $189,900 Active 15 DOM
-
2026-06-02days on market $189,900 Active 14 DOM
-
2026-06-01days on market $189,900 Active 13 DOM
-
2026-05-31days on market $189,900 Active 12 DOM
-
2026-05-31days on market $189,900 Active 11 DOM
-
2026-05-19$189,900 Active
ⓘ Source: listings_history table (triggers on properties + properties_extension) + one-shot
backfill from property_details.listing_events for pre-trigger history.
Tax reassessment forecast IN · Partial reset (capped growth)
- Current annual tax
- $727 · $61/mo
- Projected year-2 tax
- $1,170 · $98/mo
- Expected delta
- +$444/yr (+$37/mo · 61.0%)
ⓘ Screening estimate from a state-policy table — verify with the county assessor before closing.
Climate risk First Street
- Flood 1/10 Low FEMA zone X (unshaded) · 0% chance over 30 yrs
- Wildfire 1/10 Low
- Heat 5/10 Major 7 d/yr ≥104°F today · 19 d/yr by 30 yrs out
- Wind 2/10 Low 2% chance of damaging wind over 30 yrs
- Air quality 2/10 Low 1 unhealthy d/yr today · 3 by 30 yrs out
Nearby sold comps map
Loading sold comps map…
Walkable amenities ~0.75 mi
Loading nearby amenities…
Taxation est. · year 1
- Rental income
- $16,813
- − Mortgage interest
- −$10,637
- − Property taxes
- −$727
- − Insurance
- −$950
- − Repairs & maintenance
- −$1,345
- − Management
- −$1,345
- − Depreciation
- −$5,524
- Taxable loss
- −$3,715
- Est. tax savings @ 24.0%
- +$892
- After-tax cash flow
- $547/yr
For passive investors: Depreciation is non-cash, so a rental often shows a tax loss while cash-flowing — sheltering income. Rental losses are passive: they offset passive income freely, and up to $25,000/yr can offset ordinary (W-2) income if you actively participate and your MAGI is under $100k (phasing out to $0 by $150k); unused losses carry forward. On sale, claimed depreciation is recaptured at up to 25%, and gains may owe capital-gains tax (a 1031 exchange can defer both). Figures are a year-1 estimate at your 24.0% rate — not tax advice; consult a CPA.
Schools (NCES district)
- District
- Southeast Dubois County School Corporation
- NCES district ID
- 1810640
- Math proficiency
- 67% ▼ -5.00%
- Reading proficiency
- 67% ▲ 2.00%
- Median HH income
- $55,646
- Composite
- 57.43/100
- National rank
- #1075
- State rank
- #5 of 301 in IN
Livability — Schnellville
No livability data for this city. (Only ~50 U.S. cities are tracked.)
Census & demographics
- Population (ZIP)
- 1,797
Population outlook (Dubois County) Hauer SSP2
- Today (2025)
- 43,036 people
- By 2030
- 43,079 · +0.1%
- By 2040
- 42,531 · -1.2%
- By 2050
- 40,762 · -5.3%
- By 2075
- 36,227 · -15.8%
- By 2100
- 28,083 · -34.7%
Race, ethnicity, and origin ACS 2023
- Neighborhood character
- Predominantly White (92%)
- Race & ethnicity
- White 92% Hispanic / Latino 6% Two or more races 2%
- Hispanic origin (detail)
- Mexican 6%
- Common ancestry
- Italian 4% Lithuanian 4% Slovak 4%
- Foreign-born
- 0%
- Languages at home
- 97% English-only · Spanish 3%
Political lean MEDSL · Dubois
- 2024 margin
- Solid R (+42.2) · D 27.8% · R 70.0% · Other 2.2%
- 2008→2024 swing
- -38.0pp toward R · 2008: -4.2pp · 2024: -42.2pp
- All cycles
- 2024: R+42.2 2020: R+40.1 2016: R+40.0 2012: R+27.7 2008: R+4.2
Not yet ingested
- Civics
- —
Market trends
- HPI YoY
- ▲ 8.76%
- Current HPI
- 220.9989
- Rent YoY
- —
- Metro
- —
- State GDP YoY
- ▲ 2.90%
- F500 in state
- 18
Industry mix (Fortune 500 HQ in IN)
| Industry | F500 HQs | Revenue |
|---|---|---|
| Industrial Machinery | 2 | $37B |
|
||
| Healthcare | 1 | $177B |
|
||
| Pharmaceuticals | 1 | $45B |
|
||
| Metals / Steel | 1 | $18B |
|
||
| Agriculture | 1 | $17B |
|
||
| Packaging | 1 | $12B |
|
||
Price history
1 event — show timeline
- 2026-05-19 Listed $189,900 IRMLS
Property tax history
+5.5%/yrLatest (2024): $727 · +17.0% YoY. Source: county tax records.
Cash-flow waterfall
monthlySold comps — $/sqft
last 12 mo · ≤1 miLoading sold comps…