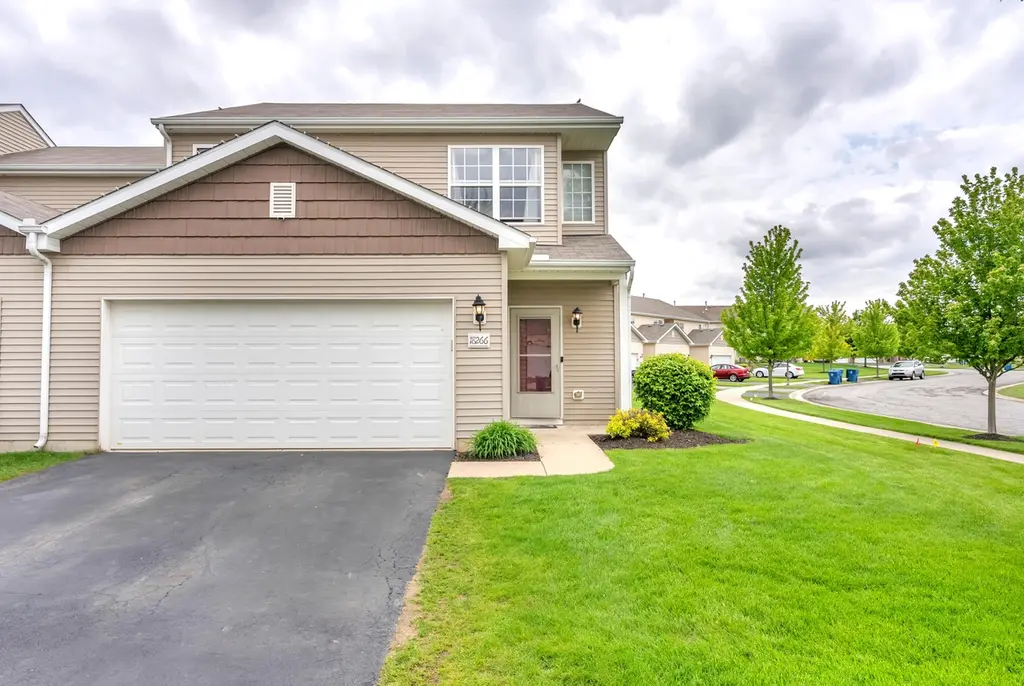
18266 Platinum Dr · Lowell, IN
Flood risk 1/10 · Minimal
- FEMA flood zone
- X (unshaded)
- Chance of flooding over 30 yrs
- 0.0%
- Est. flood insurance / yr
- $507 – $1,088
Fire risk 1/10 · Minimal
- Est. fire insurance / yr
- $717 – $1,331
Heat risk 3/10 · Minor
- Hot days now (above 101°F)
- 7 days/yr
- Hot days in 30 yrs
- 16 days/yr
Wind risk 2/10 · Minimal
- Chance of severe wind over 30 yrs
- 0.0%
Air-quality risk 2/10 · Minimal
- Unhealthy air days now
- 1 days/yr
- Unhealthy air days in 30 yrs
- 2 days/yr
Risk factors via First Street. Map © Google.
Why this score? — see what drove the C+ grade
The composite is a weighted blend of 9 inputs, each scored 0–100. Each bar is that input's sub-score; the figure is the points it added to the 100-point composite (weight × sub-score).
- Cash flow +25.0/30.0
- DSCR +8.1/10.0
- ARV discount +7.3/15.0
- 1% rule +6.4/10.0
- Schools +4.5/10.0
- Livability +3.8/5.0
- Rent growth +2.5/5.0
- Condition / age +2.5/5.0
- Appreciation +0.0/10.0
$245,000
🖨 Deal sheet (PDF) 📄 Offer letter ✓ Due diligence
Listing remarks MLS
100% USDA FINANCING AVAILABLE!! Providence Townes of Lowell presents the Bayport! Maintenance free townhome living. Conveniently located just minutes from I-65, shopping, dining and Downtown Lowell. Main level features spacious kitchen and an abundance of cabinets. Upper level include an over-sized master bedroom with walk-in closet, and second floor laundry for convenience. Exterior features include attached garage, and professional landscaping package. You will have piece of mind knowing you are purchasing a quality constructed home by Providence Real Estate Development!! * * UNDER CONSTRUCTION * * ESTIMATED JULY COMPLETION.
Key facts
- Largest yards
- Peninsula kitchen
- Owners suite
Tags
Property features AI
Finance
- HOA & community: Homeowners association managed by 1st American Managemen; Monthly HOA fee of $115; HOA covers grounds maintenance, snow removal and structure maintenance; Community landscaping and management services
Exterior
- Parking: Attached garage with garage door opener; Garage faces front; 2 garage spaces
- Utilities: Natural gas connected; Public water; Public sewer; 200+ amp electric service
- Home design: Two-story attached home; Built in 2014
- Construction: Property attached
- Exterior features: Neighborhood view
Interior
- Kitchen: Range; Microwave; Dishwasher
- Bedrooms: Primary bedroom; Bedroom 2; Bedroom 3
- Flooring: Carpet; Vinyl
- Bathrooms: 2 full bathrooms; 1 half bathroom
- Heating & cooling: Forced air heating (natural gas); Central air conditioning
- Interior features: Open floorplan; Walk-in closets
- Laundry & utility: Washer; Dryer
Neighborhood map
What this means for you Summary
Snapshot
- This is a 3-bed/1.5-bath single-family listed at $245k.
Deal economics
- At list price, monthly cash flow is $531 ($6k/yr) — positive.
- The deal already cash-flows at list — no discount required.
- Meets the 1% rule at list price ($3k rent vs $245k).
- Recommended offer: $238k (3.0% below list) — sets the bar for market timing.
- Cap rate 8.9% vs local median 3.8% in Lowell — top-decile yield for the area; either an underpriced asset or a hidden risk that comps aren't pricing in. Stress-test before assuming the spread holds.
Location & tenants
- Location reads 76/100 on livability (#51 in IN, #3,455 nationally) — a middle-class / working-renter tenant base. Strengths: crime A+, cost of living A+, housing A+; Watch: health & safety C-, amenities F, commute F.
- Tri-Creek School Corporation (town): math 46% / reading 56% proficiency, ranked #39 of 301 in IN (top 13%) — acceptable for families but not a draw, mixed tenant base, ~2y average lease.
- Zoned schools: Three Creeks Elem School (math 55% / reading 48%, grade C-, #256 of 994 statewide, top 26%, 515 students, 30% FRL); Lowell Middle School (math 36% / reading 54%, grade D, #81 of 330 statewide, top 25%, 742 students, 33% FRL); Lowell Senior High School (math 31% / reading 75%, grade C-, #99 of 369 statewide, top 27%, 1,033 students, 29% FRL).
- Market conditions: 351 active listings in the ZIP; 1 comparable units currently listed for rent nearby; 1,642 units permitted in Lake County in 2024 (14 in 5+ unit buildings).
Forward outlook
- Local home prices are declining (-3.0%/yr); year-one equity from $2k of loan paydown is wiped out by about $7k of value loss. Plan a longer hold.
- Lake County population projected to shrink 7% by 2050 — rents likely to lag national; underwrite the cash flow, not the appreciation.
Negotiation context
- It's been on market 43 days — a 3% lower offer ($238k) is reasonable based on typical stale-listing flexibility.
- 2 sale attempts since 14y ago; this cycle's ask has dropped $15k (6%) from the opening price — seller is motivated, your offer sets the floor, not the list.
- Current owner paid $126k; list at $245k implies a 94% gain — meaningful room to come down on a strong offer.
Questions for the listing agent
- It's been on market 43 days. Have you received any prior offers? Is the seller open to a 3% concession, seller financing, or rate buy-down credit?
- What does the HOA fee cover, when was the last increase, and are there any pending special assessments or reserve-fund shortfalls?
- Is there a deadline driving the sale (1031 exchange, divorce, estate, relocation)? That informs how much negotiation room exists.
- What's the average days-on-market for RENTAL listings here right now (not sales)? A rising rental-DOM trend means longer vacancies and softer asking-rent achievability than the comps imply.
- What's the recent tenant-quality profile in this submarket — average credit score on applications, eviction rate, late-payment / NSF rate, and stable-employment percentage? A property-management company in the area should have these aggregated.
- How much new for-sale + rental construction is in the pipeline within 1–3 miles? Heavy new supply typically softens prices + rents 12–24 months out; constrained supply supports both.
Investment metrics
- 1% rule
- 1.14% ✓
- Cap rate
- 8.90%
- Cash-on-cash
- 9.30%
- DSCR
- 1.41
- GRM
- 7.3
CMA / ARV
- ARV (median comp)
- $243,878
- List price
- $245,000
- Delta
- 1.89%
- Verdict
- FAIR
- Comps
- 20 within 1.0 mi
Show comp detail 12 sales within ~0.75 mi
| Address | Dist | Beds/Ba | Sqft | Sold | Price | $/sf | Match |
|---|---|---|---|---|---|---|---|
| 18349 Kaiti Dr | 0.20mi | 3/2.0 | 1,618 (-4%) | 2mo | $361,000 | $223 | 81 |
| 4839 Richard Dr | 0.29mi | 3/2.0 | 1,725 (+3%) | 1mo | $457,500 | $265 | 80 |
| 18345 Judith Way | 0.27mi | 3/2.0 | 1,620 (-4%) | 2mo | $493,300 | $305 | 77 |
| 18476 Platinum Dr | 0.26mi | 4/2.0 (+1) | 1,782 (+6%) | 4mo | $346,000 | $194 | 68 |
| 4905 Stephen Ln | 0.29mi | 3/2.5 | 1,795 (+7%) | 5mo | $389,300 | $217 | 67 |
| 4906 Southview Dr | 0.35mi | 4/2.0 (+1) | 1,732 (+3%) | 6mo | $385,000 | $222 | 67 |
| 4863 Richard Dr | 0.30mi | 3/2.0 | 1,864 (+11%) | 1mo | $516,665 | $277 | 65 |
| 1634 Northwood Dr | 0.49mi | 3/2.0 | 1,552 (-8%) | 5mo | $310,000 | $200 | 58 |
| 339 Azalea Ln | 0.72mi | 3/2.0 | 1,620 (-4%) | 2mo | $289,900 | $179 | 57 |
| 639 Blackwood Dr | 0.63mi | 4/1.5 (+1) | 1,732 (+3%) | 6mo | $299,900 | $173 | 55 |
| 1328 Hilltop Dr | 0.45mi | 3/1.5 | 1,912 (+14%) | 1mo | $269,900 | $141 | 55 |
| 2305 Hillcrest Ln | 0.68mi | 3/2.0 | 1,757 (+4%) | 6mo | $370,000 | $211 | 54 |
Match score weights: distance 35% · size 25% · config 20% · recency 20%. Top-matched comps best support the ARV.
Projected returns pro-forma
-3.0% appreciation · 3.0% rent growth · sell at horizon
- IRR
- -2.2%
- Equity multiple
- 0.92×
- Total profit
- $-5,818
- Equity at exit
- $36,530
- IRR
- 7.5%
- Equity multiple
- 1.56×
- Total profit
- $38,659
- Equity at exit
- $21,183
Cash invested: $68,600 (down + closing). Projections, not guarantees.
Landlord ↔ Tenant lean methodology
- Overall (STATE)
- 90 Strongly Landlord-Friendly
- State Indiana
- 90 Strongly Landlord-Friendly · R+11
- County
- — inherits STATE
- City
- — inherits STATE
ZIP-level market 46356
- Home prices YoY
- -30.1%
- Active inventory
- 351
- Price-to-rent
- 7.3×
Monthly cashflow live
- Estimated rent
- $2,800 medium interval (Pro) →
- Mortgage (P&I)
- −$1,285
- Tax from tax record
- −$179 /mo · $2,144/yr
- Insurance
- −$102
- HOA
- −$115
- Vacancy / Maint / Mgmt
- −$588
- Net cashflow
- $531
Break-even live
Sensitivity live
| Price | -10% $670 | -5% $601 | +0% $531 | +5% $462 | +10% $393 |
|---|---|---|---|---|---|
| Rent | -10% $310 | -5% $421 | +0% $531 | +5% $642 | +10% $753 |
| Rate | -1.0pp $655 | -0.5pp $594 | base $531 | +0.5pp $468 | +1.0pp $403 |
UW: 25.0% down · 7.5% · 30yr · 1.5% tax · 5.0% vac · 8.0% maint · 8.0% mgmt
Financing live
Cash to close
- Down payment
- $61,250
- Closing costs
- $7,350
- Reserves months
- —
- Total cash needed
- —
Loan-product check · same deal, 3 products live
Conventional
25% down · 7.5% · 30yr
- Down + closing
- —
- Monthly P&I
- —
- Monthly cashflow
- —
- DSCR
- —
- Eligible?
- —
Personal DTI + credit; lowest rate.
DSCR
20% down · 8.5% · 30yr
- Down + closing
- —
- Monthly P&I
- —
- Monthly cashflow
- —
- DSCR
- —
- Eligible?
- —
No personal income docs; deal must DSCR.
Hard money
10% down · 12.0% · 12mo
- Down + closing
- —
- Monthly P&I
- —
- Monthly cashflow
- —
- DSCR
- —
- Eligible?
- —
Short-term bridge; refi at stabilization.
Rent comps 1 comps
| Address | Beds | Baths | Sqft | Rent | $/sqft | DOM | Units | Dist |
|---|---|---|---|---|---|---|---|---|
| 4507 W 173rd Ave Lowell, IN | 4.0 | 3.0 | 1900 | $2,800 | $1.47 | 20d | 1 | 1.24mi |
HOA detail
- Monthly dues
- $115 · $1,380/yr
- Likely covers
- landscaping
Listing history 19 events
-
2026-06-21pricedays on market $245,000 Active 43 DOM
-
2026-06-18days on market $248,490 Active 40 DOM
-
2026-06-17pricedays on market $248,490 Active 39 DOM
-
2026-06-16days on market $248,495 Active 38 DOM
-
2026-06-15days on market $248,495 Active 37 DOM
-
2026-06-13pricedays on market $248,495 Active 35 DOM
-
2026-06-09days on market $248,500 Active 31 DOM
-
2026-06-08days on market $248,500 Active 30 DOM
-
2026-06-07pricedays on market $248,500 Active 29 DOM
-
2026-06-04days on market $255,000 Active 26 DOM
-
2026-06-03days on market $255,000 Active 25 DOM
-
2026-06-02days on market $255,000 Active 24 DOM
-
2026-06-01days on market $255,000 Active 23 DOM
-
2026-05-31days on market $255,000 Active 22 DOM
-
2026-05-18price $258,000 1811-char remark
-
2026-05-15price $259,990 1811-char remark
-
2026-05-08$259,995 Active 1811-char remark
-
2013-10-21soldstatus $126,495 636-char remark
Show marketing remark (636 chars)
100% USDA FINANCING AVAILABLE!! Providence Townes of Lowell presents the Bayport! Maintenance free townhome living. Conveniently located just minutes from I-65, shopping, dining and Downtown Lowell. Main level features spacious kitchen and an abundance of cabinets. Upper level include an over-sized master bedroom with walk-in closet, and second floor laundry for convenience. Exterior features include attached garage, and professional landscaping package. You will have piece of mind knowing you are purchasing a quality constructed home by Providence Real Estate Development!! * * UNDER CONSTRUCTION * * ESTIMATED JULY COMPLETION.
-
2012-11-08$126,680 636-char remark
Show marketing remark (636 chars)
100% USDA FINANCING AVAILABLE!! Providence Townes of Lowell presents the Bayport! Maintenance free townhome living. Conveniently located just minutes from I-65, shopping, dining and Downtown Lowell. Main level features spacious kitchen and an abundance of cabinets. Upper level include an over-sized master bedroom with walk-in closet, and second floor laundry for convenience. Exterior features include attached garage, and professional landscaping package. You will have piece of mind knowing you are purchasing a quality constructed home by Providence Real Estate Development!! * * UNDER CONSTRUCTION * * ESTIMATED JULY COMPLETION.
ⓘ Source: listings_history table (triggers on properties + properties_extension) + one-shot
backfill from property_details.listing_events for pre-trigger history.
Tax reassessment forecast IN · Partial reset (capped growth)
- Current annual tax
- $2,144 · $179/mo
- Projected year-2 tax
- $2,144 · $179/mo
- Expected delta
- $0/yr ($0/mo · 0.0%)
ⓘ Screening estimate from a state-policy table — verify with the county assessor before closing.
Climate risk First Street
- Flood 1/10 Low FEMA zone X (unshaded) · 0% chance over 30 yrs
- Wildfire 1/10 Low
- Heat 3/10 Moderate 7 d/yr ≥101°F today · 16 d/yr by 30 yrs out
- Wind 2/10 Low 0% chance of damaging wind over 30 yrs
- Air quality 2/10 Low 1 unhealthy d/yr today · 2 by 30 yrs out
Nearby sold comps map
Loading sold comps map…
Walkable amenities ~0.75 mi
Loading nearby amenities…
Taxation est. · year 1
- Rental income
- $33,600
- − Mortgage interest
- −$13,724
- − Property taxes
- −$2,144
- − Insurance
- −$1,225
- − Repairs & maintenance
- −$2,688
- − Management
- −$2,688
- − HOA
- −$1,380
- − Depreciation
- −$7,127
- Taxable income
- $2,624
- Est. tax owed @ 24.0%
- −$630
- After-tax cash flow
- $5,748/yr
For passive investors: Depreciation is non-cash, so a rental often shows a tax loss while cash-flowing — sheltering income. Rental losses are passive: they offset passive income freely, and up to $25,000/yr can offset ordinary (W-2) income if you actively participate and your MAGI is under $100k (phasing out to $0 by $150k); unused losses carry forward. On sale, claimed depreciation is recaptured at up to 25%, and gains may owe capital-gains tax (a 1031 exchange can defer both). Figures are a year-1 estimate at your 24.0% rate — not tax advice; consult a CPA.
Schools (NCES district)
- District
- Tri-Creek School Corporation
- NCES district ID
- 1811460
- Math proficiency
- 46% ▼ -8.00%
- Reading proficiency
- 56% ▼ -5.00%
- Median HH income
- $64,614
- Composite
- 44.97/100
- National rank
- #2704
- State rank
- #39 of 301 in IN
Livability — Lowell
- Score
- 76/100
- State rank
- #51
- US rank
- #3455
Category grades
Schools grade is shown separately in the Schools card above.
Census & demographics
- Census place
- Lowell, IN
- City population
- 19,396
- Population (ZIP)
- 19,396
Population outlook (Lake County) Hauer SSP2
- Today (2025)
- 484,026 people
- By 2030
- 478,091 · -1.2%
- By 2040
- 462,974 · -4.3%
- By 2050
- 449,894 · -7.1%
- By 2075
- 436,169 · -9.9%
- By 2100
- 426,607 · -11.9%
Race, ethnicity, and origin ACS 2023
- Neighborhood character
- Predominantly White (88%)
- Race & ethnicity
- White 88% Hispanic / Latino 9% Two or more races 6%
- Hispanic origin (detail)
- Mexican 8%
- Common ancestry
- Romanian 16% Iranian 10% Lithuanian 2%
- Foreign-born
- 4% · Canada
- Languages at home
- 95% English-only · Spanish 4% Russian/Polish/Slavic 1%
Political lean MEDSL · Lake
- 2024 margin
- Lean D (+5.6) · D 52.1% · R 46.5% · Other 1.5%
- 2008→2024 swing
- -28.6pp toward R · 2008: 34.3pp · 2024: 5.6pp
- All cycles
- 2024: D+5.6 2020: D+15.1 2016: D+20.6 2012: D+31.0 2008: D+34.3
Not yet ingested
- Civics
- —
Market trends
- HPI YoY
- ▼ -110.73%
- Current HPI
- 256.6224
- Rent YoY
- —
- Metro
- —
- State GDP YoY
- ▲ 2.90%
- F500 in state
- 18
Industry mix (Fortune 500 HQ in IN)
| Industry | F500 HQs | Revenue |
|---|---|---|
| Industrial Machinery | 2 | $37B |
|
||
| Healthcare | 1 | $177B |
|
||
| Pharmaceuticals | 1 | $45B |
|
||
| Metals / Steel | 1 | $18B |
|
||
| Agriculture | 1 | $17B |
|
||
| Packaging | 1 | $12B |
|
||
Price history
+96.2% since first listed9 events — show timeline
- 2026-06-16 Price Changed $248,490 NIRA MLS as Distributed by MLS Grid
- 2026-06-10 Price Changed $248,495 NIRA MLS as Distributed by MLS Grid
- 2026-06-04 Price Changed $248,500 NIRA MLS as Distributed by MLS Grid
- 2026-05-29 Price Changed $255,000 NIRA MLS as Distributed by MLS Grid
- 2026-05-18 Price Changed $258,000 NIRA MLS as Distributed by MLS Grid
- 2026-05-15 Price Changed $259,990 NIRA MLS as Distributed by MLS Grid
- 2026-05-08 Listed $259,995 NIRA MLS as Distributed by MLS Grid
- 2013-10-21 Sold (MLS) $126,495 NIRA MLS as Distributed by MLS Grid
- 2012-11-08 Listed $126,680 NIRA MLS as Distributed by MLS Grid
Property tax history
+34.1%/yrLatest (2024): $2,144 · +1.8% YoY. Source: county tax records.
Cash-flow waterfall
monthlySold comps — $/sqft
last 12 mo · ≤1 miLoading sold comps…