712 Beardsley Ct · Ferguson, MO
Flood risk 1/10 · Minimal
- FEMA flood zone
- X (unshaded)
- Chance of flooding over 30 yrs
- 0.0%
- Est. flood insurance / yr
- $507 – $1,088
Fire risk 1/10 · Minimal
- Est. fire insurance / yr
- $1,054 – $1,958
Heat risk 4/10 · Minor
- Hot days now (above 106°F)
- 7 days/yr
- Hot days in 30 yrs
- 20 days/yr
Wind risk 2/10 · Minimal
- Chance of severe wind over 30 yrs
- 1.0%
Air-quality risk 4/10 · Minor
- Unhealthy air days now
- 4 days/yr
- Unhealthy air days in 30 yrs
- 5 days/yr
Risk factors via First Street. Map © Google.
Why this score? — see what drove the B- grade
The composite is a weighted blend of 9 inputs, each scored 0–100. Each bar is that input's sub-score; the figure is the points it added to the 100-point composite (weight × sub-score).
- Cash flow +30.0/30.0
- 1% rule +10.0/10.0
- DSCR +10.0/10.0
- ARV discount +7.5/15.0
- Rent growth +4.8/5.0
- Livability +2.9/5.0
- Condition / age +2.5/5.0
- Schools +1.2/10.0
- Appreciation +0.0/10.0
$34,900
🖨 Deal sheet 📄 Offer letter ✓ Due diligence
Listing remarks
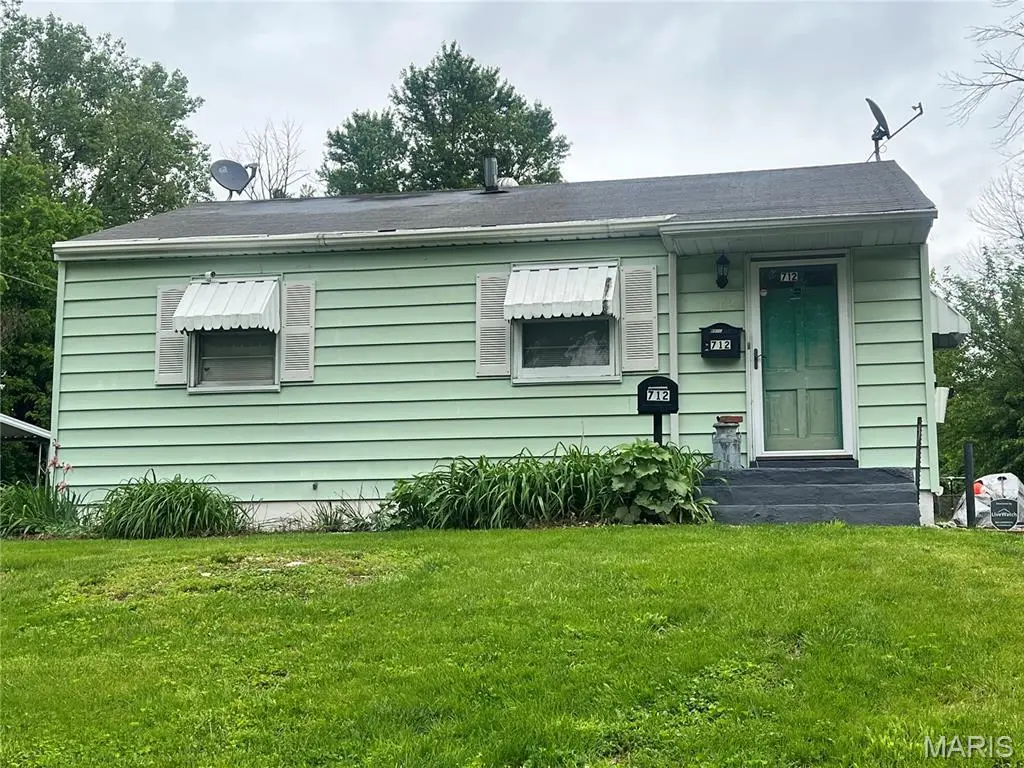
Great investment opportunity with strong potential! This 2-bedroom, 1-bath home sits on a large, level lot and features hardwood floors, functional layouts, a detached 2-car garage, and an additional shed for storage. The large backyard offers plenty of outdoor space and room for future possibilities. Ideal for investors or buyers looking to renovate and add value. Priced to sell with a motivated seller, this is an opportunity you won’t want to miss. Property to be sold as-is; all offers must be submitted on a special sales contract.
Key facts
- Large backyard
- Level lot
- Hardwood floors
Tags
Property features AI
Finance
- Other: No pool
- Financial info: Lease not considered
Exterior
- Parking: Attached garage (1 car)
- Utilities: Public water; Public sewer (sewer connected); Electric service by Ameren
- Home design: Single-family residence; One-level home; Residential property
- Construction: Vinyl siding; Crawl space foundation; Built prior to or recorded in public records
- Exterior features: Back yard
Interior
- Bedrooms: 2 bedrooms — both on the main level
- Bathrooms: 1 full bathroom on the main level
- Heating & cooling: Forced air heating; Central air conditioning
- Interior features: Gas fireplace (1)
Neighborhood map
What this means for you Summary
Snapshot
- This is a 2-bed/1.0-bath single-family listed at $35k.
Deal economics
- At list price, monthly cash flow is $740 ($9k/yr) — positive.
- The deal already cash-flows at list — no discount required.
- Meets the 1% rule at list price ($1k rent vs $35k).
- Cap rate 31.7% vs local median 9.2% in Ferguson — top-decile yield for the area; either an underpriced asset or a hidden risk that comps aren't pricing in. Stress-test before assuming the spread holds.
Location & tenants
- Location reads 58/100 on livability (#586 in MO) — a working-class tenant base; expect higher turnover. Strengths: cost of living A+, housing B+; Watch: health & safety C-, crime F, amenities F.
- Ferguson-Florissant R-II (suburban): math 7% / reading 20% proficiency, ranked #311 of 324 in MO (top 96%) — low school quality limits family demand, transient renter base, plan for 1-2y turnover; 70% free/reduced lunch — lower-income household profile, screen leases tightly.
- Zoned schools: Bermuda Elementary (143 students, 98% FRL); Mccluer High (math 0% / reading 17%, grade F, #511 of 521 statewide, top 98%, 1,181 students, 100% FRL) — zoned schools average 99% FRL vs 70% district-wide (29 pts higher); higher-poverty schools than district average — tighter screening recommended.
- Market conditions: Rents rising fast (+9.0%/yr); 162 active listings in the ZIP; 40 comparable units currently listed for rent nearby; rentals at typical pace (median 24d on market — plan ~3-4 weeks tenant-placement turnaround); 40% of comp listings sitting > 30 days — soft ceiling on asking rent; 920 units permitted in St. Louis County in 2024 (250 in 5+ unit buildings).
Forward outlook
- Local home prices are declining (-3.0%/yr); year-one equity from $241 of loan paydown is wiped out by about $1k of value loss. Plan a longer hold.
- At projected returns (-3.0% appreciation + 8.0% rent growth), your $10k cash investment doubles in ~2 years — after that, you're playing with house money.
Negotiation context
- Only 5 days on market — expect competitive offers; lowballing is unlikely to land.
Risks & watch-outs
- Watch-outs: property tax is 2.5% of price; built in 1952 — expect roof / HVAC / electrical / plumbing capex.
Questions for the listing agent
- Built in 1952 — when were the roof, HVAC, electrical panel, plumbing, and water heater last replaced?
- Property tax is high relative to price — has the assessment been appealed recently, and will the sale trigger a re-assessment?
- Is there a deadline driving the sale (1031 exchange, divorce, estate, relocation)? That informs how much negotiation room exists.
- Schools are F-rated, which usually means shorter tenancies and higher turnover. Who's the typical renter profile here, and what's been the actual vacancy rate?
- Crime grade is F in this area — have there been break-ins, vandalism, or insurance claims at this property in the last 3 years? What carrier currently insures it and at what premium?
- What's the average days-on-market for RENTAL listings here right now (not sales)? A rising rental-DOM trend means longer vacancies and softer asking-rent achievability than the comps imply.
- What's the recent tenant-quality profile in this submarket — average credit score on applications, eviction rate, late-payment / NSF rate, and stable-employment percentage? A property-management company in the area should have these aggregated.
- How much new for-sale + rental construction is in the pipeline within 1–3 miles? Heavy new supply typically softens prices + rents 12–24 months out; constrained supply supports both.
Investment metrics
- 1% rule
- 3.66% ✓
- Cap rate
- 31.72%
- Cash-on-cash
- 90.82%
- DSCR
- 5.04
- GRM
- 2.3
CMA / ARV
- ARV (on-the-fly)
- $95,880
- Comps found
- 12
Show comp detail 12 sales within ~0.75 mi
| Address | Dist | Beds/Ba | Sqft | Sold | Price | $/sf | Match |
|---|---|---|---|---|---|---|---|
| 35 Lee Ave | 0.20mi | 2/1.0 | 1,066 (+4%) | 2mo | $65,000 | $61 | 82 |
| 6016 Dupree Ave | 0.49mi | 2/1.0 | 1,020 (0%) | 3mo | $34,900 | $34 | 75 |
| 6188 Dupree Ave | 0.36mi | 3/1.5 (+1) | 972 (-5%) | 4mo | $75,000 | $77 | 65 |
| 296 Meadowcrest Dr | 0.45mi | 3/1.0 (+1) | 960 (-6%) | 2mo | $109,900 | $114 | 62 |
| 247 S Hartnett Ave Unit 1/2 | 0.46mi | 2/1.0 | 902 (-12%) | 2mo | $75,000 | $83 | 58 |
| 277 Dashwood Dr | 0.55mi | 3/1.0 (+1) | 960 (-6%) | 2mo | $74,900 | $78 | 58 |
| 227 Meadowcrest Dr | 0.54mi | 3/1.0 (+1) | 960 (-6%) | 3mo | $129,900 | $135 | 57 |
| 299 Dashwood Dr | 0.52mi | 3/2.0 (+1) | 960 (-6%) | 4mo | $114,000 | $119 | 54 |
| 1006 Highmont Dr | 0.66mi | 3/1.0 (+1) | 960 (-6%) | 4mo | $109,900 | $114 | 51 |
| 945 Edgehill Dr | 0.64mi | 3/1.0 (+1) | 1,110 (+9%) | 3mo | $114,900 | $104 | 48 |
| 5614 Sanborn Dr | 0.69mi | 3/1.0 (+1) | 1,120 (+10%) | 1mo | $104,999 | $94 | 46 |
| 1120 Highmont Dr | 0.70mi | 3/1.0 (+1) | 1,116 (+9%) | 4mo | $58,000 | $52 | 43 |
Match score weights: distance 35% · size 25% · config 20% · recency 20%. Top-matched comps best support the ARV.
Projected returns pro-forma
-3.0% appreciation · 8.0% rent growth · sell at horizon
- IRR
- 97.3%
- Equity multiple
- 5.94×
- Total profit
- $48,244
- Equity at exit
- $5,204
- IRR
- —
- Equity multiple
- 14.67×
- Total profit
- $133,578
- Equity at exit
- $3,018
Cash invested: $9,772 (down + closing). Projections, not guarantees.
Landlord ↔ Tenant lean methodology
- Overall (STATE)
- 81 Strongly Landlord-Friendly
- State Missouri
- 81 Strongly Landlord-Friendly · R+10
- County
- — inherits STATE
- City
- — inherits STATE
ZIP-level market 63135
- Rents YoY
- 9.0%
- Active inventory
- 162
- Price-to-rent
- 2.3×
Monthly cashflow live
- Estimated rent
- $1,279 high interval (Pro) →
- Mortgage (P&I)
- −$183
- Tax from tax record
- −$73 /mo · $879/yr
- Insurance
- −$15
- HOA
- −$0
- Vacancy / Maint / Mgmt
- −$269
- Net cashflow
- $740
Break-even live
UW: 25.0% down · 7.5% · 30yr · 1.5% tax · 5.0% vac · 8.0% maint · 8.0% mgmt
Financing live
Cash to close
- Down payment
- $8,725
- Closing costs
- $1,047
- Reserves months
- —
- Total cash needed
- —
Loan-product check · same deal, 3 products live
Conventional
25% down · 7.5% · 30yr
- Down + closing
- —
- Monthly P&I
- —
- Monthly cashflow
- —
- DSCR
- —
- Eligible?
- —
Personal DTI + credit; lowest rate.
DSCR
20% down · 8.5% · 30yr
- Down + closing
- —
- Monthly P&I
- —
- Monthly cashflow
- —
- DSCR
- —
- Eligible?
- —
No personal income docs; deal must DSCR.
Hard money
10% down · 12.0% · 12mo
- Down + closing
- —
- Monthly P&I
- —
- Monthly cashflow
- —
- DSCR
- —
- Eligible?
- —
Short-term bridge; refi at stabilization.
Rent comps 40 comps
| Address | Beds | Baths | Sqft | Rent | $/sqft | DOM | Units | Dist |
|---|---|---|---|---|---|---|---|---|
| 26 Arbor Village Ct Ferguson, MO | 1.0–2.0 | 1.0 | 714 | $950 | $1.33 | 23d | 1 | 0.19mi |
| 12 Lee Ave Saint Louis, MO | 2.0 | 1.0 | 832 | $1,080 | $1.30 | 7d | 1 | 0.25mi |
| 110 Paul Ave Saint Louis, MO | 3.0 | 1.0 | 875 | $1,050 | $1.20 | 7d | 1 | 0.25mi |
| 6180 Emerald Ave Saint Louis, MO | 2.0 | 1.0 | 729 | $1,300 | $1.78 | 43d | 1 | 0.27mi |
| 6170 Emerald Ave Saint Louis, MO | 3.0 | 1.0 | 1286 | $1,500 | $1.17 | 14d | 1 | 0.29mi |
| 6170 Emerald Ave Saint Louis, MO | 3.0 | 1.0 | 1286 | $1,425 | $1.11 | 2d | 1 | 0.29mi |
| 338 Saint Louis Ave Saint Louis, MO | 3.0 | 1.0 | 1200 | $1,200 | $1.00 | 43d | 1 | 0.29mi |
| 617 Tesmore Pl Saint Louis, MO | 2.0 | 1.0 | 877 | $1,200 | $1.37 | 43d | 1 | 0.33mi |
| 6188 Dupree Ave Saint Louis, MO | 3.0 | 1.5 | 972 | $1,300 | $1.34 | 43d | 1 | 0.34mi |
| 419 S Florissant Rd Ferguson, MO | 2.0 | 1.0 | 1100 | $1,200 | $1.09 | 43d | 1 | 0.37mi |
| 296 Meadowcrest Dr Saint Louis, MO | 3.0 | 1.0 | 960 | $1,550 | $1.61 | 14d | 1 | 0.43mi |
| 249 S Hartnett Ave Saint Louis, MO | 3.0 | 1.0 | 960 | $1,220 | $1.27 | 23d | 1 | 0.43mi |
| 223 Wiegel Dr Saint Louis, MO | 3.0 | 1.0 | 864 | $1,560 | $1.81 | 12d | 1 | 0.49mi |
| 227 Meadowcrest Dr Saint Louis, MO | 3.0 | 1.0 | 960 | $1,500 | $1.56 | 43d | 1 | 0.52mi |
| 222 Randolph Ave Saint Louis, MO | 2.0 | 1.0 | 964 | $1,400 | $1.45 | 7d | 1 | 0.54mi |
| 5925 Brand Ave Saint Louis, MO | 3.0 | 1.0 | 951 | $1,200 | $1.26 | 43d | 1 | 0.59mi |
| 801 Thomas Ave Saint Louis, MO | 3.0 | 1.0 | 864 | $1,350 | $1.56 | 43d | 1 | 0.60mi |
| 5900 Sheriton Dr Saint Louis, MO | 3.0 | 1.0 | 864 | $1,050 | $1.22 | 23d | 1 | 0.62mi |
| 945 Edgehill Dr Saint Louis, MO | 3.0 | 1.0 | 1110 | $1,575 | $1.42 | 43d | 1 | 0.62mi |
| 246 Louisa Ave Saint Louis, MO | 3.0 | 1.0 | 1036 | $1,600 | $1.54 | 43d | 1 | 0.62mi |
| 204 Hawkesbury Dr Saint Louis, MO | 2.0 | 1.0 | 849 | $1,250 | $1.47 | 4d | 1 | 0.63mi |
| 5830 Bermuda Dr Unit 30B St. Louis, MO | 2.0 | 1.0 | 900 | $895 | $0.99 | 23d | 1 | 0.71mi |
| 5830 Bermuda Dr Unit 34C St. Louis, MO | 2.0 | 1.0 | 850 | $895 | $1.05 | 43d | 1 | 0.71mi |
| 806 Marvin Ave Saint Louis, MO | 2.0 | 1.0 | 726 | $1,100 | $1.52 | 43d | 1 | 0.75mi |
| 13 N Hartnett Ave Saint Louis, MO | 3.0 | 1.0 | 1140 | $1,400 | $1.23 | 10d | 1 | 0.76mi |
| 7816 Dartmoor Dr Saint Louis, MO | 3.0 | 1.0 | 950 | $1,195 | $1.26 | 43d | 1 | 0.76mi |
| 104 Fenwick Dr Saint Louis, MO | 3.0 | 1.0 | 960 | $1,250 | $1.30 | 23d | 1 | 0.82mi |
| 360 S Harvey Ave Saint Louis, MO | 2.0 | 1.0 | 936 | $925 | $0.99 | 43d | 1 | 0.85mi |
| 5300 Grove Ave Saint Louis, MO | 3.0 | 1.0 | 840 | $1,295 | $1.54 | 23d | 1 | 0.85mi |
| 265 S Harvey Ave Saint Louis, MO | 3.0 | 1.5 | 1240 | $1,350 | $1.09 | 43d | 1 | 0.89mi |
| 519 Graf Ave Saint Louis, MO | 3.0 | 2.0 | 887 | $1,297 | $1.46 | 20d | 1 | 0.90mi |
| 324 Emmett Ave Saint Louis, MO | 3.0 | 2.0 | 1357 | $1,650 | $1.22 | 23d | 1 | 0.92mi |
| 8408 Hill Ave Saint Louis, MO | 3.0 | 2.0 | 1040 | $1,550 | $1.49 | 23d | 1 | 0.93mi |
| 709 Suburban Ave Saint Louis, MO | 2.0 | 1.0 | 975 | $1,400 | $1.44 | 43d | 1 | 0.95mi |
| 307 Coppinger Dr Saint Louis, MO | 3.0 | 1.0 | 960 | $1,095 | $1.14 | 17d | 1 | 0.99mi |
| 450 S Dade Ave Saint Louis, MO | 2.0 | 1.0 | 1040 | $1,200 | $1.15 | 23d | 1 | 1.00mi |
| 601 Carson Rd Saint Louis, MO | 2.0 | 1.0 | 743 | $950 | $1.28 | 23d | 1 | 1.03mi |
| 7808 Winward Dr Saint Louis, MO | 3.0 | 1.0 | 1434 | $1,425 | $0.99 | 21d | 1 | 1.04mi |
| 401 Millman Dr Saint Louis, MO | 3.0 | 1.0 | 1008 | $1,450 | $1.44 | 16d | 1 | 1.05mi |
| 422 Plaza Ave Saint Louis, MO | 3.0 | 1.0 | 792 | $1,000 | $1.26 | 7d | 1 | 1.06mi |
Listing history 6 events
-
2026-06-02status $34,900 Pending 5 DOM
-
2026-06-01days on market $34,900 Active 5 DOM
-
2026-05-31days on market $34,900 Active 4 DOM
-
2026-05-27$34,900 Active
-
2002-08-19soldstatus
-
1995-10-24soldstatus
ⓘ Source: listings_history table (triggers on properties + properties_extension) + one-shot
backfill from property_details.listing_events for pre-trigger history.
Tax reassessment forecast MO · Resets to sale price
- Current annual tax
- $879 · $73/mo
- Projected year-2 tax
- $879 · $73/mo
- Expected delta
- $0/yr ($0/mo · 0.0%)
ⓘ Screening estimate from a state-policy table — verify with the county assessor before closing.
Climate risk First Street
- Flood 1/10 Low FEMA zone X (unshaded) · 0% chance over 30 yrs
- Wildfire 1/10 Low
- Heat 4/10 Moderate 7 d/yr ≥106°F today · 20 d/yr by 30 yrs out
- Wind 2/10 Low 100% chance of damaging wind over 30 yrs
- Air quality 4/10 Moderate 4 unhealthy d/yr today · 5 by 30 yrs out
Nearby sold comps map
Loading sold comps map…
Walkable amenities ~0.75 mi
Loading nearby amenities…
Taxation est. · year 1
- Rental income
- $15,348
- − Mortgage interest
- −$1,955
- − Property taxes
- −$879
- − Insurance
- −$174
- − Repairs & maintenance
- −$1,228
- − Management
- −$1,228
- − Depreciation
- −$1,015
- Taxable income
- $8,868
- Est. tax owed @ 24.0%
- −$2,128
- After-tax cash flow
- $6,746/yr
For passive investors: Depreciation is non-cash, so a rental often shows a tax loss while cash-flowing — sheltering income. Rental losses are passive: they offset passive income freely, and up to $25,000/yr can offset ordinary (W-2) income if you actively participate and your MAGI is under $100k (phasing out to $0 by $150k); unused losses carry forward. On sale, claimed depreciation is recaptured at up to 25%, and gains may owe capital-gains tax (a 1031 exchange can defer both). Figures are a year-1 estimate at your 24.0% rate — not tax advice; consult a CPA.
Schools (NCES district)
- District
- Ferguson-Florissant R-II
- NCES district ID
- 2912010
- Math proficiency
- 7% ▼ -9.00%
- Reading proficiency
- 20% ▼ -6.00%
- Median HH income
- $44,610
- Composite
- 11.96/100
- National rank
- #9666
- State rank
- #311 of 324 in MO
Livability — Ferguson
- Score
- 58/100
- State rank
- #586
- US rank
- #20809
Category grades
Schools grade is shown separately in the Schools card above.
Census & demographics
- Census place
- Ferguson, MO
- County
- Saint Louis County · 888,823 people
- City population
- 18,381
- Metro
- St. Louis, MO-IL
- Population (ZIP)
- 18,381
- Household income
- $52,328
- Rent vs Own
- Severe rent burden
- 957.0
Population outlook (St. Louis County) Hauer SSP2
- Today (2025)
- 1,025,227 people
- By 2030
- 1,028,023 · +0.3%
- By 2040
- 1,020,940 · -0.4%
- By 2050
- 1,007,280 · -1.8%
- By 2075
- 987,277 · -3.7%
- By 2100
- 921,984 · -10.1%
Race, ethnicity, and origin ACS 2023
- Neighborhood character
- Predominantly Black (66%)
- Race & ethnicity
- Black 66% White 28% Two or more races 3% Hispanic / Latino 2%
- Common ancestry
- Lithuanian 1% Iranian 1% Romanian 1%
- Foreign-born
- 1% · Canada
- Languages at home
- 95% English-only · Spanish 4%
Political lean MEDSL · St. Louis
- 2024 margin
- Strong D (+23.4) · D 60.8% · R 37.4% · Other 1.7%
- 2008→2024 swing
- +3.5pp toward D · 2008: 19.9pp · 2024: 23.4pp
- All cycles
- 2024: D+23.4 2020: D+24.0 2016: D+16.2 2012: D+13.7 2008: D+19.9
Not yet ingested
- Civics
- —
Market trends
- HPI YoY
- ▼ -152.56%
- Current HPI
- 138.6781
- Rent YoY
- ▲ 9.03%
- Metro
- St. Louis, MO-IL
- State GDP YoY
- ▲ 1.84%
- F500 in state
- 20
Industry mix (Fortune 500 HQ in MO)
| Industry | F500 HQs | Revenue |
|---|---|---|
| Healthcare | 1 | $163B |
|
||
| Insurance | 1 | $21B |
|
||
| Industrial Technology | 1 | $17B |
|
||
| Retail | 1 | $16B |
|
||
| Industrial Distribution | 1 | $10B |
|
||
| Utilities | 1 | $9B |
|
||
Price history
3 events — show timeline
- 2026-05-27 Listed $34,900 MARIS as Distributed by MLS Grid
- 2002-08-19 Sold (Public Records) — Public Records
- 1995-10-24 Sold (Public Records) — Public Records
Property tax history
+1.7%/yrLatest (2022): $879 · +3.3% YoY. Source: county tax records.
Cash-flow waterfall
monthlySold comps — $/sqft
last 12 mo · ≤1 miLoading sold comps…