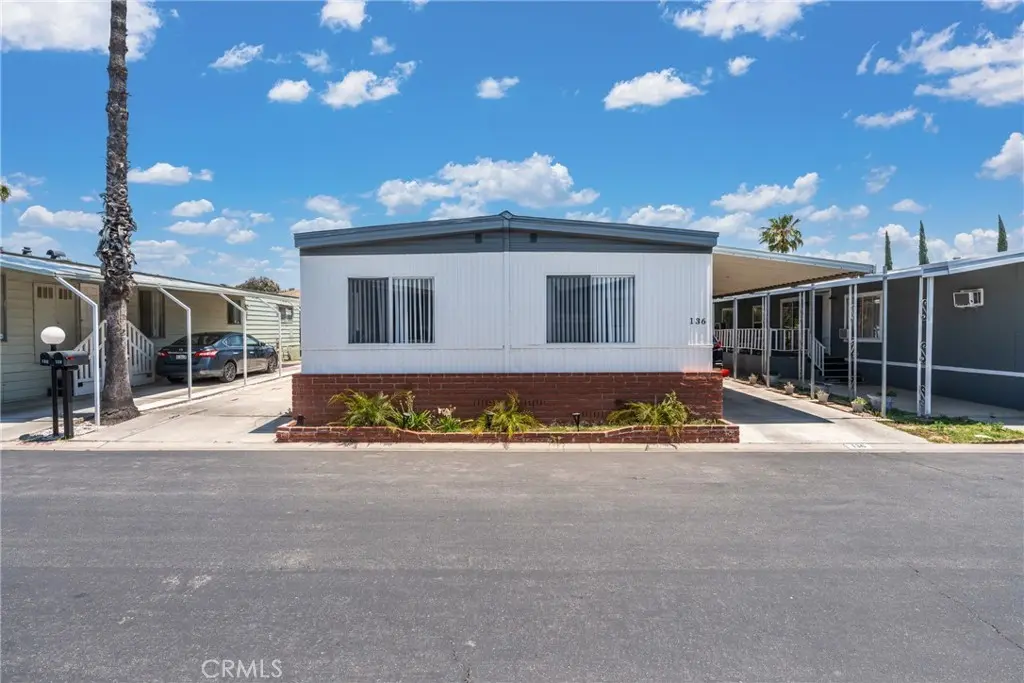
1155 S Riverside St #136 · Rialto, CA
Flood risk 6/10 · Moderate
- FEMA flood zone
- X (unshaded)
- Chance of flooding over 30 yrs
- 0.74%
- Est. flood insurance / yr
- $507 – $1,088
Fire risk 1/10 · Minimal
- Est. fire insurance / yr
- $659 – $1,223
Heat risk 8/10 · Major
- Hot days now (above 102°F)
- 6 days/yr
- Hot days in 30 yrs
- 18 days/yr
Wind risk 1/10 · Minimal
- Chance of severe wind over 30 yrs
- —
Air-quality risk 10/10 · Severe
- Unhealthy air days now
- 27 days/yr
- Unhealthy air days in 30 yrs
- 32 days/yr
Risk factors via First Street. Map © Google.
Why this score? — see what drove the B- grade
The composite is a weighted blend of 9 inputs, each scored 0–100. Each bar is that input's sub-score; the figure is the points it added to the 100-point composite (weight × sub-score).
- Cash flow +30.0/30.0
- DSCR +10.0/10.0
- 1% rule +9.1/10.0
- ARV discount +5.4/15.0
- Schools +3.1/10.0
- Livability +3.0/5.0
- Rent growth +2.9/5.0
- Condition / age +2.5/5.0
- Appreciation +0.0/10.0
$180,000
🖨 Deal sheet 📄 Offer letter ✓ Due diligence
Listing remarks
Welcome to this recently upgraded double-wide mobile home located in the desirable Santiago Parkside Estates family community in Rialto. This move-in ready home features 3 spacious bedrooms and 2 bathrooms with comfortable and affordable living in a well-maintained community. Recent upgrades enhance the home's appeal, offering a fresh and inviting atmosphere for its new owners, this home presents a great opportunity for first-time buyers or anyone seeking affordable homeownership. Don’t miss out on this wonderful opportunity!
Key facts
- Built 1973
- Listed 13 days
Property features AI
Finance
- Other: Living area source: appraiser; Lot density: 0-1 unit per acre; Elevation units in feet
- HOA & community: Land lease in place ($900 monthly)
Exterior
- Parking: Located in Santiago Parkside Estates (park name listed)
- Utilities: Public sewer; District/public water
- Home design: Single-story mobile home (Richwood model); Mobile home remains on site; Mobile dimensions approximately 12' x 56'; Orientation: facing (entry) side
- Construction: Year built: as reported by seller
- Exterior features: No pool; Street lighting in the community
Interior
- Bathrooms: 2 full bathrooms
- Heating & cooling: Ductless cooling
- Interior features: Entry on the side; Single-level home
- Laundry & utility: Dedicated laundry room; Washer hookup; Gas and electric dryer hookup
Neighborhood map
What this means for you Summary
Snapshot
- This is a 2-bed/2.0-bath manufactured listed at $180k.
Deal economics
- At list price, monthly cash flow is $755 ($9k/yr) — positive.
- The deal already cash-flows at list — no discount required.
- Meets the 1% rule at list price ($3k rent vs $180k).
- Cap rate 11.3% vs local median 3.5% in Rialto — top-decile yield for the area; either an underpriced asset or a hidden risk that comps aren't pricing in. Stress-test before assuming the spread holds.
Location & tenants
- Location reads 60/100 on livability (#598 in CA) — a middle-class / working-renter tenant base. Strengths: housing A+, commute A-; Watch: schools F, crime F, amenities D-.
- Rialto Unified (suburban): math 25% / reading 46% proficiency, ranked #268 of 517 in CA (top 52%) — families likely to look elsewhere, expect single-tenant / working-renter base with shorter leases; 74% free/reduced lunch — lower-income household profile, screen leases tightly.
- Market conditions: Rents rising (+1.6%/yr); 142 active listings in the ZIP; 12 comparable units currently listed for rent nearby; rentals lingering (median 44d on market — plan ~5-8 weeks vacancy on turnover, expect pricing pressure); 83% of comp listings sitting > 30 days — soft ceiling on asking rent; solid renter incomes; 5,458 units permitted in San Bernardino County in 2024 (1,500 in 5+ unit buildings).
- This rent runs 38% of the median local income ($80k/yr) — at the standard rent-burdened threshold; future hikes will face affordability resistance.
Forward outlook
- Local home prices are declining (-3.0%/yr); year-one equity from $1k of loan paydown is wiped out by about $5k of value loss. Plan a longer hold.
- San Bernardino County population projected at +15% by 2050 — modest demand growth; plan on rents tracking national, not racing it.
- At projected returns (-3.0% appreciation + 1.6% rent growth), your $50k cash investment doubles in ~8 years — after that, you're playing with house money.
Negotiation context
- Only 14 days on market — expect competitive offers; lowballing is unlikely to land.
Risks & watch-outs
- Climate carrying-cost: major flood risk; extreme-heat days projected 6→18/yr by 2055 (HVAC capex compounding) — expect insurance premiums to compound above CPI over the hold.
Questions for the listing agent
- Built in 1973 — when were the roof, HVAC, electrical panel, plumbing, and water heater last replaced?
- Is there a deadline driving the sale (1031 exchange, divorce, estate, relocation)? That informs how much negotiation room exists.
- Schools are F-rated, which usually means shorter tenancies and higher turnover. Who's the typical renter profile here, and what's been the actual vacancy rate?
- Crime grade is F in this area — have there been break-ins, vandalism, or insurance claims at this property in the last 3 years? What carrier currently insures it and at what premium?
- What's the average days-on-market for RENTAL listings here right now (not sales)? A rising rental-DOM trend means longer vacancies and softer asking-rent achievability than the comps imply.
- What's the recent tenant-quality profile in this submarket — average credit score on applications, eviction rate, late-payment / NSF rate, and stable-employment percentage? A property-management company in the area should have these aggregated.
- How much new for-sale + rental construction is in the pipeline within 1–3 miles? Heavy new supply typically softens prices + rents 12–24 months out; constrained supply supports both.
Investment metrics
- 1% rule
- 1.41% ✓
- Cap rate
- 11.33%
- Cash-on-cash
- 17.99%
- DSCR
- 1.80
- GRM
- 5.9
CMA / ARV
- ARV (on-the-fly)
- $172,032
- Comps found
- 11
Show comp detail 11 sales within ~0.75 mi
| Address | Dist | Beds/Ba | Sqft | Sold | Price | $/sf | Match |
|---|---|---|---|---|---|---|---|
| 1155 S RIVERSIDE Dr #7 | 0.00mi | 2/2.0 | 1,300 (-3%) | 2mo | $170,000 | $131 | 93 |
| 1025 S Riverside Ave #66 | 0.08mi | 3/2.0 (+1) | 1,248 (-7%) | 2mo | $165,000 | $132 | 77 |
| 200 W San Bernardino Ave #46 | 0.28mi | 2/2.0 | 1,440 (+7%) | 4mo | $65,000 | $45 | 72 |
| 200 W San Bernardino Ave #100 | 0.28mi | 3/2.0 (+1) | 1,375 (+2%) | 7mo | $210,000 | $153 | 72 |
| 1155 S Riverside #22 | 0.00mi | 3/2.0 (+1) | 1,152 (-14%) | 3mo | $190,000 | $165 | 69 |
| 200 San Bernardino #47 | 0.28mi | 2/2.0 | 1,440 (+7%) | 8mo | $140,000 | $97 | 68 |
| 200 W San Bernardino Ave #35 | 0.31mi | 2/2.0 | 1,442 (+7%) | 13mo | $162,000 | $112 | 63 |
| 1025 S Riverside Ave #20 | 0.14mi | 3/2.0 (+1) | 1,440 (+7%) | 18mo | $185,000 | $128 | 61 |
| 1155 S Riverside Ave #113 | 0.00mi | 3/2.0 (+1) | 1,493 (+11%) | 22mo | $190,000 | $127 | 58 |
| 200 W San Bernardino Ave #132 | 0.28mi | 3/2.0 (+1) | 1,152 (-14%) | 3mo | $139,000 | $121 | 56 |
| 200 San Bern #105 | 0.32mi | 2/2.0 | 1,152 (-14%) | 14mo | $155,000 | $135 | 50 |
Match score weights: distance 35% · size 25% · config 20% · recency 20%. Top-matched comps best support the ARV.
Projected returns pro-forma
-3.0% appreciation · 1.59% rent growth · sell at horizon
- IRR
- 8.0%
- Equity multiple
- 1.31×
- Total profit
- $15,443
- Equity at exit
- $26,839
- IRR
- 16.0%
- Equity multiple
- 2.22×
- Total profit
- $61,434
- Equity at exit
- $15,563
Cash invested: $50,400 (down + closing). Projections, not guarantees.
Landlord ↔ Tenant lean methodology
- Overall (STATE)
- 18 Strongly Tenant-Friendly
- State California
- 18 Strongly Tenant-Friendly · D+13
- County
- — inherits STATE
- City
- — inherits STATE
ZIP-level market 92376
- Rents YoY
- 1.6%
- Active inventory
- 142
- Price-to-rent
- 5.9×
Monthly cashflow live
- Estimated rent
- $2,531 high interval (Pro) →
- Mortgage (P&I)
- −$944
- Tax est. 1.5%
- −$225 /mo · $2,700/yr
- Insurance
- −$75
- HOA
- −$0
- Vacancy / Maint / Mgmt
- −$531
- Net cashflow
- $755
Break-even live
UW: 25.0% down · 7.5% · 30yr · 1.5% tax · 5.0% vac · 8.0% maint · 8.0% mgmt
Financing live
Cash to close
- Down payment
- $45,000
- Closing costs
- $5,400
- Reserves months
- —
- Total cash needed
- —
Loan-product check · same deal, 3 products live
Conventional
25% down · 7.5% · 30yr
- Down + closing
- —
- Monthly P&I
- —
- Monthly cashflow
- —
- DSCR
- —
- Eligible?
- —
Personal DTI + credit; lowest rate.
DSCR
20% down · 8.5% · 30yr
- Down + closing
- —
- Monthly P&I
- —
- Monthly cashflow
- —
- DSCR
- —
- Eligible?
- —
No personal income docs; deal must DSCR.
Hard money
10% down · 12.0% · 12mo
- Down + closing
- —
- Monthly P&I
- —
- Monthly cashflow
- —
- DSCR
- —
- Eligible?
- —
Short-term bridge; refi at stabilization.
Rent comps 12 comps
| Address | Beds | Baths | Sqft | Rent | $/sqft | DOM | Units | Dist |
|---|---|---|---|---|---|---|---|---|
| 1108 S Riverside Ave Rialto, CA | 2.0 | 2.0 | 900 | $1,900 | $2.11 | 43d | 1 | 0.21mi |
| 1004 S Riverside Ave Rialto, CA | 3.0 | 3.0 | 1155 | $2,750 | $2.38 | 43d | 1 | 0.27mi |
| 1004 S Riverside Ave Unit A-3 Rialto, CA | 3.0 | 2.5 | 1155 | $2,750 | $2.38 | 43d | 1 | 0.27mi |
| 2047 Greenbriar St Colton, CA | 2.0 | 2.0 | 1032 | $2,595 | $2.51 | 43d | 1 | 0.32mi |
| 1084 Jacaranda Rd Colton, CA | 2.0 | 2.0 | 1032 | $2,400 | $2.33 | 43d | 1 | 0.42mi |
| 606 S Riverside Ave Rialto, CA | 2.0–3.0 | 1.0–2.0 | 1034 | $2,695 | $2.61 | 1d | 3 | 0.69mi |
| 1163 Bent Rail Cir Colton, CA | 3.0 | 2.0 | 1248 | $2,795 | $2.24 | 43d | 1 | 0.81mi |
| 554 S Willow Ave Unit 1 Rialto, CA | 3.0 | 1.0 | 993 | $2,600 | $2.62 | 43d | 1 | 0.84mi |
| 1031 S Cactus Ave Rialto, CA | 1.0–3.0 | 1.0–2.0 | 1030 | $2,307 | $2.24 | 5d | 1 | 0.86mi |
| 142 E Merrill Ave Rialto, CA | 3.0 | 1.5 | 1120 | $2,495 | $2.23 | 43d | 1 | 0.88mi |
| 210 West South St Unit a Rialto, CA | 3.0 | 2.0 | 1275 | $2,600 | $2.04 | 43d | 1 | 1.02mi |
| 10026 Portola Ave Bloomington, CA | 2.0 | 1.0 | 900 | $1,850 | $2.06 | 43d | 1 | 1.45mi |
Listing history 9 events
-
2026-06-09days on market $180,000 Active 14 DOM
-
2026-06-08days on market $180,000 Active 13 DOM
-
2026-06-07days on market $180,000 Active 12 DOM
-
2026-06-04days on market $180,000 Active 9 DOM
-
2026-06-03days on market $180,000 Active 8 DOM
-
2026-06-02days on market $180,000 Active 7 DOM
-
2026-06-01days on market $180,000 Active 6 DOM
-
2026-05-31days on market $180,000 Active 5 DOM
-
2026-05-26$180,000 Active
ⓘ Source: listings_history table (triggers on properties + properties_extension) + one-shot
backfill from property_details.listing_events for pre-trigger history.
Climate risk First Street
- Flood 6/10 Major FEMA zone X (unshaded) · 74% chance over 30 yrs
- Wildfire 1/10 Low
- Heat 8/10 Severe 6 d/yr ≥102°F today · 18 d/yr by 30 yrs out
- Wind 1/10 Low
- Air quality 10/10 Extreme 27 unhealthy d/yr today · 32 by 30 yrs out
Nearby sold comps map
Loading sold comps map…
Walkable amenities ~0.75 mi
Loading nearby amenities…
Taxation est. · year 1
- Rental income
- $30,370
- − Mortgage interest
- −$10,083
- − Property taxes
- −$2,700
- − Insurance
- −$900
- − Repairs & maintenance
- −$2,430
- − Management
- −$2,430
- − Depreciation
- −$5,236
- Taxable income
- $6,592
- Est. tax owed @ 24.0%
- −$1,582
- After-tax cash flow
- $7,483/yr
For passive investors: Depreciation is non-cash, so a rental often shows a tax loss while cash-flowing — sheltering income. Rental losses are passive: they offset passive income freely, and up to $25,000/yr can offset ordinary (W-2) income if you actively participate and your MAGI is under $100k (phasing out to $0 by $150k); unused losses carry forward. On sale, claimed depreciation is recaptured at up to 25%, and gains may owe capital-gains tax (a 1031 exchange can defer both). Figures are a year-1 estimate at your 24.0% rate — not tax advice; consult a CPA.
Schools (NCES district)
- District
- Rialto Unified
- NCES district ID
- 0632370
- Math proficiency
- 25% ▲ 3.00%
- Reading proficiency
- 46% ▲ 10.00%
- Median HH income
- $50,916
- Composite
- 30.77/100
- National rank
- #6154
- State rank
- #268 of 517 in CA
Livability — Rialto
- Score
- 60/100
- State rank
- #598
- US rank
- #19283
Category grades
Schools grade is shown separately in the Schools card above.
Census & demographics
- Census place
- Rialto, CA
- County
- San Bernardino County · 2,030,291 people
- City population
- 105,208
- Metro
- Riverside-San Bernardino-Ontario, CA
- Population (ZIP)
- 84,394
- Household income
- $79,675
- Rent vs Own
- Severe rent burden
- 2574.0
Population outlook (San Bernardino County) Hauer SSP2
- Today (2025)
- 2,300,329 people
- By 2030
- 2,378,907 · +3.4%
- By 2040
- 2,523,137 · +9.7%
- By 2050
- 2,642,388 · +14.9%
- By 2075
- 2,880,769 · +25.2%
- By 2100
- 2,909,436 · +26.5%
Race, ethnicity, and origin ACS 2023
- Neighborhood character
- Predominantly Hispanic (78%)
- Race & ethnicity
- Hispanic / Latino 78% Two or more races 22% Black 11% White 7% Asian 2% Native American 1%
- Hispanic origin (detail)
- Mexican 68%
- Foreign-born
- 27% · Canada, Jamaica
- Languages at home
- 36% English-only · Spanish 61% Arabic 1% Tagalog/Filipino 1%
Political lean MEDSL · San Bernardino
- 2024 margin
- Toss-up / Even · D 47.5% · R 49.7% · Other 2.8%
- 2008→2024 swing
- -8.5pp toward R · 2008: 6.3pp · 2024: -2.1pp
- All cycles
- 2024: R+2.1 2020: D+10.7 2016: D+9.8 2012: D+5.4 2008: D+6.3
Not yet ingested
- Civics
- —
Market trends
- HPI YoY
- ▼ -323.82%
- Current HPI
- 505.95
- Rent YoY
- ▲ 1.59%
- Metro
- Riverside-San Bernardino-Ontario, CA
- State GDP YoY
- ▲ 3.21%
- F500 in state
- 116
Industry mix (Fortune 500 HQ in CA)
| Industry | F500 HQs | Revenue |
|---|---|---|
| Technology | 27 | $1,492B |
|
||
| Financial Services | 3 | $174B |
|
||
| Retail | 3 | $44B |
|
||
| Insurance | 3 | $26B |
|
||
| Media / Entertainment | 2 | $115B |
|
||
| Pharmaceuticals / Biotech | 2 | $62B |
|
||
Price history
1 event — show timeline
- 2026-05-26 Listed $180,000 CRMLS
Property tax history
+0.1%/yrLatest (2025): $80 · +1.8% YoY. Source: county tax records.
Cash-flow waterfall
monthlySold comps — $/sqft
last 12 mo · ≤1 miLoading sold comps…