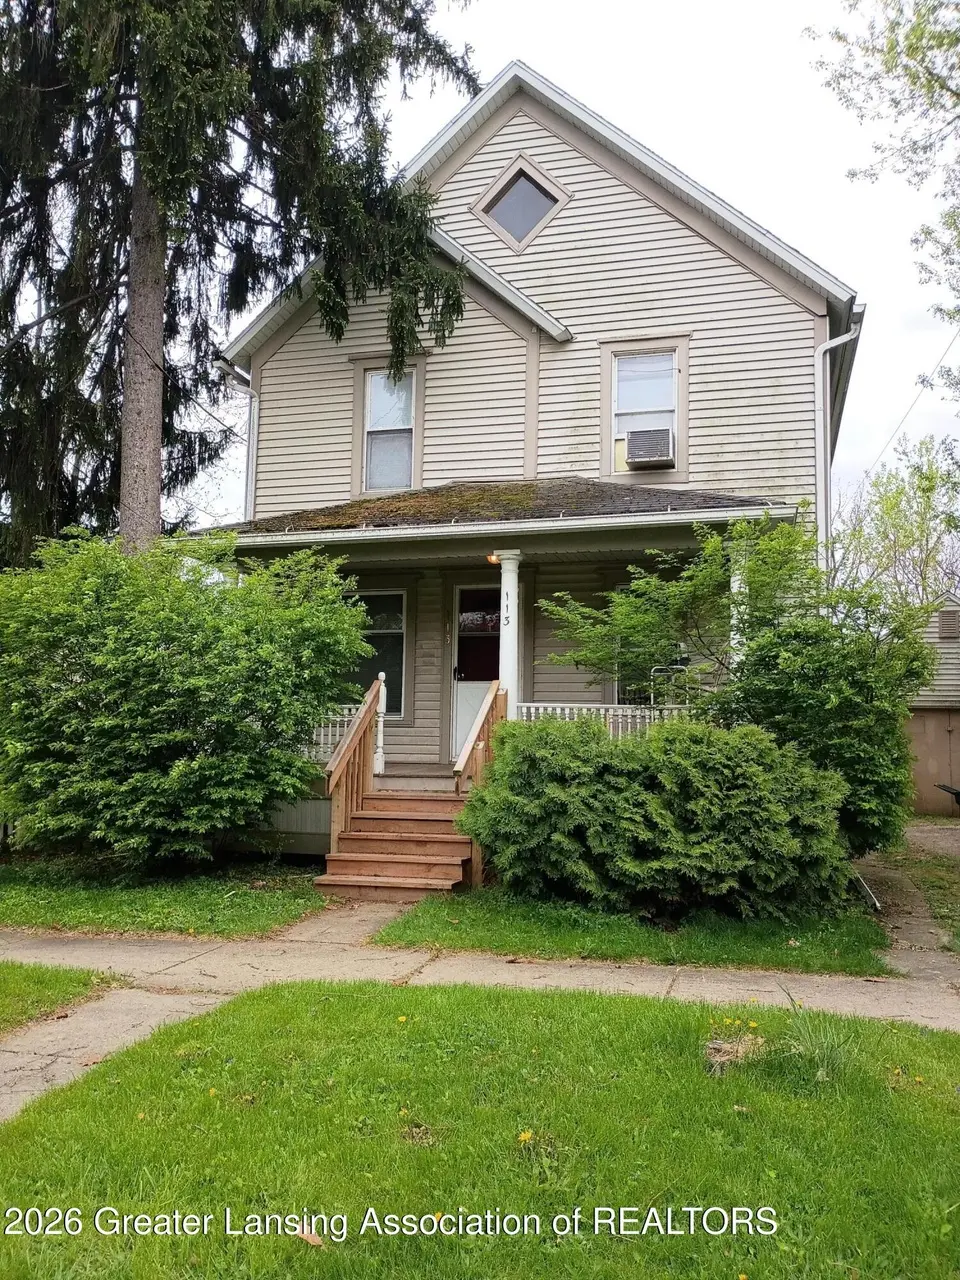
113 W Willow St · Lansing, MI
Flood risk 9/10 · Severe
- FEMA flood zone
- AE
- Chance of flooding over 30 yrs
- 0.99%
- Est. flood insurance / yr
- $2,026 – $9,024
Fire risk 1/10 · Minimal
- Est. fire insurance / yr
- $784 – $1,456
Heat risk 3/10 · Minor
- Hot days now (above 97°F)
- 7 days/yr
- Hot days in 30 yrs
- 16 days/yr
Wind risk 2/10 · Minimal
- Chance of severe wind over 30 yrs
- —
Air-quality risk 2/10 · Minimal
- Unhealthy air days now
- 1 days/yr
- Unhealthy air days in 30 yrs
- 2 days/yr
Risk factors via First Street. Map © Google.
Why this score? — see what drove the B+ grade
The composite is a weighted blend of 9 inputs, each scored 0–100. Each bar is that input's sub-score; the figure is the points it added to the 100-point composite (weight × sub-score).
- Cash flow +30.0/30.0
- ARV discount +15.0/15.0
- 1% rule +10.0/10.0
- DSCR +10.0/10.0
- Rent growth +5.0/5.0
- Livability +4.0/5.0
- Condition / age +2.5/5.0
- Schools +1.9/10.0
- Appreciation +0.0/10.0
$80,000
🖨 Deal sheet (PDF) 📄 Offer letter ✓ Due diligence
Listing remarks MLS
Great investment opportunity nestled in the heart of Old Town! This two-story Craftsman-style home offers an inviting layout with plenty of potential. The second floor features three bedrooms along with an additional open living space; ideal for a home office, reading nook, or play area. The garage has been converted into a functional workshop, adding extra versatility. Convenient first-floor laundry adds to the home's practicality. Located within walking distance to Old Town and the river trail, and just minutes from LCC and MSU, this property offers both charm and a prime location. Property is being sold as is with all contents.
Key facts
- 3,049 sq ft lot
- Built 1908
- Listed 8 days
Property features AI
Exterior
- Parking: Driveway (no attached garage)
- Utilities: Public sewer
- Home design: Two-story home; Built in 1908; City street frontage
- Construction: Vinyl siding; Shingle roof
- Exterior features: Back yard; City lot; Porch; Fenced backyard; Workshop (outbuilding)
Interior
- Kitchen: Kitchen (located on main level)
- Bedrooms: 3 bedrooms (Primary bedroom plus two additional bedrooms)
- Flooring: Carpet; Hardwood; Linoleum
- Bathrooms: 1 full bathroom
- Heating & cooling: Forced air heating; No central cooling
- Interior features: Carpet, hardwood and linoleum flooring; Basement (Michigan)
- Laundry & utility: Laundry area in kitchen
Neighborhood map
What this means for you Summary
Snapshot
- This is a 3-bed/1.0-bath single-family listed at $80k.
Deal economics
- At list price, monthly cash flow is $93 ($1k/yr) — positive.
- The deal already cash-flows at list — no discount required.
- Meets the 1% rule at list price ($1k rent vs $80k).
- Cap rate 14.6% vs local median 6.0% in Lansing — top-decile yield for the area; either an underpriced asset or a hidden risk that comps aren't pricing in. Stress-test before assuming the spread holds.
Location & tenants
- Location reads 79/100 on livability (#94 in MI, #2,182 nationally) — a middle-class / working-renter tenant base. Strengths: amenities A+, commute A+, cost of living A+; Watch: employment D, schools F, crime F.
- Lansing Public School District (urban): math 14% / reading 23% proficiency, ranked #650 of 760 in MI (top 86%) — low school quality limits family demand, transient renter base, plan for 1-2y turnover; 68% free/reduced lunch — lower-income household profile, screen leases tightly.
- Market conditions: Rents rising fast (+10.5%/yr); 138 active listings in the ZIP; 16 comparable units currently listed for rent nearby; rentals lingering (median 44d on market — plan ~5-8 weeks vacancy on turnover, expect pricing pressure); 56% of comp listings sitting > 30 days — soft ceiling on asking rent; 350 units permitted in Ingham County in 2024 (186 in 5+ unit buildings).
Forward outlook
- Local home prices are declining (-3.0%/yr); year-one equity from $553 of loan paydown is wiped out by about $2k of value loss. Plan a longer hold.
- Ingham County population projected at +11% by 2050 — modest demand growth; plan on rents tracking national, not racing it.
- At projected returns (-3.0% appreciation + 8.0% rent growth), your $22k cash investment doubles in ~8 years — after that, you're playing with house money.
Negotiation context
- Only 8 days on market — expect competitive offers; lowballing is unlikely to land.
- 2 sale attempts with the ask held roughly flat each time — persistent listings suggest the price (not the market) is what's stuck; bring a comps-based counter.
Risks & watch-outs
- Watch-outs: flood insurance adds $460/mo; built in 1908 — expect roof / HVAC / electrical / plumbing capex.
- Climate carrying-cost: in FEMA flood zone AE (mandatory federal flood insurance) — expect insurance premiums to compound above CPI over the hold.
Questions for the listing agent
- Built in 1908 — when were the roof, HVAC, electrical panel, plumbing, and water heater last replaced?
- What's the actual annual flood-insurance premium (NFIP or private), and is the property in a SFHA with mandatory coverage?
- Is there a deadline driving the sale (1031 exchange, divorce, estate, relocation)? That informs how much negotiation room exists.
- Schools are F-rated, which usually means shorter tenancies and higher turnover. Who's the typical renter profile here, and what's been the actual vacancy rate?
- Crime grade is F in this area — have there been break-ins, vandalism, or insurance claims at this property in the last 3 years? What carrier currently insures it and at what premium?
- What's the average days-on-market for RENTAL listings here right now (not sales)? A rising rental-DOM trend means longer vacancies and softer asking-rent achievability than the comps imply.
- What's the recent tenant-quality profile in this submarket — average credit score on applications, eviction rate, late-payment / NSF rate, and stable-employment percentage? A property-management company in the area should have these aggregated.
- How much new for-sale + rental construction is in the pipeline within 1–3 miles? Heavy new supply typically softens prices + rents 12–24 months out; constrained supply supports both.
Investment metrics
- 1% rule
- 1.84% ✓
- Cap rate
- 14.60%
- Cash-on-cash
- 29.67%
- DSCR
- 2.32
- GRM
- 4.5
CMA / ARV
- ARV (median comp)
- $111,329
- List price
- $80,000
- Delta
- -28.14%
- Verdict
- UNDERPRICED
- Comps
- 20 within 1.0 mi
Show comp detail 12 sales within ~0.75 mi
| Address | Dist | Beds/Ba | Sqft | Sold | Price | $/sf | Match |
|---|---|---|---|---|---|---|---|
| 113 W Willow St | 0.00mi | 3/1.0 | 1,287 (0%) | 0mo | $85,000 | $66 | 100 |
| 1506 James St | 0.19mi | 3/1.0 | 1,228 (-5%) | 6mo | $195,000 | $159 | 78 |
| 908 N Walnut St | 0.37mi | 4/1.5 (+1) | 1,248 (-3%) | 1mo | $125,000 | $100 | 70 |
| 905 N Sycamore St | 0.56mi | 3/1.5 | 1,368 (+6%) | 0mo | $130,000 | $95 | 61 |
| 612 N Pine St | 0.66mi | 3/1.0 | 1,241 (-4%) | 6mo | $134,900 | $109 | 58 |
| 200 Mosley Ave | 0.56mi | 3/2.0 | 1,380 (+7%) | 1mo | $157,500 | $114 | 57 |
| 806 Princeton Ave | 0.74mi | 3/1.0 | 1,344 (+4%) | 6mo | $60,000 | $45 | 53 |
| 624 Brook St | 0.47mi | 3/1.5 | 1,144 (-11%) | 6mo | $120,000 | $105 | 52 |
| 921 N Sycamore St | 0.54mi | 3/1.0 | 1,460 (+13%) | 3mo | $99,900 | $68 | 50 |
| 1043 Ontario St | 0.75mi | 3/1.0 | 1,152 (-10%) | 2mo | $54,900 | $48 | 46 |
| 1941 Polly Ave | 0.57mi | 2/1.0 (-1) | 1,474 (+14%) | 4mo | $38,500 | $26 | 41 |
| 919 Princeton Ave | 0.73mi | 3/1.5 | 1,119 (-13%) | 2mo | $60,000 | $54 | 41 |
Match score weights: distance 35% · size 25% · config 20% · recency 20%. Top-matched comps best support the ARV.
Projected returns pro-forma
-3.0% appreciation · 8.0% rent growth · sell at horizon
- IRR
- 1.2%
- Equity multiple
- 1.05×
- Total profit
- $1,100
- Equity at exit
- $11,928
- IRR
- 17.6%
- Equity multiple
- 3.03×
- Total profit
- $45,389
- Equity at exit
- $6,917
Cash invested: $22,400 (down + closing). Projections, not guarantees.
Landlord ↔ Tenant lean methodology
- Overall (STATE)
- 62 Landlord-Friendly
- State Michigan
- 62 Landlord-Friendly · EVEN
- County
- — inherits STATE
- City
- — inherits STATE
ZIP-level market 48906
- Rents YoY
- 10.5%
- Active inventory
- 138
- Price-to-rent
- 4.5×
Monthly cashflow live
- Estimated rent
- $1,471 high interval (Pro) →
- Mortgage (P&I)
- −$420
- Tax from tax record
- −$156 /mo · $1,869/yr
- Insurance
- −$33
- Flood insurance flood zone
- −$460 /mo · $5,525/yr
- HOA
- −$0
- Vacancy / Maint / Mgmt
- −$309
- Net cashflow
- $93
Break-even live
Sensitivity live
| Price | -10% $139 | -5% $116 | +0% $93 | +5% $71 | +10% $48 |
|---|---|---|---|---|---|
| Rent | -10% $-23 | -5% $35 | +0% $93 | +5% $152 | +10% $210 |
| Rate | -1.0pp $134 | -0.5pp $114 | base $93 | +0.5pp $73 | +1.0pp $52 |
UW: 25.0% down · 7.5% · 30yr · 1.5% tax · 5.0% vac · 8.0% maint · 8.0% mgmt
Financing live
Cash to close
- Down payment
- $20,000
- Closing costs
- $2,400
- Reserves months
- —
- Total cash needed
- —
Loan-product check · same deal, 3 products live
Conventional
25% down · 7.5% · 30yr
- Down + closing
- —
- Monthly P&I
- —
- Monthly cashflow
- —
- DSCR
- —
- Eligible?
- —
Personal DTI + credit; lowest rate.
DSCR
20% down · 8.5% · 30yr
- Down + closing
- —
- Monthly P&I
- —
- Monthly cashflow
- —
- DSCR
- —
- Eligible?
- —
No personal income docs; deal must DSCR.
Hard money
10% down · 12.0% · 12mo
- Down + closing
- —
- Monthly P&I
- —
- Monthly cashflow
- —
- DSCR
- —
- Eligible?
- —
Short-term bridge; refi at stabilization.
Rent comps 16 comps
| Address | Beds | Baths | Sqft | Rent | $/sqft | DOM | Units | Dist |
|---|---|---|---|---|---|---|---|---|
| 832 N Larch St Apt 3 Lansing, MI | 2.0 | 1.0 | 890 | $1,095 | $1.23 | 44d | 1 | 0.59mi |
| 731 N Sycamore St Unit 1 Lansing, MI | 2.0 | 1.0 | 950 | $945 | $0.99 | 44d | 1 | 0.67mi |
| 712 N Sycamore St Lansing, MI | 3.0 | 1.0 | 1100 | $1,650 | $1.50 | 21d | 1 | 0.68mi |
| 1012 Ontario St Lansing, MI | 4.0 | 2.0 | 1320 | $1,600 | $1.21 | 21d | 1 | 0.68mi |
| 620 May St Lansing, MI | 1.0–2.0 | 1.0–2.0 | 1126 | $1,578 | $1.40 | 14d | 12 | 0.68mi |
| 524 N Walnut St Lansing, MI | 2.0 | 1.0 | 1000 | $1,150 | $1.15 | 44d | 1 | 0.68mi |
| 919 Princeton Ave Lansing, MI | 3.0 | 1.5 | 1119 | $1,475 | $1.32 | 21d | 1 | 0.74mi |
| 433 Seymour Ave Unit 3 Lansing, MI | 3.0 | 1.0 | 1250 | $1,395 | $1.12 | 44d | 1 | 0.75mi |
| 1561 Massachusetts Ave Lansing, MI | 3.0 | 2.0 | 1100 | $1,400 | $1.27 | 44d | 1 | 0.88mi |
| 921 Linden Grove Ave Lansing, MI | 3.0 | 1.0 | 1694 | $1,499 | $0.88 | 44d | 1 | 1.00mi |
| 1102 Clark St Lansing, MI | 3.0 | 1.0 | 1232 | $1,550 | $1.26 | 21d | 1 | 1.10mi |
| 113 Pere Marquette Dr Lansing, MI | 1.0–2.0 | 1.0–2.0 | 1065 | $2,250 | $2.11 | 14d | 9 | 1.13mi |
| 401 S Washington Sq Unit 201 Lansing, MI | 3.0 | 1.0 | 1254 | $1,560 | $1.24 | 44d | 1 | 1.34mi |
| 401 S Washington Sq Unit 205 Lansing, MI | 2.0 | 1.0 | 968 | $1,355 | $1.40 | 44d | 1 | 1.34mi |
| 208 S Bingham St Lansing, MI | 4.0 | 1.0 | 1020 | $1,500 | $1.47 | 14d | 1 | 1.44mi |
| 1715 Peppertree Ln Lansing, MI | 2.0–3.0 | 1.5 | 1120 | $1,595 | $1.42 | 44d | 2 | 1.49mi |
Listing history 7 events
-
2026-05-13status Pending 638-char remark
Show marketing remark (638 chars)
Great investment opportunity nestled in the heart of Old Town! This two-story Craftsman-style home offers an inviting layout with plenty of potential. The second floor features three bedrooms along with an additional open living space; ideal for a home office, reading nook, or play area. The garage has been converted into a functional workshop, adding extra versatility. Convenient first-floor laundry adds to the home's practicality. Located within walking distance to Old Town and the river trail, and just minutes from LCC and MSU, this property offers both charm and a prime location. Property is being sold as is with all contents.
-
2026-05-13status Pending 641-char remark
Show marketing remark (638 chars)
Great investment opportunity nestled in the heart of Old Town! This two-story Craftsman-style home offers an inviting layout with plenty of potential. The second floor features three bedrooms along with an additional open living space; ideal for a home office, reading nook, or play area. The garage has been converted into a functional workshop, adding extra versatility. Convenient first-floor laundry adds to the home's practicality. Located within walking distance to Old Town and the river trail, and just minutes from LCC and MSU, this property offers both charm and a prime location. Property is being sold as is with all contents.
-
2026-05-08historical Active Under Contract 638-char remark
Show marketing remark (638 chars)
Great investment opportunity nestled in the heart of Old Town! This two-story Craftsman-style home offers an inviting layout with plenty of potential. The second floor features three bedrooms along with an additional open living space; ideal for a home office, reading nook, or play area. The garage has been converted into a functional workshop, adding extra versatility. Convenient first-floor laundry adds to the home's practicality. Located within walking distance to Old Town and the river trail, and just minutes from LCC and MSU, this property offers both charm and a prime location. Property is being sold as is with all contents.
-
2026-05-08historical Active Under Contract 641-char remark
Show marketing remark (638 chars)
Great investment opportunity nestled in the heart of Old Town! This two-story Craftsman-style home offers an inviting layout with plenty of potential. The second floor features three bedrooms along with an additional open living space; ideal for a home office, reading nook, or play area. The garage has been converted into a functional workshop, adding extra versatility. Convenient first-floor laundry adds to the home's practicality. Located within walking distance to Old Town and the river trail, and just minutes from LCC and MSU, this property offers both charm and a prime location. Property is being sold as is with all contents.
-
2026-05-05$80,000 Active 638-char remark
Show marketing remark (638 chars)
Great investment opportunity nestled in the heart of Old Town! This two-story Craftsman-style home offers an inviting layout with plenty of potential. The second floor features three bedrooms along with an additional open living space; ideal for a home office, reading nook, or play area. The garage has been converted into a functional workshop, adding extra versatility. Convenient first-floor laundry adds to the home's practicality. Located within walking distance to Old Town and the river trail, and just minutes from LCC and MSU, this property offers both charm and a prime location. Property is being sold as is with all contents.
-
2026-05-05$80,000 Active 641-char remark
Show marketing remark (638 chars)
Great investment opportunity nestled in the heart of Old Town! This two-story Craftsman-style home offers an inviting layout with plenty of potential. The second floor features three bedrooms along with an additional open living space; ideal for a home office, reading nook, or play area. The garage has been converted into a functional workshop, adding extra versatility. Convenient first-floor laundry adds to the home's practicality. Located within walking distance to Old Town and the river trail, and just minutes from LCC and MSU, this property offers both charm and a prime location. Property is being sold as is with all contents.
-
2026-04-29historical $80,000 641-char remark
ⓘ Source: listings_history table (triggers on properties + properties_extension) + one-shot
backfill from property_details.listing_events for pre-trigger history.
Tax reassessment forecast MI · Partial reset (capped growth)
- Current annual tax
- $1,869 · $156/mo
- Projected year-2 tax
- $1,869 · $156/mo
- Expected delta
- $0/yr ($0/mo · 0.0%)
ⓘ Screening estimate from a state-policy table — verify with the county assessor before closing.
Climate risk First Street
- Flood 9/10 Extreme FEMA zone AE · 99% chance over 30 yrs
- Wildfire 1/10 Low
- Heat 3/10 Moderate 7 d/yr ≥97°F today · 16 d/yr by 30 yrs out
- Wind 2/10 Low
- Air quality 2/10 Low 1 unhealthy d/yr today · 2 by 30 yrs out
Nearby sold comps map
Loading sold comps map…
Walkable amenities ~0.75 mi
Loading nearby amenities…
Taxation est. · year 1
- Rental income
- $17,657
- − Mortgage interest
- −$4,481
- − Property taxes
- −$1,869
- − Insurance
- −$5,925
- − Repairs & maintenance
- −$1,413
- − Management
- −$1,413
- − Depreciation
- −$2,327
- Taxable income
- $229
- Est. tax owed @ 24.0%
- −$55
- After-tax cash flow
- $1,066/yr
For passive investors: Depreciation is non-cash, so a rental often shows a tax loss while cash-flowing — sheltering income. Rental losses are passive: they offset passive income freely, and up to $25,000/yr can offset ordinary (W-2) income if you actively participate and your MAGI is under $100k (phasing out to $0 by $150k); unused losses carry forward. On sale, claimed depreciation is recaptured at up to 25%, and gains may owe capital-gains tax (a 1031 exchange can defer both). Figures are a year-1 estimate at your 24.0% rate — not tax advice; consult a CPA.
Schools (NCES district)
- District
- Lansing Public School District
- NCES district ID
- 2621150
- Math proficiency
- 14% ▲ 1.00%
- Reading proficiency
- 23% ▲ 3.00%
- Median HH income
- $37,453
- Composite
- 18.76/100
- National rank
- #14002
- State rank
- #650 of 760 in MI
Livability — Lansing
- Score
- 79/100
- State rank
- #94
- US rank
- #2182
Category grades
Schools grade is shown separately in the Schools card above.
Census & demographics
- Census place
- Lansing, MI
- County
- Ingham County · 237,052 people
- City population
- 161,269
- Metro
- Lansing-East Lansing, MI
- Population (ZIP)
- 25,901
- Household income
- $64,315
- Rent vs Own
- Severe rent burden
- 851.0
Population outlook (Ingham County) Hauer SSP2
- Today (2025)
- 300,362 people
- By 2030
- 307,808 · +2.5%
- By 2040
- 320,492 · +6.7%
- By 2050
- 333,223 · +10.9%
- By 2075
- 373,693 · +24.4%
- By 2100
- 392,021 · +30.5%
Race, ethnicity, and origin ACS 2023
- Neighborhood character
- Diverse neighborhood (Simpson 0.56)
- Race & ethnicity
- White 64% Black 15% Two or more races 12% Hispanic / Latino 12% Asian 2%
- Hispanic origin (detail)
- Mexican 9%
- Common ancestry
- Romanian 3% Lithuanian 2% Iranian 2%
- Foreign-born
- 6% · Canada, China
- Languages at home
- 88% English-only · Spanish 5% Other Asian/Pacific 1% French/Haitian/Cajun 1%
Political lean MEDSL · Ingham
- 2024 margin
- Strong D (+29.7) · D 63.9% · R 34.2% · Other 2.0%
- 2008→2024 swing
- -3.6pp toward R · 2008: 33.3pp · 2024: 29.7pp
- All cycles
- 2024: D+29.7 2020: D+32.2 2016: D+27.6 2012: D+27.9 2008: D+33.3
Not yet ingested
- Civics
- —
Market trends
- HPI YoY
- ▼ -135.54%
- Current HPI
- 228.7023
- Rent YoY
- ▲ 10.50%
- Metro
- Lansing-East Lansing, MI
- State GDP YoY
- ▲ 1.37%
- F500 in state
- 28
Industry mix (Fortune 500 HQ in MI)
| Industry | F500 HQs | Revenue |
|---|---|---|
| Automotive Parts | 3 | $48B |
|
||
| Automotive | 2 | $372B |
|
||
| Chemicals | 1 | $45B |
|
||
| Automotive Retail | 1 | $29B |
|
||
| Healthcare / Medical Devices | 1 | $23B |
|
||
| Automotive Technology | 1 | $20B |
|
||
Price history
+6.2% since first listed9 events — show timeline
- 2026-06-05 Sold (MLS) $85,000 REALCOMP
- 2026-06-05 Sold (MLS) $85,000 Greater Lansing AoR
- 2026-05-13 Pending — REALCOMP
- 2026-05-13 Pending — Greater Lansing AoR
- 2026-05-08 Contingent — REALCOMP
- 2026-05-08 Contingent — Greater Lansing AoR
- 2026-05-05 Listed $80,000 REALCOMP
- 2026-05-05 Listed $80,000 Greater Lansing AoR
- 2026-04-29 Coming Soon $80,000 Greater Lansing AoR
Property tax history
+3.9%/yrLatest (2025): $1,869 · +2.9% YoY. Source: county tax records.
Cash-flow waterfall
monthlySold comps — $/sqft
last 12 mo · ≤1 miLoading sold comps…