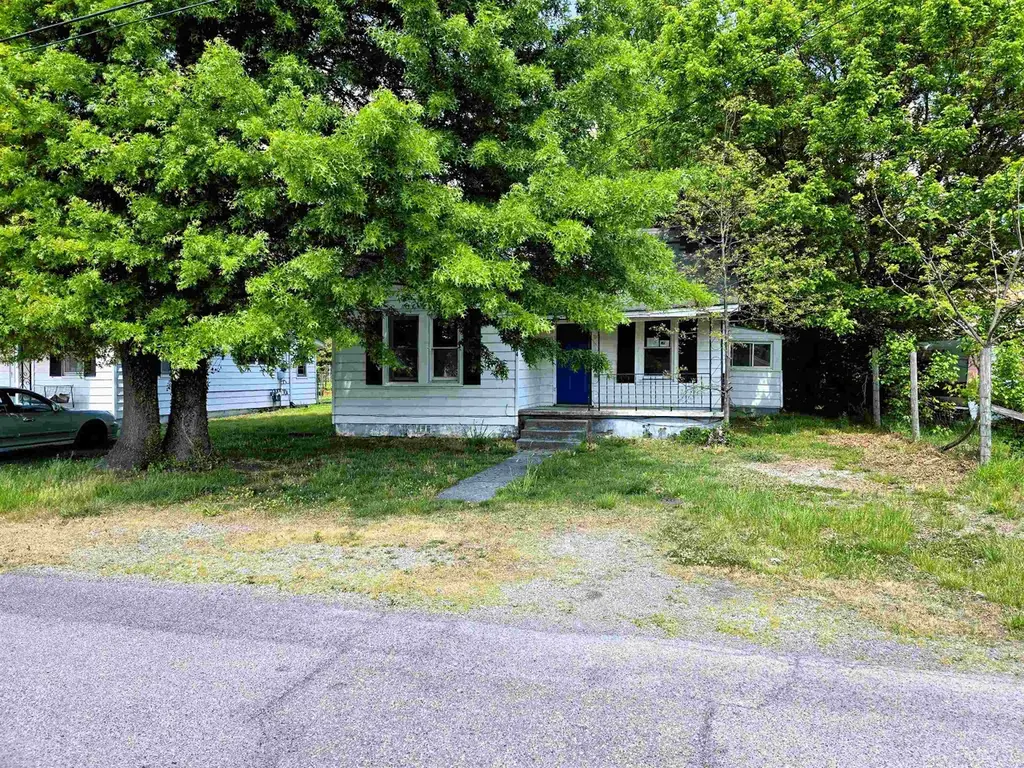
1104 West St · Radford, VA
Flood risk 1/10 · Minimal
- FEMA flood zone
- X (unshaded)
- Chance of flooding over 30 yrs
- 0.0%
- Est. flood insurance / yr
- $507 – $1,088
Fire risk 1/10 · Minimal
- Est. fire insurance / yr
- $666 – $1,236
Heat risk 4/10 · Minor
- Hot days now (above 95°F)
- 8 days/yr
- Hot days in 30 yrs
- 22 days/yr
Wind risk 2/10 · Minimal
- Chance of severe wind over 30 yrs
- 1.0%
Air-quality risk 1/10 · Minimal
- Unhealthy air days now
- 0 days/yr
- Unhealthy air days in 30 yrs
- 0 days/yr
Risk factors via First Street. Map © Google.
Why this score? — see what drove the B grade
The composite is a weighted blend of 9 inputs, each scored 0–100. Each bar is that input's sub-score; the figure is the points it added to the 100-point composite (weight × sub-score).
- Cash flow +29.7/30.0
- DSCR +10.0/10.0
- 1% rule +7.9/10.0
- ARV discount +7.5/15.0
- Schools +5.9/10.0
- Rent growth +4.2/5.0
- Livability +3.4/5.0
- Condition / age +2.5/5.0
- Appreciation +0.0/10.0
$85,000
🖨 Deal sheet 📄 Offer letter ✓ Due diligence
Listing remarks
Conveniently located near downtown Radford. Walking distance to restaurants and shopping. Bring your tools and make this house your home. Large fenced in yard. Home features two bedrooms and one bath.
Key facts
- Large fenced in yard
- 8,276 sq ft lot
- Built 1960
Tags
Property features AI
Finance
- Other: Lot size approximately 0.19 acres
- Financial info: Annual tax amount listed (amount not included per instructions)
- HOA & community: No HOA information provided
Exterior
- Parking: Gravel parking
- Security: No security features provided
- Utilities: Public water; Public sewer
- Home design: Single-family detached residence; One-story
- Construction: Aluminum siding; Above-grade living area approximately 1,012; Built on one level
- Exterior features: Front porch; Fenced yard
Interior
- Kitchen: No specific kitchen appliance details provided
- Bedrooms: 5 total rooms (bedroom count not specified)
- Flooring: No flooring details provided
- Bathrooms: 1 full bathroom
- Heating & cooling: Heat pump heating
- Interior features: Electric water heater; Crawl space basement
- Laundry & utility: No laundry appliance details provided
Neighborhood map
What this means for you Summary
Snapshot
- This is a 2-bed/1.0-bath single-family listed at $85k.
Deal economics
- At list price, monthly cash flow is $309 ($4k/yr) — positive.
- The deal already cash-flows at list — no discount required.
- Meets the 1% rule at list price ($1k rent vs $85k).
- Recommended offer: $82k (3.0% below list) — sets the bar for market timing.
- Cap rate 10.7% vs local median 3.6% in Radford — top-decile yield for the area; either an underpriced asset or a hidden risk that comps aren't pricing in. Stress-test before assuming the spread holds.
Location & tenants
- Location reads 68/100 on livability (#269 in VA) — a middle-class / working-renter tenant base. Strengths: cost of living A+, crime A-, health & safety B+; Watch: amenities F, commute F, employment F.
- Radford City Public School District (urban): math 66% / reading 78% proficiency, ranked #26 of 131 in VA (top 20%) — strong family-tenant draw, lease renewals of 3-5y typical.
- Zoned schools: John N. Dalton Intermediate (math 61% / reading 77%, grade A, #89 of 342 statewide, top 26%, 235 students, 66% FRL); Radford High (math 52% / reading 87%, grade B, #159 of 319 statewide, top 53%, 504 students, 42% FRL) — zoned schools average 54% FRL vs 38% district-wide (16 pts higher); higher-poverty schools than district average — tighter screening recommended.
- Market conditions: Rents rising fast (+6.6%/yr); 150 active listings in the ZIP; 4 comparable units currently listed for rent nearby; rentals lingering (median 44d on market — plan ~5-8 weeks vacancy on turnover, expect pricing pressure); 100% of comp listings sitting > 30 days — soft ceiling on asking rent; 28 units permitted in Radford city in 2024 (0 in 5+ unit buildings).
Forward outlook
- Local home prices are declining (-3.0%/yr); year-one equity from $588 of loan paydown is wiped out by about $3k of value loss. Plan a longer hold.
- Radford County population projected at +32% by 2050 — long-run rental-demand tailwind backs the buy-and-hold thesis.
- At projected returns (-3.0% appreciation + 6.6% rent growth), your $24k cash investment doubles in ~7 years — after that, you're playing with house money.
Negotiation context
- It's been on market 50 days — a 3% lower offer ($82k) is reasonable based on typical stale-listing flexibility.
- 4 sale attempts since 12y ago with the ask held roughly flat each time — persistent listings suggest the price (not the market) is what's stuck; bring a comps-based counter.
- Current owner paid $69k; 23% above their basis — modest negotiation headroom, anchor on the comps not their cost.
Questions for the listing agent
- It's been on market 50 days. Have you received any prior offers? Is the seller open to a 3% concession, seller financing, or rate buy-down credit?
- Built in 1960 — when were the roof, HVAC, electrical panel, plumbing, and water heater last replaced?
- Is there a deadline driving the sale (1031 exchange, divorce, estate, relocation)? That informs how much negotiation room exists.
- Schools are A-rated — typically a magnet for longer-tenancy family renters. What's the average tenant stay here, and is there a school-zone premium baked into asking?
- What's the average days-on-market for RENTAL listings here right now (not sales)? A rising rental-DOM trend means longer vacancies and softer asking-rent achievability than the comps imply.
- What's the recent tenant-quality profile in this submarket — average credit score on applications, eviction rate, late-payment / NSF rate, and stable-employment percentage? A property-management company in the area should have these aggregated.
- How much new for-sale + rental construction is in the pipeline within 1–3 miles? Heavy new supply typically softens prices + rents 12–24 months out; constrained supply supports both.
Investment metrics
- 1% rule
- 1.29% ✓
- Cap rate
- 10.66%
- Cash-on-cash
- 15.60%
- DSCR
- 1.69
- GRM
- 6.5
CMA / ARV
- ARV (median comp)
- $198,251
- List price
- $85,000
- Delta
- -57.13%
- Verdict
- UNDERPRICED
- Comps
- 20 within 1.0 mi
Show comp detail 3 sales within ~0.75 mi
| Address | Dist | Beds/Ba | Sqft | Sold | Price | $/sf | Match |
|---|---|---|---|---|---|---|---|
| 1106 Stockton St | 0.08mi | 3/1.5 (+1) | 1,008 (-0%) | 14mo | $177,500 | $176 | 77 |
| 7621 Brooklyn Rd | 0.74mi | 3/2.0 (+1) | 1,136 (+12%) | 3mo | $273,000 | $240 | 34 |
| 203 Baldwin St | 0.70mi | 3/1.0 (+1) | 939 (-7%) | 24mo | $125,000 | $133 | 30 |
Match score weights: distance 35% · size 25% · config 20% · recency 20%. Top-matched comps best support the ARV.
Projected returns pro-forma
-3.0% appreciation · 6.63% rent growth · sell at horizon
- IRR
- 10.3%
- Equity multiple
- 1.42×
- Total profit
- $10,070
- Equity at exit
- $12,674
- IRR
- 22.1%
- Equity multiple
- 3.20×
- Total profit
- $52,443
- Equity at exit
- $7,349
Cash invested: $23,800 (down + closing). Projections, not guarantees.
Landlord ↔ Tenant lean methodology
- Overall (STATE)
- 55 Moderately Landlord-Leaning
- State Virginia
- 55 Moderately Landlord-Leaning · D+2
- County
- — inherits STATE
- City
- — inherits STATE
ZIP-level market 24141
- Home prices YoY
- -26.2%
- Rents YoY
- 6.6%
- Active inventory
- 150
- Price-to-rent
- 6.5×
Monthly cashflow live
- Estimated rent
- $1,094 medium interval (Pro) →
- Mortgage (P&I)
- −$446
- Tax from tax record
- −$74 /mo · $886/yr
- Insurance
- −$35
- HOA
- −$0
- Vacancy / Maint / Mgmt
- −$230
- Net cashflow
- $309
Break-even live
UW: 25.0% down · 7.5% · 30yr · 1.5% tax · 5.0% vac · 8.0% maint · 8.0% mgmt
Financing live
Cash to close
- Down payment
- $21,250
- Closing costs
- $2,550
- Reserves months
- —
- Total cash needed
- —
Loan-product check · same deal, 3 products live
Conventional
25% down · 7.5% · 30yr
- Down + closing
- —
- Monthly P&I
- —
- Monthly cashflow
- —
- DSCR
- —
- Eligible?
- —
Personal DTI + credit; lowest rate.
DSCR
20% down · 8.5% · 30yr
- Down + closing
- —
- Monthly P&I
- —
- Monthly cashflow
- —
- DSCR
- —
- Eligible?
- —
No personal income docs; deal must DSCR.
Hard money
10% down · 12.0% · 12mo
- Down + closing
- —
- Monthly P&I
- —
- Monthly cashflow
- —
- DSCR
- —
- Eligible?
- —
Short-term bridge; refi at stabilization.
Rent comps 4 comps
| Address | Beds | Baths | Sqft | Rent | $/sqft | DOM | Units | Dist |
|---|---|---|---|---|---|---|---|---|
| 1110 Calhoun St Unit I Radford, VA | 2.0 | 1.0 | 834 | $950 | $1.14 | 43d | 1 | 0.43mi |
| 7486 Lee Hwy Radford, VA | 1.0 | 1.0 | 780 | $1,366 | $1.75 | 43d | 1 | 1.30mi |
| 101 Ridgewood Ln Radford, VA | 2.0–3.0 | 1.0–2.0 | 1188 | $999 | $0.84 | 43d | 1 | 1.47mi |
| 222 Allen Ave Radford, VA | 1.0–3.0 | 1.0–1.5 | 875 | $950 | $1.09 | 43d | 5 | 1.49mi |
Listing history 21 events
-
2026-06-19days on market $85,000 Active 50 DOM
-
2026-06-18days on market $85,000 Active 49 DOM
-
2026-06-17days on market $85,000 Active 48 DOM
-
2026-06-16days on market $85,000 Active 47 DOM
-
2026-06-15days on market $85,000 Active 46 DOM
-
2026-06-14days on market $85,000 Active 44 DOM
-
2026-06-13days on market $85,000 Active 43 DOM
-
2026-06-10days on market $85,000 Active 41 DOM
-
2026-06-09days on market $85,000 Active 40 DOM
-
2026-06-08days on market $85,000 Active 39 DOM
-
2026-06-07days on market $85,000 Active 38 DOM
-
2026-06-03days on market $85,000 Active 34 DOM
-
2026-06-02days on market $85,000 Active 33 DOM
-
2026-06-01days on market $85,000 Active 32 DOM
-
2026-05-31days on market $85,000 Active 31 DOM
-
2026-05-30days on market $85,000 Active 30 DOM
-
2026-04-30$85,000 Active 200-char remark
-
2019-10-04soldstatus $69,200
-
2019-01-17$65,500
-
2016-10-13$69,900
-
2014-03-12$74,900
ⓘ Source: listings_history table (triggers on properties + properties_extension) + one-shot
backfill from property_details.listing_events for pre-trigger history.
Tax reassessment forecast VA · Resets to sale price
- Current annual tax
- $886 · $74/mo
- Projected year-2 tax
- $886 · $74/mo
- Expected delta
- $0/yr ($0/mo · 0.0%)
ⓘ Screening estimate from a state-policy table — verify with the county assessor before closing.
Climate risk First Street
- Flood 1/10 Low FEMA zone X (unshaded) · 0% chance over 30 yrs
- Wildfire 1/10 Low
- Heat 4/10 Moderate 8 d/yr ≥95°F today · 22 d/yr by 30 yrs out
- Wind 2/10 Low 100% chance of damaging wind over 30 yrs
- Air quality 1/10 Low 0 unhealthy d/yr today · 0 by 30 yrs out
Nearby sold comps map
Loading sold comps map…
Walkable amenities ~0.75 mi
Loading nearby amenities…
Taxation est. · year 1
- Rental income
- $13,129
- − Mortgage interest
- −$4,761
- − Property taxes
- −$886
- − Insurance
- −$425
- − Repairs & maintenance
- −$1,050
- − Management
- −$1,050
- − Depreciation
- −$2,473
- Taxable income
- $2,484
- Est. tax owed @ 24.0%
- −$596
- After-tax cash flow
- $3,116/yr
For passive investors: Depreciation is non-cash, so a rental often shows a tax loss while cash-flowing — sheltering income. Rental losses are passive: they offset passive income freely, and up to $25,000/yr can offset ordinary (W-2) income if you actively participate and your MAGI is under $100k (phasing out to $0 by $150k); unused losses carry forward. On sale, claimed depreciation is recaptured at up to 25%, and gains may owe capital-gains tax (a 1031 exchange can defer both). Figures are a year-1 estimate at your 24.0% rate — not tax advice; consult a CPA.
Schools (NCES district)
- District
- Radford City Public School District
- NCES district ID
- 5103180
- Math proficiency
- 66% ▼ -22.00%
- Reading proficiency
- 78% ▼ -5.00%
- Median HH income
- $32,239
- Composite
- 59.29/100
- National rank
- #935
- State rank
- #26 of 131 in VA
Livability — Radford
- Score
- 68/100
- State rank
- #269
- US rank
- #9496
Category grades
Schools grade is shown separately in the Schools card above.
Census & demographics
- Census place
- Radford, VA
- County
- Radford City · 21,484 people
- City population
- 21,484
- Metro
- Blacksburg-Christiansburg, VA
- Population (ZIP)
- 21,484
- Household income
- $62,969
- Rent vs Own
- Severe rent burden
- 1211.0
Population outlook (Radford County) Hauer SSP2
- Today (2025)
- 21,530 people
- By 2030
- 23,199 · +7.8%
- By 2040
- 25,758 · +19.6%
- By 2050
- 28,422 · +32.0%
- By 2075
- 35,350 · +64.2%
- By 2100
- 42,449 · +97.2%
Race, ethnicity, and origin ACS 2023
- Neighborhood character
- Predominantly White (85%)
- Race & ethnicity
- White 85% Black 7% Hispanic / Latino 4% Two or more races 3% Asian 2%
- Common ancestry
- Slovak 3% Serbian 2% Romanian 1%
- Foreign-born
- 3% · Canada, Vietnam, China
- Languages at home
- 95% English-only · Spanish 2% Other Indo-European 1%
Political lean MEDSL · Radford
- 2024 margin
- Toss-up / Even · D 49.3% · R 48.8% · Other 1.9%
- 2008→2024 swing
- -8.9pp toward R · 2008: 9.4pp · 2024: 0.5pp
- All cycles
- 2024: D+0.5 2020: D+9.1 2016: D+4.7 2012: D+3.9 2008: D+9.4
Not yet ingested
- Civics
- —
Market trends
- HPI YoY
- ▼ -85.42%
- Current HPI
- 240.7418
- Rent YoY
- ▲ 6.63%
- Metro
- Blacksburg-Christiansburg, VA
- State GDP YoY
- ▲ 2.40%
- F500 in state
- 50
Industry mix (Fortune 500 HQ in VA)
| Industry | F500 HQs | Revenue |
|---|---|---|
| Aerospace / Defense | 4 | $236B |
|
||
| Technology / Defense | 3 | $32B |
|
||
| Financial Services | 2 | $176B |
|
||
| Utilities | 2 | $27B |
|
||
| Insurance | 2 | $25B |
|
||
| Technology | 2 | $15B |
|
||
Price history
+13.5% since first listed5 events — show timeline
- 2026-04-30 Listed $85,000 NRVMLS
- 2019-10-04 Sold (Public Records) $69,200 Public Records
- 2019-01-17 Listed $65,500 NRVMLS
- 2016-10-13 Listed $69,900 NRVMLS
- 2014-03-12 Listed $74,900 NRVMLS
Property tax history
+3.9%/yrLatest (2025): $886 · +18.8% YoY. Source: county tax records.
Cash-flow waterfall
monthlySold comps — $/sqft
last 12 mo · ≤1 miLoading sold comps…