5380 Mills Rd · Campbell, NY
Flood risk 1/10 · Minimal
- FEMA flood zone
- X
- Chance of flooding over 30 yrs
- 0.0%
- Est. flood insurance / yr
- $473 – $860
Fire risk 3/10 · Minor
- Est. fire insurance / yr
- $691 – $1,283
Heat risk 2/10 · Minimal
- Hot days now (above 93°F)
- 7 days/yr
- Hot days in 30 yrs
- 16 days/yr
Wind risk 1/10 · Minimal
- Chance of severe wind over 30 yrs
- —
Air-quality risk 1/10 · Minimal
- Unhealthy air days now
- 0 days/yr
- Unhealthy air days in 30 yrs
- 0 days/yr
Risk factors via First Street. Map © Google.
Why this score? — see what drove the D- grade
The composite is a weighted blend of 9 inputs, each scored 0–100. Each bar is that input's sub-score; the figure is the points it added to the 100-point composite (weight × sub-score).
- Appreciation +8.0/10.0
- ARV discount +7.5/15.0
- Cash flow +6.7/30.0
- Schools +4.5/10.0
- Livability +3.1/5.0
- Rent growth +2.5/5.0
- Condition / age +2.5/5.0
- 1% rule +1.7/10.0
- DSCR +0.9/10.0
$189,900
🖨 Deal sheet 📄 Offer letter ✓ Due diligence
Listing remarks
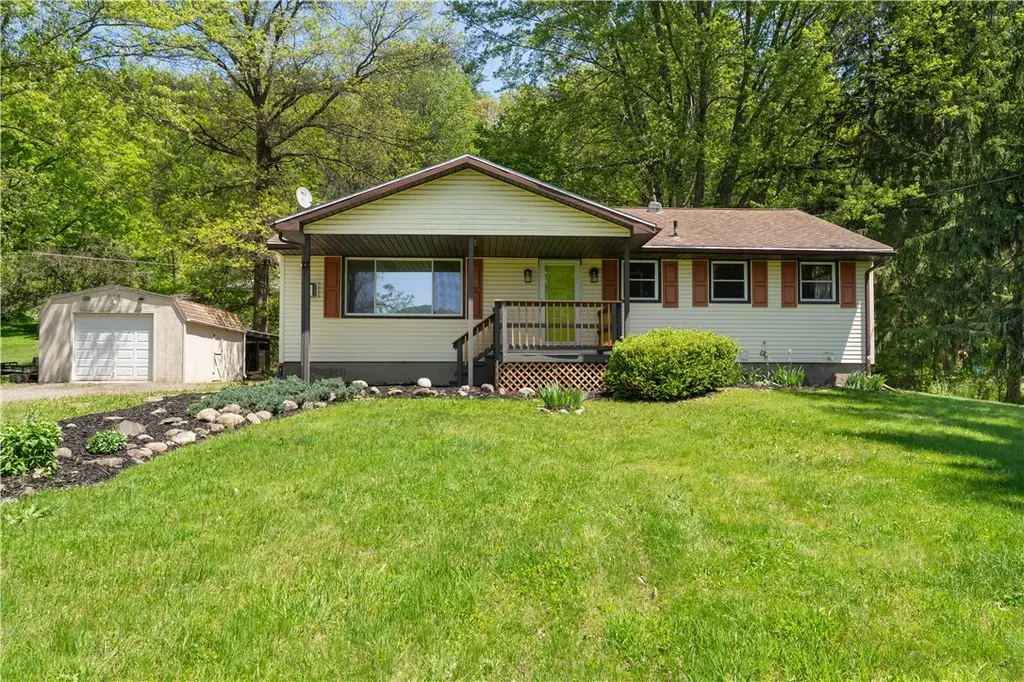
Welcome to this well-cared-for one-owner ranch home situated on just over 2 acres in the Campbell-Savona School District! Offering 3 bedrooms and 1.5 baths, this property provides the perfect balance of space and convenience and only a short drive to I-86. Inside, you’ll find original hardwood floors throughout, a cozy gas fireplace in the living room, and plenty of storage space. The full partially finished basement offers additional living and entertaining space complete with a bar, sink, and half bath. Major updates include a new furnace and central air in 2020, hot water tank in 2019, and a roof approximately 8–10 years old. Outside features include a detached 1-car garag
Key facts
- Cozy gas fireplace
- Doggy door
- 2.08 acre lot
Tags
Property features AI
Exterior
- Parking: Detached garage (1 car)
- Utilities: Electricity connected (circuit breakers); Well water; Septic tank; High-speed internet available
- Home design: Single-story home; Existing construction; Vinyl siding
- Construction: Block foundation
- Exterior features: Partial fencing; Gravel driveway; Covered patio/porch; Patio; Porch; Shed(s)/storage; Poultry coop
Interior
- Kitchen: Dishwasher; Gas oven; Gas range; Microwave; Refrigerator
- Bedrooms: 3 bedrooms on the main level
- Flooring: Hardwood; Vinyl; Varies
- Bathrooms: 1 full bathroom; 1 half bathroom; 1 main-level bathroom
- Heating & cooling: Gas forced-air heating; Central air conditioning
- Interior features: Ceiling fans; Separate/formal dining room; Pantry; Bar; Accessible bedroom; Has basement (full, partially finished); Fireplace (1)
- Laundry & utility: Gas water heater
Neighborhood map
What this means for you Summary
Snapshot
- This is a 3-bed/1.0-bath single-family listed at $190k.
Deal economics
- At list price, monthly cash flow is $-306 ($-4k/yr) — negative.
- To cash-flow at today's rent, offer at most $136k (28.5% below list).
- To meet the 1% rule (rent ≥ 1% of price), the offer needs to be $127k (33.1% below list).
- Recommended offer: $127k (33.1% below list) — sets the bar for 1% rule.
Location & tenants
- Location reads 61/100 on livability (#917 in NY) — a middle-class / working-renter tenant base. Strengths: cost of living A+, housing A-, schools B; Watch: employment D+, health & safety D, crime F.
- Campbell-Savona Central School District (rural): math 50% / reading 56% proficiency, ranked #334 of 590 in NY (top 57%) — acceptable for families but not a draw, mixed tenant base, ~2y average lease.
- Market conditions: 17 active listings in the ZIP; 196 units permitted in Steuben County in 2024 (0 in 5+ unit buildings).
Forward outlook
- In year one you build about $13k of equity ($1k loan paydown + $12k appreciation (6.1% local appreciation)).
- Steuben County population projected at -20% by 2050 — secular population decline; favor cash flow + early exit over multi-decade hold.
- By year 3, paydown + projected appreciation supports a ~$32k cash-out refi (75% LTV) — recoverable capital for the next deal without selling this one.
Negotiation context
- Only 6 days on market — expect competitive offers; lowballing is unlikely to land.
- 2 sale attempts since 8y ago with the ask held roughly flat each time — persistent listings suggest the price (not the market) is what's stuck; bring a comps-based counter.
Questions for the listing agent
- What do current leases actually rent for vs. the listed asking? Can we see a recent rent roll and the last 12 months of T-12 income?
- Built in 1969 — when were the roof, HVAC, electrical panel, plumbing, and water heater last replaced?
- Is there a deadline driving the sale (1031 exchange, divorce, estate, relocation)? That informs how much negotiation room exists.
- Schools are B-rated — typically a magnet for longer-tenancy family renters. What's the average tenant stay here, and is there a school-zone premium baked into asking?
- Crime grade is F in this area — have there been break-ins, vandalism, or insurance claims at this property in the last 3 years? What carrier currently insures it and at what premium?
- The area grade is low — what's the realistic commute time and amenity access for the typical tenant pool here? Any planned neighborhood developments (good or bad) we should know about?
- What's the average days-on-market for RENTAL listings here right now (not sales)? A rising rental-DOM trend means longer vacancies and softer asking-rent achievability than the comps imply.
- What's the recent tenant-quality profile in this submarket — average credit score on applications, eviction rate, late-payment / NSF rate, and stable-employment percentage? A property-management company in the area should have these aggregated.
- How much new for-sale + rental construction is in the pipeline within 1–3 miles? Heavy new supply typically softens prices + rents 12–24 months out; constrained supply supports both.
Investment metrics
- 1% rule
- 0.67% ✗
- Cap rate
- 4.36%
- Cash-on-cash
- -6.92%
- DSCR
- 0.69
- GRM
- 12.5
CMA / ARV
No comps found within radius.
Projected returns pro-forma
6.07% appreciation · 3.0% rent growth · sell at horizon
- IRR
- 10.0%
- Equity multiple
- 1.68×
- Total profit
- $36,101
- Equity at exit
- $120,198
- IRR
- 11.2%
- Equity multiple
- 3.28×
- Total profit
- $121,299
- Equity at exit
- $218,684
Cash invested: $53,172 (down + closing). Projections, not guarantees.
Landlord ↔ Tenant lean methodology
- Overall (STATE)
- 15 Strongly Tenant-Friendly
- State New York
- 15 Strongly Tenant-Friendly · D+10
- County
- — inherits STATE
- City
- — inherits STATE
ZIP-level market 14821
- Home prices YoY
- 2.8%
- Active inventory
- 17
- Price-to-rent
- 12.5×
Monthly cashflow live
- Estimated rent
- $1,271 medium interval (Pro) →
- Mortgage (P&I)
- −$996
- Tax from tax record
- −$236 /mo · $2,826/yr
- Insurance
- −$79
- HOA
- −$0
- Vacancy / Maint / Mgmt
- −$267
- Net cashflow
- $-306
Break-even live
UW: 25.0% down · 7.5% · 30yr · 1.5% tax · 5.0% vac · 8.0% maint · 8.0% mgmt
Financing live
Cash to close
- Down payment
- $47,475
- Closing costs
- $5,697
- Reserves months
- —
- Total cash needed
- —
Loan-product check · same deal, 3 products live
Conventional
25% down · 7.5% · 30yr
- Down + closing
- —
- Monthly P&I
- —
- Monthly cashflow
- —
- DSCR
- —
- Eligible?
- —
Personal DTI + credit; lowest rate.
DSCR
20% down · 8.5% · 30yr
- Down + closing
- —
- Monthly P&I
- —
- Monthly cashflow
- —
- DSCR
- —
- Eligible?
- —
No personal income docs; deal must DSCR.
Hard money
10% down · 12.0% · 12mo
- Down + closing
- —
- Monthly P&I
- —
- Monthly cashflow
- —
- DSCR
- —
- Eligible?
- —
Short-term bridge; refi at stabilization.
Listing history 8 events
-
2026-06-07statusdays on market $189,900 Pending 6 DOM
-
2026-06-02days on market $189,900 Active 5 DOM
-
2026-06-01days on market $189,900 Active 4 DOM
-
2026-05-31days on market $189,900 Active 3 DOM
-
2026-05-30days on market $189,900 Active 2 DOM
-
2026-05-28$189,900 Active
-
2018-12-06historical
-
2018-11-15$159,000
ⓘ Source: listings_history table (triggers on properties + properties_extension) + one-shot
backfill from property_details.listing_events for pre-trigger history.
Tax reassessment forecast NY · Partial reset (capped growth)
- Current annual tax
- $2,826 · $236/mo
- Projected year-2 tax
- $3,018 · $251/mo
- Expected delta
- +$192/yr (+$16/mo · 6.8%)
ⓘ Screening estimate from a state-policy table — verify with the county assessor before closing.
Climate risk First Street
- Flood 1/10 Low FEMA zone X · 0% chance over 30 yrs
- Wildfire 3/10 Moderate
- Heat 2/10 Low 7 d/yr ≥93°F today · 16 d/yr by 30 yrs out
- Wind 1/10 Low
- Air quality 1/10 Low 0 unhealthy d/yr today · 0 by 30 yrs out
Nearby sold comps map
Loading sold comps map…
Walkable amenities ~0.75 mi
Loading nearby amenities…
Taxation est. · year 1
- Rental income
- $15,252
- − Mortgage interest
- −$10,637
- − Property taxes
- −$2,826
- − Insurance
- −$950
- − Repairs & maintenance
- −$1,220
- − Management
- −$1,220
- − Depreciation
- −$5,524
- Taxable loss
- −$7,126
- Est. tax savings @ 24.0%
- +$1,710
- After-tax cash flow
- $-1,967/yr
For passive investors: Depreciation is non-cash, so a rental often shows a tax loss while cash-flowing — sheltering income. Rental losses are passive: they offset passive income freely, and up to $25,000/yr can offset ordinary (W-2) income if you actively participate and your MAGI is under $100k (phasing out to $0 by $150k); unused losses carry forward. On sale, claimed depreciation is recaptured at up to 25%, and gains may owe capital-gains tax (a 1031 exchange can defer both). Figures are a year-1 estimate at your 24.0% rate — not tax advice; consult a CPA.
Schools (NCES district)
- District
- Campbell-Savona Central School District
- NCES district ID
- 3600020
- Math proficiency
- 50% ▬ 0.00%
- Reading proficiency
- 56% ▲ 12.00%
- Median HH income
- $49,653
- Composite
- 45.22/100
- National rank
- #2667
- State rank
- #334 of 590 in NY
Livability — Campbell
- Score
- 61/100
- State rank
- #917
- US rank
- #17948
Category grades
Schools grade is shown separately in the Schools card above.
Census & demographics
- Population (ZIP)
- 3,015
Population outlook (Steuben County) Hauer SSP2
- Today (2025)
- 93,062 people
- By 2030
- 89,793 · -3.5%
- By 2040
- 82,353 · -11.5%
- By 2050
- 74,286 · -20.2%
- By 2075
- 55,589 · -40.3%
- By 2100
- 37,587 · -59.6%
Race, ethnicity, and origin ACS 2023
- Neighborhood character
- Predominantly White (95%)
- Race & ethnicity
- White 95% Two or more races 3%
- Common ancestry
- Romanian 3% Lithuanian 3% Italian 2%
- Foreign-born
- 0%
- Languages at home
- 97% English-only · German/W. Germanic 2%
Political lean MEDSL · Steuben
- 2024 margin
- Solid R (+31.8) · D 34.1% · R 65.9%
- 2008→2024 swing
- -15.0pp toward R · 2008: -16.8pp · 2024: -31.8pp
- All cycles
- 2024: R+31.8 2020: R+29.6 2016: R+36.2 2012: R+16.4 2008: R+16.8
Not yet ingested
- Civics
- —
Market trends
- HPI YoY
- ▲ 6.07%
- Current HPI
- 224.5452
- Rent YoY
- —
- Metro
- —
- State GDP YoY
- ▲ 2.60%
- F500 in state
- 92
Industry mix (Fortune 500 HQ in NY)
| Industry | F500 HQs | Revenue |
|---|---|---|
| Financial Services | 10 | $950B |
|
||
| Consumer Goods | 9 | $162B |
|
||
| Insurance | 4 | $225B |
|
||
| Telecommunications | 2 | $144B |
|
||
| Pharmaceuticals | 2 | $112B |
|
||
| Media / Entertainment | 2 | $69B |
|
||
Price history
+19.4% since first listed3 events — show timeline
- 2026-05-28 Listed $189,900 UNYREIS
- 2018-12-06 Listing Removed — UNYREIS
- 2018-11-15 Listed $159,000 UNYREIS
Property tax history
-2.6%/yrLatest (2025): $2,826 · +6.6% YoY. Source: county tax records.
Cash-flow waterfall
monthlySold comps — $/sqft
last 12 mo · ≤1 miLoading sold comps…