60 Colonial Park Dr · Larkfield-Wikiup, CA
Flood risk 1/10 · Minimal
- FEMA flood zone
- X (unshaded)
- Chance of flooding over 30 yrs
- 0.0%
- Est. flood insurance / yr
- $507 – $1,088
Fire risk 5/10 · Moderate
- Est. fire insurance / yr
- $659 – $1,223
Heat risk 4/10 · Minor
- Hot days now (above 90°F)
- 7 days/yr
- Hot days in 30 yrs
- 16 days/yr
Wind risk 1/10 · Minimal
- Chance of severe wind over 30 yrs
- —
Air-quality risk 9/10 · Severe
- Unhealthy air days now
- 18 days/yr
- Unhealthy air days in 30 yrs
- 20 days/yr
Risk factors via First Street. Map © Google.
Why this score? — see what drove the B+ grade
The composite is a weighted blend of 9 inputs, each scored 0–100. Each bar is that input's sub-score; the figure is the points it added to the 100-point composite (weight × sub-score).
- Cash flow +30.0/30.0
- ARV discount +15.0/15.0
- 1% rule +10.0/10.0
- DSCR +10.0/10.0
- Condition / age +4.0/5.0
- Schools +3.7/10.0
- Rent growth +2.5/5.0
- Livability +2.5/5.0
- Appreciation +0.0/10.0
$164,900
🖨 Deal sheet (PDF) 📄 Offer letter ✓ Due diligence
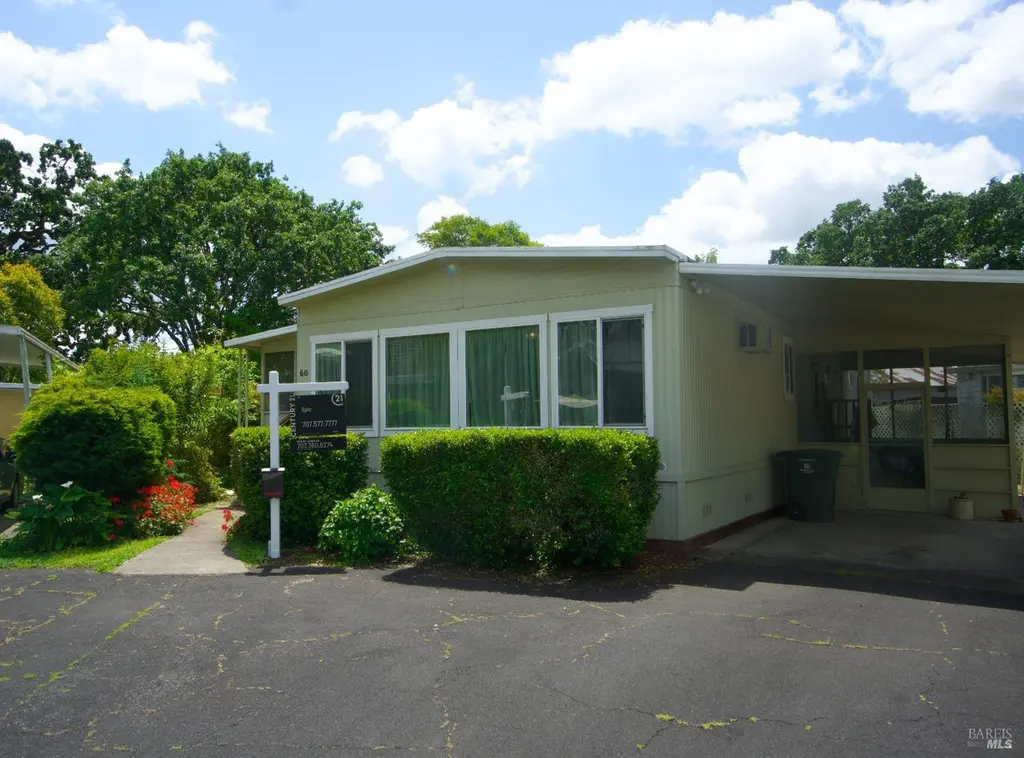
Listing remarks
Welcome Home to this lovely double wide 2 bedroom, 2 bath 1440 sq. ft. home in Colonial Senior Mobile Home Park. Priced at just $164,900. this updated home is move-in ready. You enter the home through a wonderful inviting screened in porch, a fantastic place to sit and drink your coffee! In front of you is the heart of the home, the updated kitchen featuring newer cabinets with under cabinet lighting, newer eye-catching countertops, and a full gas range with a newer microwave with vent built in above the stove, plus a refrigerator. The living room to the right of the front door has beautiful wide windows with custom window coverings to bring in the natural light. It feels spacious and invit
Key facts
- Screened in porch
- Updated kitchen
- Full gas range
Tags
Property features AI
Finance
- Financial info: Monthly land lease amount: $823
- HOA & community: No homeowners association; Located in a senior community; Land lease (space rent applicable)
Exterior
- Parking: Attached covered parking for 2 vehicles
- Utilities: Individual electric meter; Individual gas meter; Internet available; Public sewer
- Home design: Manufactured home in a park; Double wide; Skyline manufacturer; Aluminum skirting
- Construction: Composition roof
- Exterior features: Porch with steps; Close to clubhouse; Court-front lot; Front yard
Interior
- Kitchen: Free standing gas range; Free standing refrigerator; Range hood; Microwave
- Bedrooms: 2 bedrooms
- Flooring: Carpet; Laminate
- Bathrooms: 2 full bathrooms with tub and shower stall(s)
- Heating & cooling: Central heating; Ceiling fans
- Interior features: Updated/remodeled condition; Screened room; Dining and living room combined; Laminate countertops
- Laundry & utility: Washer and dryer included; Laundry inside
Neighborhood map
What this means for you Summary
Snapshot
- This is a 2-bed/2.0-bath manufactured listed at $165k. Condition is rated good.
Deal economics
- At list price, monthly cash flow is $1k ($14k/yr) — positive.
- The deal already cash-flows at list — no discount required.
- Meets the 1% rule at list price ($3k rent vs $165k).
- Recommended offer: $160k (3.0% below list) — sets the bar for market timing.
- Cap rate 15.0% vs local median 2.1% in Larkfield-Wikiup — top-decile yield for the area; either an underpriced asset or a hidden risk that comps aren't pricing in. Stress-test before assuming the spread holds.
Location & tenants
- Location reads: area grade B — affects rentability + tenant quality, not the cash-flow math above.
- Santa Rosa High (urban): math 31% / reading 47% proficiency, ranked #703 of 1,400 in CA (top 50%) — families likely to look elsewhere, expect single-tenant / working-renter base with shorter leases.
- Zoned schools: Mark West Elementary (math 32% / reading 42%, grade F, #671 of 1,571 statewide, top 44%, 397 students, 47% FRL); Santa Rosa Middle (466 students, 53% FRL); Santa Rosa High (1,682 students, 39% FRL) — zoned schools average 46% FRL vs 22% district-wide (24 pts higher); higher-poverty schools than district average — tighter screening recommended.
- Market conditions: Rents flat; 200 active listings in the ZIP; 8 comparable units currently listed for rent nearby; rentals at typical pace (median 15d on market — plan ~3-4 weeks tenant-placement turnaround); solid renter incomes; 1,039 units permitted in Sonoma County in 2024 (185 in 5+ unit buildings).
- This rent runs 36% of the median local income ($98k/yr) — at the standard rent-burdened threshold; future hikes will face affordability resistance.
Forward outlook
- Local home prices are declining (-3.0%/yr); year-one equity from $1k of loan paydown is wiped out by about $5k of value loss. Plan a longer hold.
- Sonoma County population projected at +8% by 2050 — modest demand growth; plan on rents tracking national, not racing it.
- At projected returns (-3.0% appreciation + 0.1% rent growth), your $46k cash investment doubles in ~5 years — after that, you're playing with house money.
Negotiation context
- It's been on market 53 days — a 3% lower offer ($160k) is reasonable based on typical stale-listing flexibility.
- 2 sale attempts; this cycle's ask has dropped $15k (8%) from the opening price — seller is motivated, your offer sets the floor, not the list.
Risks & watch-outs
- Climate carrying-cost: moderate wildfire risk — expect insurance premiums to compound above CPI over the hold.
Questions for the listing agent
- It's been on market 53 days. Have you received any prior offers? Is the seller open to a 3% concession, seller financing, or rate buy-down credit?
- Built in 1966 — when were the roof, HVAC, electrical panel, plumbing, and water heater last replaced?
- Is there a deadline driving the sale (1031 exchange, divorce, estate, relocation)? That informs how much negotiation room exists.
- What's the average days-on-market for RENTAL listings here right now (not sales)? A rising rental-DOM trend means longer vacancies and softer asking-rent achievability than the comps imply.
- What's the recent tenant-quality profile in this submarket — average credit score on applications, eviction rate, late-payment / NSF rate, and stable-employment percentage? A property-management company in the area should have these aggregated.
- How much new for-sale + rental construction is in the pipeline within 1–3 miles? Heavy new supply typically softens prices + rents 12–24 months out; constrained supply supports both.
Investment metrics
- 1% rule
- 1.79% ✓
- Cap rate
- 15.01%
- Cash-on-cash
- 31.12%
- DSCR
- 2.38
- GRM
- 4.6
CMA / ARV
- ARV (on-the-fly)
- $224,640
- Comps found
- 12
Show comp detail 12 sales within ~0.75 mi
| Address | Dist | Beds/Ba | Sqft | Sold | Price | $/sf | Match |
|---|---|---|---|---|---|---|---|
| 45 Colonial Park Dr | 0.04mi | 2/2.0 | 1,344 (-7%) | 8mo | $259,000 | $193 | 80 |
| 16 Ellie Dr | 0.17mi | 2/2.0 | 1,440 (0%) | 16mo | $119,000 | $83 | 78 |
| 468 Colonial Park Dr | 0.23mi | 2/2.0 | 1,344 (-7%) | 2mo | $210,000 | $156 | 77 |
| 600 Colonial Park Dr | 0.07mi | 3/2.0 (+1) | 1,632 (+13%) | 1mo | $275,000 | $169 | 69 |
| 152 Colonial Park Dr | 0.08mi | 2/2.0 | 1,286 (-11%) | 20mo | $196,000 | $152 | 61 |
| 19 Ellie Dr | 0.22mi | 3/2.0 (+1) | 1,300 (-10%) | 11mo | $240,000 | $185 | 59 |
| 5229 Whispering Creek Dr | 0.57mi | 3/2.0 (+1) | 1,344 (-7%) | 3mo | $205,000 | $153 | 55 |
| 5304 Huckleberry Way | 0.60mi | 3/2.0 (+1) | 1,404 (-2%) | 18mo | $200,000 | $142 | 48 |
| 45 Arthur Dr | 0.30mi | 3/2.0 (+1) | 1,315 (-9%) | 23mo | $255,000 | $194 | 48 |
| 5241 Whispering Crk | 0.57mi | 2/2.0 | 1,224 (-15%) | 2mo | $191,000 | $156 | 47 |
| 5300 Rexford #5300 | 0.63mi | 3/2.0 (+1) | 1,248 (-13%) | 6mo | $145,000 | $116 | 38 |
| 5308 Rexford Way | 0.62mi | 3/2.0 (+1) | 1,248 (-13%) | 12mo | $187,000 | $150 | 34 |
Match score weights: distance 35% · size 25% · config 20% · recency 20%. Top-matched comps best support the ARV.
Projected returns pro-forma
-3.0% appreciation · 0.1% rent growth · sell at horizon
- IRR
- 22.6%
- Equity multiple
- 1.89×
- Total profit
- $41,202
- Equity at exit
- $24,587
- IRR
- 28.7%
- Equity multiple
- 3.20×
- Total profit
- $101,783
- Equity at exit
- $14,258
Cash invested: $46,172 (down + closing). Projections, not guarantees.
Landlord ↔ Tenant lean methodology
- Overall (STATE)
- 18 Strongly Tenant-Friendly
- State California
- 18 Strongly Tenant-Friendly · D+13
- County
- — inherits STATE
- City
- — inherits STATE
ZIP-level market 95403
- Rents YoY
- 0.1%
- Active inventory
- 200
- Price-to-rent
- 4.6×
Monthly cashflow live
- Estimated rent
- $2,958 high interval (Pro) →
- Mortgage (P&I)
- −$865
- Tax est. 1.5%
- −$206 /mo · $2,474/yr
- Insurance
- −$69
- HOA
- −$0
- Vacancy / Maint / Mgmt
- −$621
- Net cashflow
- $1,197
Break-even live
Sensitivity live
| Price | -10% $1,311 | -5% $1,254 | +0% $1,197 | +5% $1,140 | +10% $1,084 |
|---|---|---|---|---|---|
| Rent | -10% $964 | -5% $1,081 | +0% $1,197 | +5% $1,314 | +10% $1,431 |
| Rate | -1.0pp $1,281 | -0.5pp $1,239 | base $1,197 | +0.5pp $1,155 | +1.0pp $1,111 |
UW: 25.0% down · 7.5% · 30yr · 1.5% tax · 5.0% vac · 8.0% maint · 8.0% mgmt
Financing live
Cash to close
- Down payment
- $41,225
- Closing costs
- $4,947
- Reserves months
- —
- Total cash needed
- —
Loan-product check · same deal, 3 products live
Conventional
25% down · 7.5% · 30yr
- Down + closing
- —
- Monthly P&I
- —
- Monthly cashflow
- —
- DSCR
- —
- Eligible?
- —
Personal DTI + credit; lowest rate.
DSCR
20% down · 8.5% · 30yr
- Down + closing
- —
- Monthly P&I
- —
- Monthly cashflow
- —
- DSCR
- —
- Eligible?
- —
No personal income docs; deal must DSCR.
Hard money
10% down · 12.0% · 12mo
- Down + closing
- —
- Monthly P&I
- —
- Monthly cashflow
- —
- DSCR
- —
- Eligible?
- —
Short-term bridge; refi at stabilization.
Rent comps 8 comps
| Address | Beds | Baths | Sqft | Rent | $/sqft | DOM | Units | Dist |
|---|---|---|---|---|---|---|---|---|
| 117 E Shiloh Rd Santa Rosa, CA | 3.0 | 3.0 | 1783 | $4,100 | $2.30 | 45d | 1 | 0.51mi |
| 193 Airport Blvd E Santa Rosa, CA | 1.0–2.0 | 1.0–1.5 | 967 | $2,760 | $2.85 | 14d | 1 | 0.74mi |
| 5252 Old Redwood Hwy Unit 20 Santa Rosa, CA | 2.0 | 1.0 | 900 | $2,000 | $2.22 | 14d | 1 | 0.82mi |
| 5256 Old Redwood Hwy Unit 31 Santa Rosa, CA | 2.0 | 2.0 | 950 | $2,200 | $2.32 | 14d | 1 | 0.83mi |
| 5223 Old Redwood Hwy Santa Rosa, CA | 2.0 | 1.0 | 915 | $3,200 | $3.50 | 14d | 1 | 0.99mi |
| 5209 Old Redwood Hwy Santa Rosa, CA | 2.0 | 2.0 | 1014 | $2,450 | $2.42 | 23d | 1 | 1.03mi |
| 5365 Arnica Way Santa Rosa, CA | 3.0 | 2.0 | 1699 | $3,450 | $2.03 | 22d | 1 | 1.03mi |
| 1145 Shiloh Rd Windsor, CA | 3.0 | 1.0–2.0 | 776 | $3,828 | $4.93 | 9d | 14 | 1.49mi |
Listing history 19 events
-
2026-06-21days on market $164,900 Active 53 DOM
-
2026-06-18days on market $164,900 Active 50 DOM
-
2026-06-17days on market $164,900 Active 49 DOM
-
2026-06-16pricedays on market $164,900 Active 48 DOM
-
2026-06-15days on market $169,900 Active 47 DOM
-
2026-06-14days on market $169,900 Active 45 DOM
-
2026-06-13days on market $169,900 Active 44 DOM
-
2026-06-10days on market $169,900 Active 42 DOM
-
2026-06-09days on market $169,900 Active 41 DOM
-
2026-06-08days on market $169,900 Active 40 DOM
-
2026-06-07days on market $169,900 Active 39 DOM
-
2026-06-03days on market $169,900 Active 35 DOM
-
2026-06-02days on market $169,900 Active 34 DOM
-
2026-06-01days on market $169,900 Active 33 DOM
-
2026-05-31days on market $169,900 Active 32 DOM
-
2026-05-30days on market $169,900 Active 31 DOM
-
2026-05-20status Active
-
2026-05-06historical Contingent (Show)
-
2026-04-29$179,900 Active
ⓘ Source: listings_history table (triggers on properties + properties_extension) + one-shot
backfill from property_details.listing_events for pre-trigger history.
Climate risk First Street
- Flood 1/10 Low FEMA zone X (unshaded) · 0% chance over 30 yrs
- Wildfire 5/10 Major
- Heat 4/10 Moderate 7 d/yr ≥90°F today · 16 d/yr by 30 yrs out
- Wind 1/10 Low
- Air quality 9/10 Extreme 18 unhealthy d/yr today · 20 by 30 yrs out
Nearby sold comps map
Loading sold comps map…
Walkable amenities ~0.75 mi
Loading nearby amenities…
Taxation est. · year 1
- Rental income
- $35,500
- − Mortgage interest
- −$9,237
- − Property taxes
- −$2,474
- − Insurance
- −$824
- − Repairs & maintenance
- −$2,840
- − Management
- −$2,840
- − Depreciation
- −$4,797
- Taxable income
- $12,488
- Est. tax owed @ 24.0%
- −$2,997
- After-tax cash flow
- $11,373/yr
For passive investors: Depreciation is non-cash, so a rental often shows a tax loss while cash-flowing — sheltering income. Rental losses are passive: they offset passive income freely, and up to $25,000/yr can offset ordinary (W-2) income if you actively participate and your MAGI is under $100k (phasing out to $0 by $150k); unused losses carry forward. On sale, claimed depreciation is recaptured at up to 25%, and gains may owe capital-gains tax (a 1031 exchange can defer both). Figures are a year-1 estimate at your 24.0% rate — not tax advice; consult a CPA.
Condition & rehab AI · 12 photos
This move-in ready double-wide manufactured home in Colonial Senior Mobile Home Park is in good condition with updated kitchen and a well-maintained exterior. It offers a good investment opportunity with potential for value enhancement through minor updates.
Value-add opportunities
- Both Painting the exterior and interior walls — Fresh paint can enhance curb appeal and interior aesthetics
- Both Landscaping improvements — Enhanced landscaping can increase curb appeal and property value
- Resale Updating the kitchen backsplash — A fresh backsplash can make the kitchen more appealing to potential buyers
- Resale Upgrading the flooring in the bathrooms — Updated flooring can make bathrooms more appealing to potential buyers
Renovation cost estimate screening
Value-add ROI direction
- Both Painting the exterior and interior walls — Fresh paint can enhance curb appeal and interior aesthetics ↑
- Both Landscaping improvements — Enhanced landscaping can increase curb appeal and property value ↑
- Resale Updating the kitchen backsplash — A fresh backsplash can make the kitchen more appealing to potential buyers ↑
- Resale Upgrading the flooring in the bathrooms — Updated flooring can make bathrooms more appealing to potential buyers ↑
ⓘ Cost ranges are severity-bucket heuristics (US national rule-of-thumb). Get contractor quotes + a written scope before underwriting a rehab budget.
Schools (NCES district)
- District
- Santa Rosa High
- NCES district ID
- 0635830
- Math proficiency
- 31% —
- Reading proficiency
- 47% —
- Median HH income
- $62,000
- Composite
- 37.25/100
- National rank
- #8972
- State rank
- #703 of 1400 in CA
Livability — Larkfield-Wikiup
No livability data for this city. (Only ~50 U.S. cities are tracked.)
Census & demographics
- Census place
- Larkfield-Wikiup, CA
- County
- Sonoma County · 449,805 people
- City population
- 45,570
- Metro
- Santa Rosa-Petaluma, CA
- Population (ZIP)
- 45,806
- Household income
- $98,191
- Rent vs Own
- Severe rent burden
- 1770.0
Population outlook (Sonoma County) Hauer SSP2
- Today (2025)
- 539,935 people
- By 2030
- 554,870 · +2.8%
- By 2040
- 573,262 · +6.2%
- By 2050
- 580,715 · +7.6%
- By 2075
- 579,229 · +7.3%
- By 2100
- 547,835 · +1.5%
Race, ethnicity, and origin ACS 2023
- Neighborhood character
- Diverse neighborhood (Simpson 0.61)
- Race & ethnicity
- White 50% Hispanic / Latino 37% Two or more races 13% Asian 5% Native American 2% Black 2%
- Hispanic origin (detail)
- Mexican 31%
- Common ancestry
- Italian 3% Slovak 2% Lithuanian 2%
- Foreign-born
- 20% · Canada, Vietnam, South Korea
- Languages at home
- 67% English-only · Spanish 26% Other Indo-European 1% Vietnamese 1%
Political lean MEDSL · Sonoma
- 2024 margin
- Solid D (+46.2) · D 71.4% · R 25.2% · Other 3.3%
- 2008→2024 swing
- -3.4pp toward R · 2008: 49.6pp · 2024: 46.2pp
- All cycles
- 2024: D+46.2 2020: D+51.5 2016: D+47.9 2012: D+44.9 2008: D+49.6
Not yet ingested
- Civics
- —
Market trends
- HPI YoY
- ▼ -679.94%
- Current HPI
- 254.3106
- Rent YoY
- ▲ 0.10%
- Metro
- Santa Rosa-Petaluma, CA
- State GDP YoY
- ▲ 3.21%
- F500 in state
- 116
Industry mix (Fortune 500 HQ in CA)
| Industry | F500 HQs | Revenue |
|---|---|---|
| Technology | 27 | $1,492B |
|
||
| Financial Services | 3 | $174B |
|
||
| Retail | 3 | $44B |
|
||
| Insurance | 3 | $26B |
|
||
| Media / Entertainment | 2 | $115B |
|
||
| Pharmaceuticals / Biotech | 2 | $62B |
|
||
Price history
3 events — show timeline
- 2026-05-20 Relisted — BAREIS
- 2026-05-06 Contingent — BAREIS
- 2026-04-29 Listed $179,900 BAREIS
Cash-flow waterfall
monthlySold comps — $/sqft
last 12 mo · ≤1 miLoading sold comps…