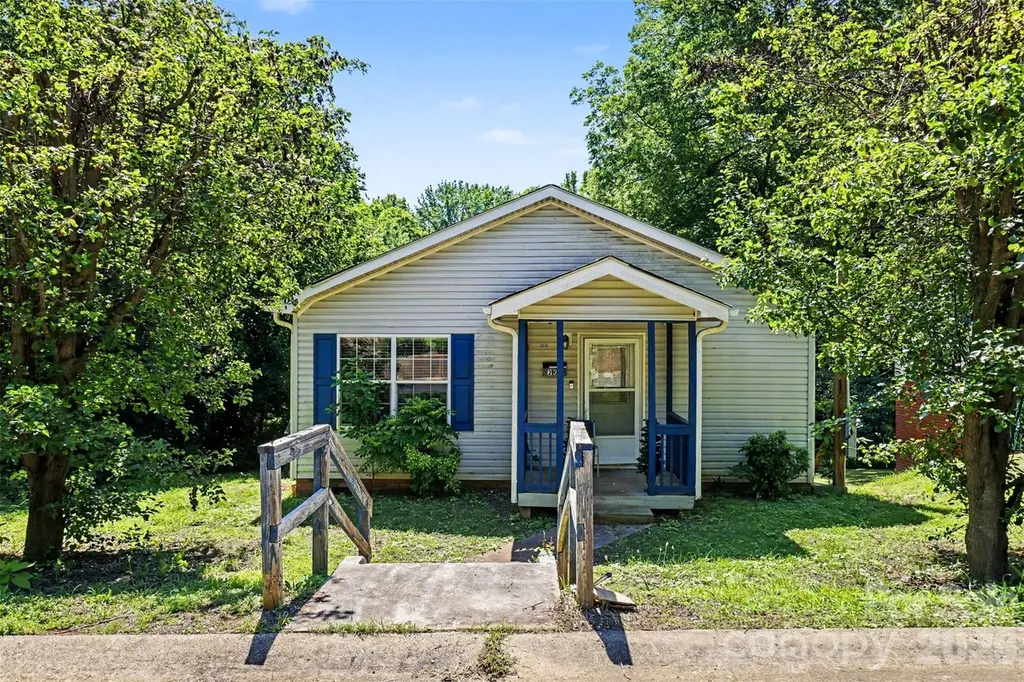
202 Joe Louis St · Fort Mill, SC
Flood risk 1/10 · Minimal
- FEMA flood zone
- X (unshaded)
- Chance of flooding over 30 yrs
- 0.0%
- Est. flood insurance / yr
- $507 – $1,088
Fire risk 3/10 · Minor
- Est. fire insurance / yr
- $783 – $1,453
Heat risk 6/10 · Moderate
- Hot days now (above 105°F)
- 7 days/yr
- Hot days in 30 yrs
- 16 days/yr
Wind risk 6/10 · Moderate
- Chance of severe wind over 30 yrs
- 27.0%
Air-quality risk 2/10 · Minimal
- Unhealthy air days now
- 2 days/yr
- Unhealthy air days in 30 yrs
- 2 days/yr
Risk factors via First Street. Map © Google.
Why this score? — see what drove the D+ grade
The composite is a weighted blend of 9 inputs, each scored 0–100. Each bar is that input's sub-score; the figure is the points it added to the 100-point composite (weight × sub-score).
- ARV discount +15.0/15.0
- Cash flow +11.4/30.0
- Schools +6.1/10.0
- Livability +3.8/5.0
- DSCR +3.3/10.0
- Rent growth +2.8/5.0
- Condition / age +2.5/5.0
- 1% rule +2.0/10.0
- Appreciation +0.0/10.0
$285,000
🖨 Deal sheet (PDF) 📄 Offer letter ✓ Due diligence
Listing remarks
Great investor opportunity in the heart of rapidly growing Fort Mill! Located just minutes from vibrant downtown Fort Mill, this property offers incredible potential for rental income, renovation, or resale. Enjoy close proximity to popular local attractions including Kingsley Town Center with its shops, dining, and entertainment, as well as easy access to Anne Springs Close Greenway for outdoor recreation, trails, and events. Situated in a highly desirable area with strong growth and demand, you’re also just a short drive to I-77, making commuting to Charlotte quick and convenient. Whether you're looking to expand your investment portfolio or take on your next project, this property&
Key facts
- Prime location
- 5,227 sq ft lot
- Built 2006
Tags
Property features AI
Finance
- HOA & community: No HOA
Exterior
- Parking: On-street parking
- Utilities: City water; Public sewer
- Home design: Single-family residence; Site-built construction; One story; R-10 zoning
- Construction: Vinyl exterior; Crawl space foundation
- Exterior features: Sloped lot; Publicly maintained paved road
Interior
- Kitchen: Electric oven; Refrigerator
- Bedrooms: 3 bedrooms on the main level
- Flooring: Carpet; Linoleum; Vinyl
- Bathrooms: 2 full bathrooms on the main level
- Heating & cooling: Electric heating; Central air conditioning
- Interior features: Split bedroom layout; Walk-in closet(s); 10 total rooms
- Laundry & utility: Mud room laundry area
Neighborhood map
What this means for you Summary
Snapshot
- This is a 3-bed/2.0-bath single-family listed at $285k.
Deal economics
- At list price, monthly cash flow is $-101 ($-1k/yr) — negative.
- To cash-flow at today's rent, offer at most $267k (6.3% below list).
- To meet the 1% rule (rent ≥ 1% of price), the offer needs to be $199k (30.3% below list).
- Recommended offer: $199k (30.3% below list) — sets the bar for 1% rule.
- Cap rate 5.9% vs local median 2.3% in Fort Mill — top-decile yield for the area; either an underpriced asset or a hidden risk that comps aren't pricing in. Stress-test before assuming the spread holds.
Location & tenants
- Location reads 76/100 on livability (#23 in SC, #3,459 nationally) — a middle-class / working-renter tenant base. Strengths: crime A+, employment A+, housing A+; Watch: amenities F, commute F.
- York 04 (suburban): math 65% / reading 71% proficiency, ranked #1 of 80 in SC (top 1%) — acceptable for families but not a draw, mixed tenant base, ~2y average lease; only 15% free/reduced lunch — higher-income household profile.
- Zoned schools: Fort Mill Elementary (math 63% / reading 64%, grade B, #66 of 597 statewide, top 11%, 774 students, 33% FRL); Fort Mill Middle (math 53% / reading 63%, grade B, #17 of 229 statewide, top 7%, 634 students, 31% FRL); Nation Ford High (math 74% / reading 94%, grade A, #13 of 196 statewide, top 7%, 1,877 students, 30% FRL) — zoned schools average 32% FRL vs 15% district-wide (16 pts higher); higher-poverty schools than district average — tighter screening recommended.
- Market conditions: Rents rising (+1.0%/yr); 359 active listings in the ZIP; 4 comparable units currently listed for rent nearby; rentals at typical pace (median 25d on market — plan ~3-4 weeks tenant-placement turnaround); solid renter incomes; 2,550 units permitted in York County in 2024 (350 in 5+ unit buildings).
Forward outlook
- Local home prices are declining (-3.0%/yr); year-one equity from $2k of loan paydown is wiped out by about $9k of value loss. Plan a longer hold.
- York County population projected at +44% by 2050 — long-run rental-demand tailwind backs the buy-and-hold thesis.
Negotiation context
- It's been on market 16 days — a 2% lower offer ($281k) is reasonable based on typical stale-listing flexibility.
- Current owner paid $9k; list at $285k implies a 3067% gain — meaningful room to come down on a strong offer.
Risks & watch-outs
- Climate carrying-cost: major wind risk, 27% chance of damaging wind over 30y; extreme-heat days projected 7→16/yr by 2055 (HVAC capex compounding) — expect insurance premiums to compound above CPI over the hold.
Questions for the listing agent
- What do current leases actually rent for vs. the listed asking? Can we see a recent rent roll and the last 12 months of T-12 income?
- Is there a deadline driving the sale (1031 exchange, divorce, estate, relocation)? That informs how much negotiation room exists.
- Schools are B-rated — typically a magnet for longer-tenancy family renters. What's the average tenant stay here, and is there a school-zone premium baked into asking?
- The area grade is low — what's the realistic commute time and amenity access for the typical tenant pool here? Any planned neighborhood developments (good or bad) we should know about?
- What's the average days-on-market for RENTAL listings here right now (not sales)? A rising rental-DOM trend means longer vacancies and softer asking-rent achievability than the comps imply.
- What's the recent tenant-quality profile in this submarket — average credit score on applications, eviction rate, late-payment / NSF rate, and stable-employment percentage? A property-management company in the area should have these aggregated.
- How much new for-sale + rental construction is in the pipeline within 1–3 miles? Heavy new supply typically softens prices + rents 12–24 months out; constrained supply supports both.
Investment metrics
- 1% rule
- 0.70% ✗
- Cap rate
- 5.87%
- Cash-on-cash
- -1.52%
- DSCR
- 0.93
- GRM
- 12.0
CMA / ARV
- ARV (on-the-fly)
- $382,928
- Comps found
- 12
Show comp detail 12 sales within ~0.75 mi
| Address | Dist | Beds/Ba | Sqft | Sold | Price | $/sf | Match |
|---|---|---|---|---|---|---|---|
| 111 Berry St | 0.23mi | 4/2.0 (+1) | 1,456 (0%) | 0mo | $330,000 | $227 | 84 |
| 103 Wellspring Dr | 0.19mi | 3/2.0 | 1,311 (-10%) | 6mo | $345,000 | $263 | 70 |
| 107 E Hill St | 0.48mi | 4/2.0 (+1) | 1,453 (-0%) | 6mo | $400,000 | $275 | 67 |
| 109 Allison St | 0.31mi | 2/1.0 (-1) | 1,355 (-7%) | 0mo | $280,000 | $207 | 64 |
| 810 Springs St | 0.63mi | 3/1.5 | 1,438 (-1%) | 6mo | $375,000 | $261 | 62 |
| 518 Joe Louis St | 0.17mi | 3/3.0 | 1,243 (-15%) | 5mo | $327,400 | $263 | 60 |
| 103 E Gregg St | 0.55mi | 3/1.0 | 1,350 (-7%) | 5mo | $380,000 | $281 | 54 |
| 204 W Elliott St | 0.68mi | 3/2.0 | 1,341 (-8%) | 3mo | $425,000 | $317 | 53 |
| 119 W Close St | 0.66mi | 3/2.0 | 1,625 (+12%) | 0mo | $383,200 | $236 | 50 |
| 826 Savannah Place Dr | 0.66mi | 3/2.0 | 1,670 (+15%) | 0mo | $440,000 | $263 | 44 |
| 912 Gold Finch Cir | 0.71mi | 3/2.0 | 1,659 (+14%) | 3mo | $400,000 | $241 | 41 |
| 735 Shuttles Way | 0.70mi | 3/2.0 | 1,300 (-11%) | 12mo | $347,500 | $267 | 39 |
Match score weights: distance 35% · size 25% · config 20% · recency 20%. Top-matched comps best support the ARV.
Projected returns pro-forma
-3.0% appreciation · 1.0% rent growth · sell at horizon
- IRR
- -20.8%
- Equity multiple
- 0.29×
- Total profit
- $-56,681
- Equity at exit
- $42,494
- IRR
- -18.5%
- Equity multiple
- 0.08×
- Total profit
- $-73,709
- Equity at exit
- $24,642
Cash invested: $79,800 (down + closing). Projections, not guarantees.
Landlord ↔ Tenant lean methodology
- Overall (STATE)
- 90 Strongly Landlord-Friendly
- State South Carolina
- 90 Strongly Landlord-Friendly · R+6
- County
- — inherits STATE
- City
- — inherits STATE
ZIP-level market 29715
- Rents YoY
- 1.0%
- Active inventory
- 359
- Price-to-rent
- 12.0×
Monthly cashflow live
- Estimated rent
- $1,987 medium interval (Pro) →
- Mortgage (P&I)
- −$1,495
- Tax from tax record
- −$57 /mo · $689/yr
- Insurance
- −$119
- HOA
- −$0
- Vacancy / Maint / Mgmt
- −$417
- Net cashflow
- $-101
Break-even live
Sensitivity live
| Price | -10% $60 | -5% $-20 | +0% $-101 | +5% $-182 | +10% $-262 |
|---|---|---|---|---|---|
| Rent | -10% $-258 | -5% $-179 | +0% $-101 | +5% $-22 | +10% $56 |
| Rate | -1.0pp $43 | -0.5pp $-28 | base $-101 | +0.5pp $-175 | +1.0pp $-250 |
UW: 25.0% down · 7.5% · 30yr · 1.5% tax · 5.0% vac · 8.0% maint · 8.0% mgmt
Financing live
Cash to close
- Down payment
- $71,250
- Closing costs
- $8,550
- Reserves months
- —
- Total cash needed
- —
Loan-product check · same deal, 3 products live
Conventional
25% down · 7.5% · 30yr
- Down + closing
- —
- Monthly P&I
- —
- Monthly cashflow
- —
- DSCR
- —
- Eligible?
- —
Personal DTI + credit; lowest rate.
DSCR
20% down · 8.5% · 30yr
- Down + closing
- —
- Monthly P&I
- —
- Monthly cashflow
- —
- DSCR
- —
- Eligible?
- —
No personal income docs; deal must DSCR.
Hard money
10% down · 12.0% · 12mo
- Down + closing
- —
- Monthly P&I
- —
- Monthly cashflow
- —
- DSCR
- —
- Eligible?
- —
Short-term bridge; refi at stabilization.
Rent comps 4 comps
| Address | Beds | Baths | Sqft | Rent | $/sqft | DOM | Units | Dist |
|---|---|---|---|---|---|---|---|---|
| 114 E Elliott St Fort Mill, SC | 3.0 | 2.0 | 1317 | $2,193 | $1.67 | 25d | 1 | 0.54mi |
| 419 Banks St Fort Mill, SC | 2.0 | 1.0 | 1000 | $1,395 | $1.40 | 25d | 1 | 0.59mi |
| 1113 Hensley Rd W Fort Mill, SC | 3.0 | 2.0 | 1440 | $2,300 | $1.60 | 5d | 1 | 0.82mi |
| 247 Makayla Ct Fort Mill, SC | 4.0 | 2.0 | 1456 | $1,740 | $1.20 | 4d | 1 | 1.47mi |
Listing history 11 events
-
2026-06-21days on market $285,000 Active 16 DOM
-
2026-06-18days on market $285,000 Active 13 DOM
-
2026-06-17days on market $285,000 Active 12 DOM
-
2026-06-16days on market $285,000 Active 11 DOM
-
2026-06-15days on market $285,000 Active 10 DOM
-
2026-06-13days on market $285,000 Active 8 DOM
-
2026-06-13days on market $285,000 Active 7 DOM
-
2026-06-09days on market $285,000 Active 4 DOM
-
2026-06-08days on market $285,000 Active 3 DOM
-
2026-06-07remarks 693-char remark
-
2026-06-07$285,000 Active 2 DOM
ⓘ Source: listings_history table (triggers on properties + properties_extension) + one-shot
backfill from property_details.listing_events for pre-trigger history.
Tax reassessment forecast SC · Resets to sale price
- Current annual tax
- $689 · $57/mo
- Projected year-2 tax
- $1,624 · $135/mo
- Expected delta
- +$935/yr (+$78/mo · 135.7%)
ⓘ Screening estimate from a state-policy table — verify with the county assessor before closing.
Climate risk First Street
- Flood 1/10 Low FEMA zone X (unshaded) · 0% chance over 30 yrs
- Wildfire 3/10 Moderate
- Heat 6/10 Major 7 d/yr ≥105°F today · 16 d/yr by 30 yrs out
- Wind 6/10 Major 27% chance of damaging wind over 30 yrs
- Air quality 2/10 Low 2 unhealthy d/yr today · 2 by 30 yrs out
Nearby sold comps map
Loading sold comps map…
Walkable amenities ~0.75 mi
Loading nearby amenities…
Taxation est. · year 1
- Rental income
- $23,846
- − Mortgage interest
- −$15,964
- − Property taxes
- −$689
- − Insurance
- −$1,425
- − Repairs & maintenance
- −$1,908
- − Management
- −$1,908
- − Depreciation
- −$8,291
- Taxable loss
- −$6,339
- Est. tax savings @ 24.0%
- +$1,521
- After-tax cash flow
- $311/yr
For passive investors: Depreciation is non-cash, so a rental often shows a tax loss while cash-flowing — sheltering income. Rental losses are passive: they offset passive income freely, and up to $25,000/yr can offset ordinary (W-2) income if you actively participate and your MAGI is under $100k (phasing out to $0 by $150k); unused losses carry forward. On sale, claimed depreciation is recaptured at up to 25%, and gains may owe capital-gains tax (a 1031 exchange can defer both). Figures are a year-1 estimate at your 24.0% rate — not tax advice; consult a CPA.
Schools (NCES district)
- District
- York 04
- NCES district ID
- 4503900
- Math proficiency
- 65% ▼ -9.00%
- Reading proficiency
- 71% ▬ 0.00%
- Median HH income
- $79,981
- Composite
- 60.56/100
- National rank
- #835
- State rank
- #1 of 80 in SC
Livability — Fort Mill
- Score
- 76/100
- State rank
- #23
- US rank
- #3459
Category grades
Schools grade is shown separately in the Schools card above.
Census & demographics
- Census place
- Fort Mill, SC
- County
- York County · 281,758 people
- City population
- 128,009
- Metro
- Charlotte-Concord-Gastonia, NC-SC
- Population (ZIP)
- 46,865
- Household income
- $109,689
- Rent vs Own
- Severe rent burden
- 680.0
Population outlook (York County) Hauer SSP2
- Today (2025)
- 307,757 people
- By 2030
- 335,979 · +9.2%
- By 2040
- 391,378 · +27.2%
- By 2050
- 443,234 · +44.0%
- By 2075
- 557,102 · +81.0%
- By 2100
- 625,837 · +103.4%
Race, ethnicity, and origin ACS 2023
- Neighborhood character
- Predominantly White (69%)
- Race & ethnicity
- White 69% Black 11% Hispanic / Latino 10% Two or more races 9% Asian 4%
- Hispanic origin (detail)
- Mexican 4%
- Common ancestry
- Serbian 4% Slovak 3% Romanian 3%
- Foreign-born
- 9% · Canada, China, Jamaica
- Languages at home
- 87% English-only · Spanish 7% Other Indo-European 2% Other Asian/Pacific 2%
Political lean MEDSL · York
- 2024 margin
- R (+19.1) · D 39.7% · R 58.8% · Other 1.5%
- 2008→2024 swing
- -1.4pp toward R · 2008: -17.7pp · 2024: -19.1pp
- All cycles
- 2024: R+19.1 2020: R+16.5 2016: R+22.1 2012: R+20.5 2008: R+17.7
Not yet ingested
- Civics
- —
Market trends
- HPI YoY
- ▼ -161.26%
- Current HPI
- 261.4136
- Rent YoY
- ▲ 1.00%
- Metro
- Charlotte-Concord-Gastonia, NC-SC
- State GDP YoY
- ▲ 4.51%
- F500 in state
- 2
Industry mix (Fortune 500 HQ in SC)
| Industry | F500 HQs | Revenue |
|---|---|---|
| Packaging | 1 | $7B |
|
||
Price history
+3066.7% since first listed2 events — show timeline
- 2026-06-05 Listed $285,000 CANOPYMLS as Distributed by MLS Grid
- 2006-05-19 Sold (Public Records) $9,000 Public Records
Property tax history
+3.3%/yrLatest (2025): $689 · +24.9% YoY. Source: county tax records.
Cash-flow waterfall
monthlySold comps — $/sqft
last 12 mo · ≤1 miLoading sold comps…