 🏷️ Likely Rental
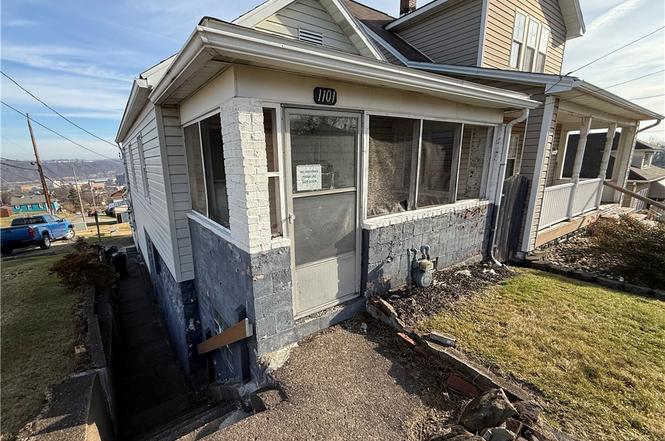
1101 Lysle Ave · Port Vue, PA
Flood risk 1/10 · Minimal
- FEMA flood zone
- X (unshaded)
- Chance of flooding over 30 yrs
- 0.0%
- Est. flood insurance / yr
- $473 – $860
Fire risk 1/10 · Minimal
- Est. fire insurance / yr
- $511 – $949
Heat risk 4/10 · Minor
- Hot days now (above 97°F)
- 7 days/yr
- Hot days in 30 yrs
- 18 days/yr
Wind risk 2/10 · Minimal
- Chance of severe wind over 30 yrs
- 0.0%
Air-quality risk 5/10 · Moderate
- Unhealthy air days now
- 8 days/yr
- Unhealthy air days in 30 yrs
- 8 days/yr
Risk factors via First Street. Map © Google.
Why this score? — see what drove the B+ grade
The composite is a weighted blend of 9 inputs, each scored 0–100. Each bar is that input's sub-score; the figure is the points it added to the 100-point composite (weight × sub-score).
- Cash flow +30.0/30.0
- 1% rule +10.0/10.0
- DSCR +10.0/10.0
- ARV discount +7.5/15.0
- Appreciation +7.3/10.0
- Livability +3.7/5.0
- Schools +2.8/10.0
- Rent growth +2.5/5.0
- Condition / age +2.5/5.0
$25,000
🖨 Deal sheet 📄 Offer letter ✓ Due diligence
Listing remarks
Solid investment property with major capital improvements already completed, including a 2-year-old roof, newer furnace and strong mechanicals. Property needs only cosmetic updates, offering value-add potential. Off-street parking increases tenant appeal. Conveniently located near shopping, schools, and main commuter routes, supporting consistent rental demand—an excellent addition to an investor's portfolio.
Key facts
- 2 year old roof
- Near schools
- Newer furnace
Tags
Neighborhood map
What this means for you Summary
Snapshot
- This is a 2-bed/1.0-bath single-family listed at $25k.
Deal economics
- At list price, monthly cash flow is $571 ($7k/yr) — positive.
- The deal already cash-flows at list — no discount required.
- Meets the 1% rule at list price ($976 rent vs $25k).
- Recommended offer: $24k (3.0% below list) — sets the bar for market timing.
Location & tenants
- Location reads 73/100 on livability (#545 in PA) — a middle-class / working-renter tenant base. Strengths: crime A+, cost of living A+, housing A+; Watch: health & safety D+, amenities F, commute F.
- South Allegheny SD (suburban): math 23% / reading 44% proficiency, ranked #430 of 539 in PA (top 80%) — families likely to look elsewhere, expect single-tenant / working-renter base with shorter leases.
- Market conditions: 39 active listings in the ZIP; 9 comparable units currently listed for rent nearby; rentals lingering (median 44d on market — plan ~5-8 weeks vacancy on turnover, expect pricing pressure); 56% of comp listings sitting > 30 days — soft ceiling on asking rent; 2,996 units permitted in Allegheny County in 2024 (1,588 in 5+ unit buildings).
- This rent is only 18% of the median local income ($66k/yr) — well below the 30% rent-burden line; pricing power to push rent on renewal without tenant pushback.
Forward outlook
- In year one you build about $1k of equity ($173 loan paydown + $1k appreciation (4.5% local appreciation)).
- At projected returns (4.5% appreciation + 3.0% rent growth), your $7k cash investment doubles in ~1 year — after that, you're playing with house money.
Negotiation context
- It's been on market 49 days — a 3% lower offer ($24k) is reasonable based on typical stale-listing flexibility.
- 2 sale attempts; this cycle's ask is 11% above the opening price — seller raised mid-cycle; expect resistance to lowballs.
Risks & watch-outs
- Watch-outs: property tax is 2.8% of price; built in 1910 — expect roof / HVAC / electrical / plumbing capex.
Questions for the listing agent
- It's been on market 49 days. Have you received any prior offers? Is the seller open to a 3% concession, seller financing, or rate buy-down credit?
- Built in 1910 — when were the roof, HVAC, electrical panel, plumbing, and water heater last replaced?
- Property tax is high relative to price — has the assessment been appealed recently, and will the sale trigger a re-assessment?
- Is there a deadline driving the sale (1031 exchange, divorce, estate, relocation)? That informs how much negotiation room exists.
- What's the average days-on-market for RENTAL listings here right now (not sales)? A rising rental-DOM trend means longer vacancies and softer asking-rent achievability than the comps imply.
- What's the recent tenant-quality profile in this submarket — average credit score on applications, eviction rate, late-payment / NSF rate, and stable-employment percentage? A property-management company in the area should have these aggregated.
- How much new for-sale + rental construction is in the pipeline within 1–3 miles? Heavy new supply typically softens prices + rents 12–24 months out; constrained supply supports both.
Investment metrics
- 1% rule
- 3.90% ✓
- Cap rate
- 33.68%
- Cash-on-cash
- 97.82%
- DSCR
- 5.35
- GRM
- 2.1
CMA / ARV
- ARV (on-the-fly)
- $54,144
- Comps found
- 8
Show comp detail 8 sales within ~0.75 mi
| Address | Dist | Beds/Ba | Sqft | Sold | Price | $/sf | Match |
|---|---|---|---|---|---|---|---|
| 1101 Lysle Ave | 0.00mi | 2/1.0 | 752 (0%) | 1mo | $20,000 | $27 | 99 |
| 1022 Alquin St | 0.18mi | 2/1.0 | 714 (-5%) | 2mo | $75,000 | $105 | 82 |
| 1014 Alquin St | 0.12mi | 2/1.5 | 768 (+2%) | 12mo | $55,000 | $72 | 79 |
| 1009 Oakland Ave | 0.22mi | 3/2.0 (+1) | 778 (+4%) | 6mo | $15,000 | $19 | 70 |
| 514 Reynolds St | 0.40mi | 2/1.0 | 778 (+4%) | 11mo | $26,000 | $33 | 67 |
| 1706 Romine | 0.56mi | 2/2.0 | 820 (+9%) | 17mo | $100,000 | $122 | 41 |
| 1457 Washington Blvd | 0.57mi | 2/1.5 | 808 (+7%) | 23mo | $124,900 | $155 | 40 |
| 1006 Woodland Ave | 0.67mi | 3/1.0 (+1) | 864 (+15%) | 10mo | $61,000 | $71 | 30 |
Match score weights: distance 35% · size 25% · config 20% · recency 20%. Top-matched comps best support the ARV.
Projected returns pro-forma
4.52% appreciation · 3.0% rent growth · sell at horizon
- IRR
- —
- Equity multiple
- 6.92×
- Total profit
- $41,459
- Equity at exit
- $13,448
- IRR
- —
- Equity multiple
- 14.47×
- Total profit
- $94,315
- Equity at exit
- $22,636
Cash invested: $7,000 (down + closing). Projections, not guarantees.
Landlord ↔ Tenant lean methodology
- Overall (STATE)
- 62 Landlord-Friendly
- State Pennsylvania
- 62 Landlord-Friendly · EVEN
- County
- — inherits STATE
- City
- — inherits STATE
ZIP-level market 15133
- Home prices YoY
- 2.1%
- Active inventory
- 39
- Price-to-rent
- 2.1×
Monthly cashflow live
- Estimated rent
- $976 high interval (Pro) →
- Mortgage (P&I)
- −$131
- Tax from tax record
- −$59 /mo · $705/yr
- Insurance
- −$10
- HOA
- −$0
- Vacancy / Maint / Mgmt
- −$205
- Net cashflow
- $571
Break-even live
UW: 25.0% down · 7.5% · 30yr · 1.5% tax · 5.0% vac · 8.0% maint · 8.0% mgmt
Financing live
Cash to close
- Down payment
- $6,250
- Closing costs
- $750
- Reserves months
- —
- Total cash needed
- —
Loan-product check · same deal, 3 products live
Conventional
25% down · 7.5% · 30yr
- Down + closing
- —
- Monthly P&I
- —
- Monthly cashflow
- —
- DSCR
- —
- Eligible?
- —
Personal DTI + credit; lowest rate.
DSCR
20% down · 8.5% · 30yr
- Down + closing
- —
- Monthly P&I
- —
- Monthly cashflow
- —
- DSCR
- —
- Eligible?
- —
No personal income docs; deal must DSCR.
Hard money
10% down · 12.0% · 12mo
- Down + closing
- —
- Monthly P&I
- —
- Monthly cashflow
- —
- DSCR
- —
- Eligible?
- —
Short-term bridge; refi at stabilization.
Rent comps 9 comps
| Address | Beds | Baths | Sqft | Rent | $/sqft | DOM | Units | Dist |
|---|---|---|---|---|---|---|---|---|
| 306 Laredo St McKeesport, PA | 2.0 | 1.0 | 928 | $995 | $1.07 | 43d | 1 | 0.46mi |
| 308 Marie St Glassport, PA | 2.0 | 1.0 | 850 | $925 | $1.09 | 16d | 1 | 0.85mi |
| 604 Shaw Ave McKeesport, PA | 2.0 | 1.0–1.5 | 800 | $900 | $1.12 | 12d | 3 | 0.89mi |
| 604 Shaw Ave Unit 101 McKeesport, PA | 2.0 | 1.5 | 1050 | $900 | $0.86 | 14d | 1 | 0.89mi |
| 604 Shaw Ave Unit 102 McKeesport, PA | 1.0 | 1.0 | 750 | $750 | $1.00 | 43d | 1 | 0.89mi |
| 1205 5th Ave McKeesport, PA | 1.0 | 1.0 | 593 | $1,090 | $1.84 | 43d | 1 | 1.29mi |
| 311-313 24th St McKeesport, PA | 2.0 | 1.0 | 950 | $900 | $0.95 | 43d | 1 | 1.29mi |
| 526 Ohio Ave Unit 3 Glassport, PA | 2.0 | 1.0 | 800 | $900 | $1.12 | 43d | 1 | 1.44mi |
| 733 Memory Ln McKeesport, PA | 2.0 | 1.0 | 850 | $1,200 | $1.41 | 23d | 1 | 1.50mi |
Listing history 6 events
-
2026-04-08status Pending
-
2026-04-02price $25,000
-
2026-03-05price $37,000
-
2026-02-19status Active
-
2026-02-10price $39,500
-
2026-02-09$22,500 Active
ⓘ Source: listings_history table (triggers on properties + properties_extension) + one-shot
backfill from property_details.listing_events for pre-trigger history.
Tax reassessment forecast PA · Partial reset (capped growth)
- Current annual tax
- $705 · $59/mo
- Projected year-2 tax
- $705 · $59/mo
- Expected delta
- $0/yr ($0/mo · 0.0%)
ⓘ Screening estimate from a state-policy table — verify with the county assessor before closing.
Climate risk First Street
- Flood 1/10 Low FEMA zone X (unshaded) · 0% chance over 30 yrs
- Wildfire 1/10 Low
- Heat 4/10 Moderate 7 d/yr ≥97°F today · 18 d/yr by 30 yrs out
- Wind 2/10 Low 0% chance of damaging wind over 30 yrs
- Air quality 5/10 Major 8 unhealthy d/yr today · 8 by 30 yrs out
Nearby sold comps map
Loading sold comps map…
Walkable amenities ~0.75 mi
Loading nearby amenities…
Taxation est. · year 1
- Rental income
- $11,709
- − Mortgage interest
- −$1,400
- − Property taxes
- −$705
- − Insurance
- −$125
- − Repairs & maintenance
- −$937
- − Management
- −$937
- − Depreciation
- −$727
- Taxable income
- $6,878
- Est. tax owed @ 24.0%
- −$1,651
- After-tax cash flow
- $5,196/yr
For passive investors: Depreciation is non-cash, so a rental often shows a tax loss while cash-flowing — sheltering income. Rental losses are passive: they offset passive income freely, and up to $25,000/yr can offset ordinary (W-2) income if you actively participate and your MAGI is under $100k (phasing out to $0 by $150k); unused losses carry forward. On sale, claimed depreciation is recaptured at up to 25%, and gains may owe capital-gains tax (a 1031 exchange can defer both). Figures are a year-1 estimate at your 24.0% rate — not tax advice; consult a CPA.
Schools (NCES district)
- District
- South Allegheny SD
- NCES district ID
- 4221910
- Math proficiency
- 23% ▼ -10.00%
- Reading proficiency
- 44% ▼ -13.00%
- Median HH income
- $40,891
- Composite
- 28.15/100
- National rank
- #6815
- State rank
- #430 of 539 in PA
Livability — Port Vue
- Score
- 73/100
- State rank
- #545
- US rank
- #5090
Category grades
Schools grade is shown separately in the Schools card above.
Census & demographics
- Census place
- Port Vue, PA
- County
- Allegheny County · 1,022,028 people
- Metro
- Pittsburgh, PA
- Population (ZIP)
- 6,112
- Household income
- $65,938
- Rent vs Own
- Severe rent burden
- 94.0
Population outlook (Allegheny County) Hauer SSP2
- Today (2025)
- 1,250,282 people
- By 2030
- 1,256,482 · +0.5%
- By 2040
- 1,256,318 · +0.5%
- By 2050
- 1,244,169 · -0.5%
- By 2075
- 1,197,693 · -4.2%
- By 2100
- 1,093,187 · -12.6%
Race, ethnicity, and origin ACS 2023
- Neighborhood character
- Predominantly White (84%)
- Race & ethnicity
- White 84% Two or more races 7% Black 4% Hispanic / Latino 3%
- Common ancestry
- Romanian 10% Slovene 2% Italian 2%
- Foreign-born
- 0%
- Languages at home
- 99% English-only · Other Indo-European 1%
Political lean MEDSL · Allegheny
- 2024 margin
- Strong D (+20.3) · D 59.7% · R 39.4%
- 2008→2024 swing
- +4.8pp toward D · 2008: 15.5pp · 2024: 20.3pp
- All cycles
- 2024: D+20.3 2020: D+20.4 2016: D+16.4 2012: D+14.4 2008: D+15.5
Not yet ingested
- Civics
- —
Market trends
- HPI YoY
- ▲ 4.52%
- Current HPI
- 214.5922
- Rent YoY
- —
- Metro
- Pittsburgh, PA
- State GDP YoY
- ▲ 1.68%
- F500 in state
- 34
Industry mix (Fortune 500 HQ in PA)
| Industry | F500 HQs | Revenue |
|---|---|---|
| Healthcare | 2 | $309B |
|
||
| Insurance | 2 | $27B |
|
||
| Telecommunications / Media | 1 | $124B |
|
||
| Industrial Distribution | 1 | $22B |
|
||
| Financial Services | 1 | $20B |
|
||
| Chemicals / Materials | 1 | $18B |
|
||
Price history
+11.1% since first listed6 events — show timeline
- 2026-04-08 Pending — West Penn MLS
- 2026-04-02 Price Changed $25,000 West Penn MLS
- 2026-03-05 Price Changed $37,000 West Penn MLS
- 2026-02-19 Relisted — West Penn MLS
- 2026-02-10 Price Changed $39,500 West Penn MLS
- 2026-02-09 Listed $22,500 West Penn MLS
Property tax history
+1.3%/yrLatest (2026): $705 · +6.0% YoY. Source: county tax records.
Cash-flow waterfall
monthlySold comps — $/sqft
last 12 mo · ≤1 miLoading sold comps…