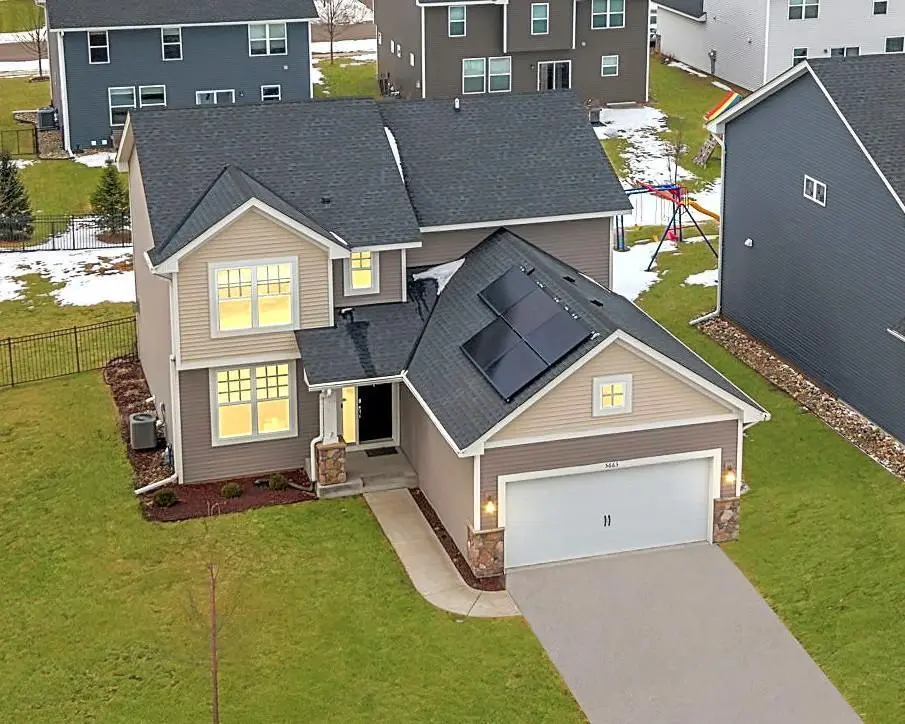
5663 Fair Haven Trl · Woodbury, MN
Flood risk 1/10 · Minimal
- FEMA flood zone
- X (unshaded)
- Chance of flooding over 30 yrs
- 0.0%
- Est. flood insurance / yr
- $473 – $860
Fire risk 2/10 · Minimal
- Est. fire insurance / yr
- $888 – $1,650
Heat risk 2/10 · Minimal
- Hot days now (above 98°F)
- 7 days/yr
- Hot days in 30 yrs
- 14 days/yr
Wind risk 2/10 · Minimal
- Chance of severe wind over 30 yrs
- —
Air-quality risk 2/10 · Minimal
- Unhealthy air days now
- 1 days/yr
- Unhealthy air days in 30 yrs
- 1 days/yr
Risk factors via First Street. Map © Google.
Why this score? — see what drove the D- grade
The composite is a weighted blend of 9 inputs, each scored 0–100. Each bar is that input's sub-score; the figure is the points it added to the 100-point composite (weight × sub-score).
- ARV discount +15.0/15.0
- Cash flow +6.5/30.0
- Schools +5.2/10.0
- Livability +4.5/5.0
- Rent growth +3.2/5.0
- Condition / age +2.5/5.0
- 1% rule +1.3/10.0
- DSCR +0.8/10.0
- Appreciation +0.0/10.0
$537,700
🖨 Deal sheet 📄 Offer letter ✓ Due diligence
Listing remarks MLS
Sold Home One of our most popular plans! Columbus Floor plan
Key facts
- Gourmet kitchen
- Solar panels
- Finished lower level
Tags
Property features AI
Finance
- Other: Conventional mortgage type available
- HOA & community: HOA managed by Associa; Monthly association fee of $23 (fee includes none)
Exterior
- Parking: Attached garage; 2-car garage; Garage door approximately 7 feet high by 16 feet wide
- Utilities: City water connected; City sewer connected; Natural gas; Electric service with circuit breakers (Xcel Energy)
- Home design: Residential property; Two levels; Main entry level present; Above-grade finished living area and below-grade finished area
- Construction: Frame construction; Poured concrete foundation; Asphalt roof (age 8 years or newer)
- Exterior features: Deck and patio; Vinyl siding; Full split-rail fencing; Corner lot; City street and cul-de-sac frontage; Publicly maintained road
Interior
- Kitchen: Range; Wall oven; Microwave; Dishwasher; Refrigerator; Disposal
- Bedrooms: 4 bedrooms total; Primary bedroom with private 3/4 bath (upper level implied); Upper-level bedrooms (three additional bedrooms)
- Bathrooms: One full bathroom; One three-quarter bathroom (primary); One half bathroom on main floor
- Heating & cooling: Forced air heating; Central air conditioning
- Interior features: Air-to-air exchanger; Exhaust fan; Family room with gas fireplace; 3/4 primary bath; Private primary bath; Main floor half bath; Rough-in plumbing; Upper level full bath; 2nd floor laundry; 4 bedrooms on one level
- Laundry & utility: Washer and dryer included; Laundry room on upper level
Neighborhood map
What this means for you Summary
Snapshot
- This is a 4-bed/3.0-bath single-family listed at $538k.
Deal economics
- At list price, monthly cash flow is $-900 ($-11k/yr) — negative.
- To cash-flow at today's rent, offer at most $379k (29.6% below list).
- To meet the 1% rule (rent ≥ 1% of price), the offer needs to be $338k (37.2% below list).
- Recommended offer: $338k (37.2% below list) — sets the bar for 1% rule.
- Cap rate 4.3% vs local median 3.5% in Woodbury — meaningfully above typical; check what's discounted (condition, days-on-market, listing class) to confirm the premium yield is real.
Location & tenants
- Location reads 89/100 on livability (#6 in MN, #153 nationally) — a professional / high-income tenant draw. Strengths: schools A+, crime A+, commute A+; Watch: cost of living F.
- South Washington County School District (suburban): math 52% / reading 61% proficiency, ranked #40 of 301 in MN (top 13%) — acceptable for families but not a draw, mixed tenant base, ~2y average lease; only 14% free/reduced lunch — higher-income household profile.
- Market conditions: Rents rising (+2.9%/yr); 356 active listings in the ZIP; 6 comparable units currently listed for rent nearby; rentals lingering (median 44d on market — plan ~5-8 weeks vacancy on turnover, expect pricing pressure); 67% of comp listings sitting > 30 days — soft ceiling on asking rent; high-income renter base; 1,405 units permitted in Washington County in 2024 (121 in 5+ unit buildings).
Forward outlook
- Local home prices are declining (-3.0%/yr); year-one equity from $4k of loan paydown is wiped out by about $16k of value loss. Plan a longer hold.
- Washington County population projected at +16% by 2050 — long-run rental-demand tailwind backs the buy-and-hold thesis.
Negotiation context
- It's been on market 50 days — a 3% lower offer ($522k) is reasonable based on typical stale-listing flexibility.
- 3 sale attempts since 7y ago with the ask held roughly flat each time — persistent listings suggest the price (not the market) is what's stuck; bring a comps-based counter.
- Current owner paid $417k; 29% above their basis — modest negotiation headroom, anchor on the comps not their cost.
Questions for the listing agent
- What do current leases actually rent for vs. the listed asking? Can we see a recent rent roll and the last 12 months of T-12 income?
- It's been on market 50 days. Have you received any prior offers? Is the seller open to a 37% concession, seller financing, or rate buy-down credit?
- What does the HOA fee cover, when was the last increase, and are there any pending special assessments or reserve-fund shortfalls?
- Is there a deadline driving the sale (1031 exchange, divorce, estate, relocation)? That informs how much negotiation room exists.
- Schools are A-rated — typically a magnet for longer-tenancy family renters. What's the average tenant stay here, and is there a school-zone premium baked into asking?
- The area grade is low — what's the realistic commute time and amenity access for the typical tenant pool here? Any planned neighborhood developments (good or bad) we should know about?
- What's the average days-on-market for RENTAL listings here right now (not sales)? A rising rental-DOM trend means longer vacancies and softer asking-rent achievability than the comps imply.
- What's the recent tenant-quality profile in this submarket — average credit score on applications, eviction rate, late-payment / NSF rate, and stable-employment percentage? A property-management company in the area should have these aggregated.
- How much new for-sale + rental construction is in the pipeline within 1–3 miles? Heavy new supply typically softens prices + rents 12–24 months out; constrained supply supports both.
Investment metrics
- 1% rule
- 0.63% ✗
- Cap rate
- 4.29%
- Cash-on-cash
- -7.17%
- DSCR
- 0.68
- GRM
- 13.3
CMA / ARV
- ARV (median comp)
- $677,488
- List price
- $537,700
- Delta
- -20.63%
- Verdict
- UNDERPRICED
- Comps
- 5 within 1.0 mi
Projected returns pro-forma
-3.0% appreciation · 2.91% rent growth · sell at horizon
- IRR
- -28.9%
- Equity multiple
- 0.04×
- Total profit
- $-144,767
- Equity at exit
- $80,173
- IRR
- -29.2%
- Equity multiple
- -0.34×
- Total profit
- $-201,250
- Equity at exit
- $46,490
Cash invested: $150,556 (down + closing). Projections, not guarantees.
Landlord ↔ Tenant lean methodology
- Overall (STATE)
- 46 Balanced
- State Minnesota
- 46 Balanced · D+2
- County
- — inherits STATE
- City
- — inherits STATE
ZIP-level market 55129
- Home prices YoY
- -24.4%
- Rents YoY
- 2.9%
- Active inventory
- 356
- Price-to-rent
- 13.3×
Monthly cashflow live
- Estimated rent
- $3,375 high interval (Pro) →
- Mortgage (P&I)
- −$2,820
- Tax from tax record
- −$499 /mo · $5,990/yr
- Insurance
- −$224
- HOA
- −$23
- Vacancy / Maint / Mgmt
- −$709
- Net cashflow
- $-900
Break-even live
UW: 25.0% down · 7.5% · 30yr · 1.5% tax · 5.0% vac · 8.0% maint · 8.0% mgmt
Financing live
Cash to close
- Down payment
- $134,425
- Closing costs
- $16,131
- Reserves months
- —
- Total cash needed
- —
Loan-product check · same deal, 3 products live
Conventional
25% down · 7.5% · 30yr
- Down + closing
- —
- Monthly P&I
- —
- Monthly cashflow
- —
- DSCR
- —
- Eligible?
- —
Personal DTI + credit; lowest rate.
DSCR
20% down · 8.5% · 30yr
- Down + closing
- —
- Monthly P&I
- —
- Monthly cashflow
- —
- DSCR
- —
- Eligible?
- —
No personal income docs; deal must DSCR.
Hard money
10% down · 12.0% · 12mo
- Down + closing
- —
- Monthly P&I
- —
- Monthly cashflow
- —
- DSCR
- —
- Eligible?
- —
Short-term bridge; refi at stabilization.
Rent comps 6 comps
| Address | Beds | Baths | Sqft | Rent | $/sqft | DOM | Units | Dist |
|---|---|---|---|---|---|---|---|---|
| 10108 Sunbird Cir Saint Paul, MN | 2.0–4.0 | 2.0–3.0 | 1815 | $3,700 | $2.04 | 1d | 7 | 0.64mi |
| 10692 Wiles Way Saint Paul, MN | 3.0 | 3.0 | 1777 | $2,600 | $1.46 | 43d | 1 | 1.01mi |
| 4644 Oak Point Ln Saint Paul, MN | 2.0–5.0 | 2.0–3.5 | 2239 | $4,160 | $1.86 | 1d | 7 | 1.06mi |
| 10540 67th St S Cottage Grove, MN | 4.0 | 3.0 | 2954 | $3,400 | $1.15 | 43d | 1 | 1.12mi |
| 5275 Long Pointe Pass Saint Paul, MN | 3.0 | 2.5 | 1782 | $2,500 | $1.40 | 43d | 1 | 1.15mi |
| 7191 Joplin Ave S Cottage Grove, MN | 4.0 | 2.0 | 2096 | $2,795 | $1.33 | 44d | 1 | 1.46mi |
HOA detail
- Monthly dues
- $23 · $276/yr
Listing history 22 events
-
2026-06-17status $537,700 Pending 50 DOM
-
2026-06-16days on market $537,700 Contingent - Inspection 50 DOM
-
2026-06-15days on market $537,700 Contingent - Inspection 49 DOM
-
2026-06-13days on market $537,700 Contingent - Inspection 47 DOM
-
2026-06-13days on market $537,700 Contingent - Inspection 46 DOM
-
2026-06-09days on market $537,700 Contingent - Inspection 43 DOM
-
2026-06-08days on market $537,700 Contingent - Inspection 42 DOM
-
2026-06-08status $537,700 Contingent - Inspection 41 DOM
-
2026-06-07days on market $537,700 Active 41 DOM
-
2026-06-04days on market $537,700 Active 38 DOM
-
2026-06-03days on market $537,700 Active 37 DOM
-
2026-06-02days on market $537,700 Active 36 DOM
-
2026-06-01days on market $537,700 Active 35 DOM
-
2026-05-31days on market $537,700 Active 34 DOM
-
2026-04-27$537,700 Active 1735-char remark
-
2026-04-27historical
-
2026-03-16price $539,700
-
2026-02-18$550,000 Active
-
2026-02-16historical
-
2019-11-08soldstatus $417,350 Sold
Show marketing remark (62 chars)
Sold Home One of our most popular plans! Columbus Floor plan
-
2019-09-20status Pending
Show marketing remark (62 chars)
Sold Home One of our most popular plans! Columbus Floor plan
-
2019-09-20$414,990 Active
Show marketing remark (62 chars)
Sold Home One of our most popular plans! Columbus Floor plan
ⓘ Source: listings_history table (triggers on properties + properties_extension) + one-shot
backfill from property_details.listing_events for pre-trigger history.
Tax reassessment forecast MN · Partial reset (capped growth)
- Current annual tax
- $5,990 · $499/mo
- Projected year-2 tax
- $6,006 · $501/mo
- Expected delta
- +$16/yr (+$1/mo · 0.3%)
ⓘ Screening estimate from a state-policy table — verify with the county assessor before closing.
Climate risk First Street
- Flood 1/10 Low FEMA zone X (unshaded) · 0% chance over 30 yrs
- Wildfire 2/10 Low
- Heat 2/10 Low 7 d/yr ≥98°F today · 14 d/yr by 30 yrs out
- Wind 2/10 Low
- Air quality 2/10 Low 1 unhealthy d/yr today · 1 by 30 yrs out
Nearby sold comps map
Loading sold comps map…
Walkable amenities ~0.75 mi
Loading nearby amenities…
Taxation est. · year 1
- Rental income
- $40,503
- − Mortgage interest
- −$30,120
- − Property taxes
- −$5,990
- − Insurance
- −$2,688
- − Repairs & maintenance
- −$3,240
- − Management
- −$3,240
- − HOA
- −$276
- − Depreciation
- −$15,642
- Taxable loss
- −$20,694
- Est. tax savings @ 24.0%
- +$4,966
- After-tax cash flow
- $-5,828/yr
For passive investors: Depreciation is non-cash, so a rental often shows a tax loss while cash-flowing — sheltering income. Rental losses are passive: they offset passive income freely, and up to $25,000/yr can offset ordinary (W-2) income if you actively participate and your MAGI is under $100k (phasing out to $0 by $150k); unused losses carry forward. On sale, claimed depreciation is recaptured at up to 25%, and gains may owe capital-gains tax (a 1031 exchange can defer both). Figures are a year-1 estimate at your 24.0% rate — not tax advice; consult a CPA.
Schools (NCES district)
- District
- South Washington County School District
- NCES district ID
- 2733810
- Math proficiency
- 52% ▼ -13.00%
- Reading proficiency
- 61% ▼ -7.00%
- Median HH income
- $88,285
- Composite
- 51.8/100
- National rank
- #1670
- State rank
- #40 of 301 in MN
Livability — Woodbury
- Score
- 89/100
- State rank
- #6
- US rank
- #153
Category grades
Schools grade is shown separately in the Schools card above.
Census & demographics
- Census place
- Woodbury, MN
- County
- Washington County · 235,613 people
- City population
- 78,305
- Metro
- Minneapolis-St. Paul-Bloomington, MN-WI
- Population (ZIP)
- 34,120
- Household income
- $143,795
- Rent vs Own
- Severe rent burden
- 639.0
Population outlook (Washington County) Hauer SSP2
- Today (2025)
- 278,554 people
- By 2030
- 290,465 · +4.3%
- By 2040
- 310,014 · +11.3%
- By 2050
- 324,118 · +16.4%
- By 2075
- 362,697 · +30.2%
- By 2100
- 381,491 · +37.0%
Race, ethnicity, and origin ACS 2023
- Neighborhood character
- Predominantly White (66%)
- Race & ethnicity
- White 66% Asian 17% Black 8% Two or more races 5% Hispanic / Latino 3%
- Common ancestry
- Portuguese 8% Romanian 5% Lithuanian 2%
- Foreign-born
- 16% · Canada, China, Vietnam
- Languages at home
- 77% English-only · Other Indo-European 5% Other Asian/Pacific 5% Spanish 3%
Political lean MEDSL · Washington
- 2024 margin
- Lean D (+8.9) · D 53.5% · R 44.6% · Other 1.9%
- 2008→2024 swing
- +4.6pp toward D · 2008: 4.3pp · 2024: 8.9pp
- All cycles
- 2024: D+8.9 2020: D+9.2 2016: D+1.9 2012: D+0.8 2008: D+4.3
Not yet ingested
- Civics
- —
Market trends
- HPI YoY
- ▼ -69.89%
- Current HPI
- 216.0248
- Rent YoY
- ▲ 2.91%
- Metro
- Minneapolis-St. Paul-Bloomington, MN-WI
- State GDP YoY
- ▲ 2.41%
- F500 in state
- 34
Industry mix (Fortune 500 HQ in MN)
| Industry | F500 HQs | Revenue |
|---|---|---|
| Healthcare | 2 | $407B |
|
||
| Retail | 2 | $150B |
|
||
| Consumer Goods | 2 | $32B |
|
||
| Industrial Machinery | 2 | $6B |
|
||
| Agriculture | 1 | $40B |
|
||
| Healthcare / Medical Devices | 1 | $32B |
|
||
Price history
+29.6% since first listed10 events — show timeline
- 2026-06-17 Pending — NORTHSTARMLS as Distributed by MLS Grid
- 2026-06-08 Contingent — NORTHSTARMLS as Distributed by MLS Grid
- 2026-04-27 Listing Removed — NORTHSTARMLS as Distributed by MLS Grid
- 2026-04-27 Listed $537,700 NORTHSTARMLS as Distributed by MLS Grid
- 2026-03-16 Price Changed $539,700 NORTHSTARMLS as Distributed by MLS Grid
- 2026-02-18 Listed $550,000 NORTHSTARMLS as Distributed by MLS Grid
- 2026-02-16 Coming Soon — NORTHSTARMLS as Distributed by MLS Grid
- 2019-11-08 Sold (MLS) $417,350 NORTHSTARMLS as Distributed by MLS Grid
- 2019-09-20 Pending — NORTHSTARMLS as Distributed by MLS Grid
- 2019-09-20 Listed $414,990 NORTHSTARMLS as Distributed by MLS Grid
Property tax history
+56.1%/yrLatest (2025): $5,990 · +3.0% YoY. Source: county tax records.
Cash-flow waterfall
monthlySold comps — $/sqft
last 12 mo · ≤1 miLoading sold comps…