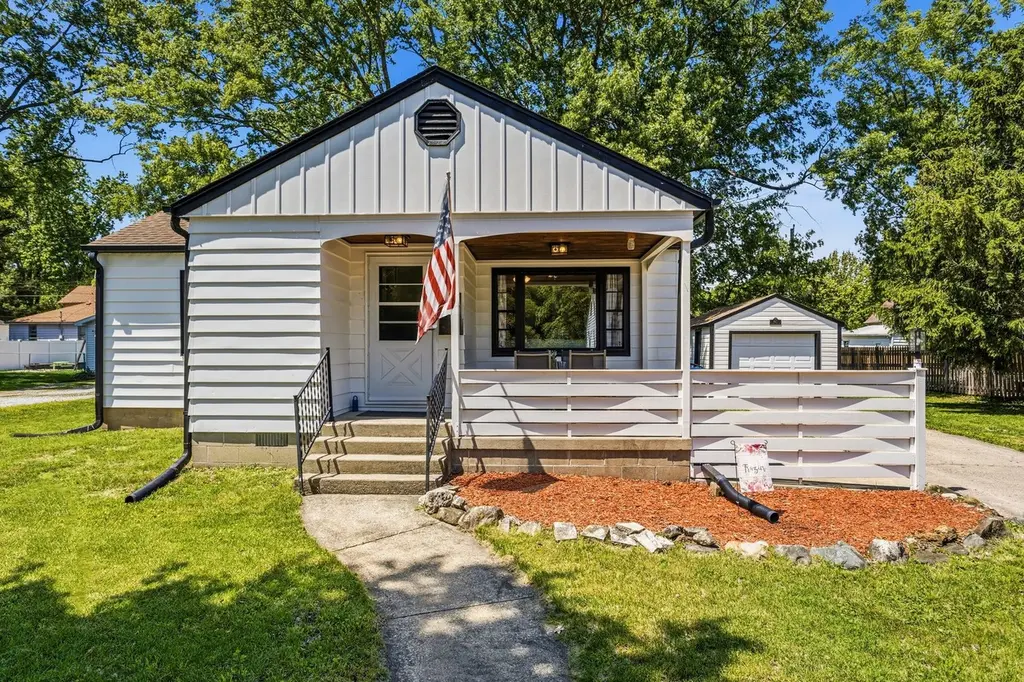
442 S Hamilton St · Monticello, IL
Flood risk 5/10 · Moderate
- FEMA flood zone
- X (unshaded)
- Chance of flooding over 30 yrs
- 0.66%
- Est. flood insurance / yr
- $473 – $860
Fire risk 1/10 · Minimal
- Est. fire insurance / yr
- $804 – $1,492
Heat risk 3/10 · Minor
- Hot days now (above 104°F)
- 7 days/yr
- Hot days in 30 yrs
- 19 days/yr
Wind risk 2/10 · Minimal
- Chance of severe wind over 30 yrs
- 1.0%
Air-quality risk 2/10 · Minimal
- Unhealthy air days now
- 1 days/yr
- Unhealthy air days in 30 yrs
- 1 days/yr
Risk factors via First Street. Map © Google.
Why this score? — see what drove the D+ grade
The composite is a weighted blend of 9 inputs, each scored 0–100. Each bar is that input's sub-score; the figure is the points it added to the 100-point composite (weight × sub-score).
- Cash flow +21.1/30.0
- DSCR +6.7/10.0
- 1% rule +4.7/10.0
- ARV discount +4.7/15.0
- Livability +4.1/5.0
- Schools +3.7/10.0
- Rent growth +2.5/5.0
- Condition / age +2.5/5.0
- Appreciation +0.0/10.0
$155,000
🖨 Deal sheet 📄 Offer letter ✓ Due diligence
Listing remarks MLS
sold at list.
Key facts
- 0.24 acre lot
- Garage
Property features AI
Finance
- Other: Fee simple ownership; Possession at closing
- HOA & community: No master association fees
Exterior
- Parking: Detached garage (1 garage space; 1 total parking space); Garage owned
- Utilities: Public water; Public sewer
- Home design: Detached single-family home; One-story
- Construction: Vinyl siding; Built before 1978
- Exterior features: Lot approximately 110 x 95; Less than 0.25 acre lot
Interior
- Kitchen: Kitchen (14 x 12)
- Bedrooms: 3 bedrooms (master, plus bedroom 2 - 11 x 10, bedroom 3, bedroom 4) — main level
- Bathrooms: 1 full bathroom
- Heating & cooling: Steam heating; Window air conditioning units
- Interior features: Unfinished full basement; 4 total rooms
- Laundry & utility: Dedicated laundry room
Neighborhood map
What this means for you Summary
Snapshot
- This is a 2-bed/1.0-bath single-family listed at $155k.
Deal economics
- At list price, monthly cash flow is $222 ($3k/yr) — positive.
- The deal already cash-flows at list — no discount required.
- To meet the 1% rule (rent ≥ 1% of price), the offer needs to be $150k (3.4% below list).
- Recommended offer: $150k (3.4% below list) — sets the bar for 1% rule.
- Cap rate 8.0% vs local median 3.5% in Monticello — top-decile yield for the area; either an underpriced asset or a hidden risk that comps aren't pricing in. Stress-test before assuming the spread holds.
Location & tenants
- Location reads 82/100 on livability (#69 in IL, #1,132 nationally) — a professional / high-income tenant draw. Strengths: crime A+, employment A+, cost of living A+; Watch: amenities F, commute F.
- Monticello CUSD 25 (town): math 30% / reading 51% proficiency, ranked #123 of 620 in IL (top 20%) — families likely to look elsewhere, expect single-tenant / working-renter base with shorter leases; only 15% free/reduced lunch — higher-income household profile.
- Zoned schools: Monticello Middle School (math 25% / reading 56%, grade F, #136 of 665 statewide, top 21%, 379 students, 0% FRL); Monticello High School (math 32% / reading 42%, grade F, #107 of 693 statewide, top 17%, 476 students, 0% FRL) — zoned schools average 0% FRL vs 15% district-wide (15 pts lower); this property's tenant base skews higher-income than the district average.
- Market conditions: 47 active listings in the ZIP; 34 units permitted in Piatt County in 2024 (0 in 5+ unit buildings).
Forward outlook
- Local home prices are declining (-3.0%/yr); year-one equity from $1k of loan paydown is wiped out by about $5k of value loss. Plan a longer hold.
- Piatt County population projected at -19% by 2050 — secular population decline; favor cash flow + early exit over multi-decade hold.
Negotiation context
- Only 1 days on market — expect competitive offers; lowballing is unlikely to land.
- 3 sale attempts since 3y ago with the ask held roughly flat each time — persistent listings suggest the price (not the market) is what's stuck; bring a comps-based counter.
Risks & watch-outs
- Climate carrying-cost: moderate flood risk — expect insurance premiums to compound above CPI over the hold.
Questions for the listing agent
- Is there a deadline driving the sale (1031 exchange, divorce, estate, relocation)? That informs how much negotiation room exists.
- Schools are B-rated — typically a magnet for longer-tenancy family renters. What's the average tenant stay here, and is there a school-zone premium baked into asking?
- The area grade is low — what's the realistic commute time and amenity access for the typical tenant pool here? Any planned neighborhood developments (good or bad) we should know about?
- What's the average days-on-market for RENTAL listings here right now (not sales)? A rising rental-DOM trend means longer vacancies and softer asking-rent achievability than the comps imply.
- What's the recent tenant-quality profile in this submarket — average credit score on applications, eviction rate, late-payment / NSF rate, and stable-employment percentage? A property-management company in the area should have these aggregated.
- How much new for-sale + rental construction is in the pipeline within 1–3 miles? Heavy new supply typically softens prices + rents 12–24 months out; constrained supply supports both.
Investment metrics
- 1% rule
- 0.97% ✗
- Cap rate
- 8.01%
- Cash-on-cash
- 6.13%
- DSCR
- 1.27
- GRM
- 8.6
CMA / ARV
- ARV (on-the-fly)
- $145,791
- Comps found
- 12
Show comp detail 12 sales within ~0.75 mi
| Address | Dist | Beds/Ba | Sqft | Sold | Price | $/sf | Match |
|---|---|---|---|---|---|---|---|
| 442 S Hamilton St | 0.00mi | 2/1.0 | 873 (0%) | 0mo | $145,000 | $166 | 100 |
| 708 S Emerson St | 0.16mi | 3/1.0 (+1) | 880 (+1%) | 6mo | $179,000 | $203 | 81 |
| 707 Emerson St | 0.18mi | 3/1.0 (+1) | 864 (-1%) | 8mo | $128,000 | $148 | 78 |
| 419 S Hamilton St | 0.06mi | 2/1.0 | 956 (+10%) | 6mo | $85,000 | $89 | 77 |
| 411 E Lincoln St | 0.50mi | 2/1.0 | 840 (-4%) | 1mo | $139,950 | $167 | 70 |
| 413 E Lincoln St | 0.51mi | 2/1.0 | 902 (+3%) | 3mo | $160,000 | $177 | 68 |
| 708 E Center St | 0.46mi | 1/1.0 (-1) | 845 (-3%) | 0mo | $145,000 | $172 | 68 |
| 809 S Longview Rd | 0.23mi | 3/1.0 (+1) | 986 (+13%) | 7mo | $210,000 | $213 | 57 |
| 517 N Buchanan St | 0.50mi | 2/1.0 | 919 (+5%) | 15mo | $176,000 | $192 | 55 |
| 309 E Lincoln St | 0.50mi | 2/1.0 | 953 (+9%) | 14mo | $135,000 | $142 | 50 |
| 718 W Bristow St | 0.52mi | 2/1.0 | 986 (+13%) | 10mo | $148,000 | $150 | 46 |
| 116 E High St | 0.47mi | 2/1.0 | 1,002 (+15%) | 17mo | $159,900 | $160 | 39 |
Match score weights: distance 35% · size 25% · config 20% · recency 20%. Top-matched comps best support the ARV.
Projected returns pro-forma
-3.0% appreciation · 3.0% rent growth · sell at horizon
- IRR
- -6.9%
- Equity multiple
- 0.75×
- Total profit
- $-11,047
- Equity at exit
- $23,111
- IRR
- 2.7%
- Equity multiple
- 1.19×
- Total profit
- $8,371
- Equity at exit
- $13,402
Cash invested: $43,400 (down + closing). Projections, not guarantees.
Landlord ↔ Tenant lean methodology
- Overall (STATE)
- 43 Moderately Tenant-Leaning
- State Illinois
- 43 Moderately Tenant-Leaning · D+7
- County
- — inherits STATE
- City
- — inherits STATE
ZIP-level market 61856
- Active inventory
- 47
- Price-to-rent
- 8.6×
Monthly cashflow live
- Estimated rent
- $1,497 medium interval (Pro) →
- Mortgage (P&I)
- −$813
- Tax from tax record
- −$83 /mo · $1,001/yr
- Insurance
- −$65
- HOA
- −$0
- Vacancy / Maint / Mgmt
- −$314
- Net cashflow
- $222
Break-even live
UW: 25.0% down · 7.5% · 30yr · 1.5% tax · 5.0% vac · 8.0% maint · 8.0% mgmt
Financing live
Cash to close
- Down payment
- $38,750
- Closing costs
- $4,650
- Reserves months
- —
- Total cash needed
- —
Loan-product check · same deal, 3 products live
Conventional
25% down · 7.5% · 30yr
- Down + closing
- —
- Monthly P&I
- —
- Monthly cashflow
- —
- DSCR
- —
- Eligible?
- —
Personal DTI + credit; lowest rate.
DSCR
20% down · 8.5% · 30yr
- Down + closing
- —
- Monthly P&I
- —
- Monthly cashflow
- —
- DSCR
- —
- Eligible?
- —
No personal income docs; deal must DSCR.
Hard money
10% down · 12.0% · 12mo
- Down + closing
- —
- Monthly P&I
- —
- Monthly cashflow
- —
- DSCR
- —
- Eligible?
- —
Short-term bridge; refi at stabilization.
Listing history 13 events
-
2026-05-15status Pending
-
2026-05-14$155,000 Active
-
2024-05-31soldstatus $139,900
-
2024-03-13soldstatus $70,000 Closed 13-char remark
Show marketing remark (13 chars)
sold at list.
-
2024-03-04status Pending 13-char remark
Show marketing remark (13 chars)
sold at list.
-
2024-03-04historical 13-char remark
Show marketing remark (13 chars)
sold at list.
-
2024-02-21status Pending 13-char remark
Show marketing remark (13 chars)
sold at list.
-
2024-02-21$70,000 Active 13-char remark
Show marketing remark (13 chars)
sold at list.
-
2023-05-16historical 31-char remark
Show marketing remark (31 chars)
There are no remarks available.
-
2023-05-16soldstatus $79,900 Closed 31-char remark
Show marketing remark (31 chars)
There are no remarks available.
-
2023-05-16soldstatus $70,000
Show marketing remark (31 chars)
There are no remarks available.
-
2023-03-22status Pending 31-char remark
Show marketing remark (31 chars)
There are no remarks available.
-
2023-03-21$79,900 Active 31-char remark
Show marketing remark (31 chars)
There are no remarks available.
ⓘ Source: listings_history table (triggers on properties + properties_extension) + one-shot
backfill from property_details.listing_events for pre-trigger history.
Tax reassessment forecast IL · Partial reset (capped growth)
- Current annual tax
- $1,001 · $83/mo
- Projected year-2 tax
- $2,260 · $188/mo
- Expected delta
- +$1,259/yr (+$105/mo · 125.7%)
ⓘ Screening estimate from a state-policy table — verify with the county assessor before closing.
Climate risk First Street
- Flood 5/10 Major FEMA zone X (unshaded) · 66% chance over 30 yrs
- Wildfire 1/10 Low
- Heat 3/10 Moderate 7 d/yr ≥104°F today · 19 d/yr by 30 yrs out
- Wind 2/10 Low 100% chance of damaging wind over 30 yrs
- Air quality 2/10 Low 1 unhealthy d/yr today · 1 by 30 yrs out
Nearby sold comps map
Loading sold comps map…
Walkable amenities ~0.75 mi
Loading nearby amenities…
Taxation est. · year 1
- Rental income
- $17,961
- − Mortgage interest
- −$8,682
- − Property taxes
- −$1,001
- − Insurance
- −$775
- − Repairs & maintenance
- −$1,437
- − Management
- −$1,437
- − Depreciation
- −$4,509
- Taxable income
- $120
- Est. tax owed @ 24.0%
- −$29
- After-tax cash flow
- $2,631/yr
For passive investors: Depreciation is non-cash, so a rental often shows a tax loss while cash-flowing — sheltering income. Rental losses are passive: they offset passive income freely, and up to $25,000/yr can offset ordinary (W-2) income if you actively participate and your MAGI is under $100k (phasing out to $0 by $150k); unused losses carry forward. On sale, claimed depreciation is recaptured at up to 25%, and gains may owe capital-gains tax (a 1031 exchange can defer both). Figures are a year-1 estimate at your 24.0% rate — not tax advice; consult a CPA.
Schools (NCES district)
- District
- Monticello CUSD 25
- NCES district ID
- 1726550
- Math proficiency
- 30% ▼ -10.00%
- Reading proficiency
- 51% ▼ -5.00%
- Median HH income
- $69,919
- Composite
- 36.73/100
- National rank
- #4590
- State rank
- #123 of 620 in IL
Livability — Monticello
- Score
- 82/100
- State rank
- #69
- US rank
- #1132
Category grades
Schools grade is shown separately in the Schools card above.
Census & demographics
- Census place
- Monticello, IL
- City population
- 8,110
- Population (ZIP)
- 8,110
Population outlook (Piatt County) Hauer SSP2
- Today (2025)
- 15,501 people
- By 2030
- 14,978 · -3.4%
- By 2040
- 13,805 · -10.9%
- By 2050
- 12,563 · -19.0%
- By 2075
- 9,916 · -36.0%
- By 2100
- 7,295 · -52.9%
Race, ethnicity, and origin ACS 2023
- Neighborhood character
- Predominantly White (95%)
- Race & ethnicity
- White 95% Black 3% Two or more races 2% Hispanic / Latino 1%
- Common ancestry
- Slovak 3% Italian 3% Iranian 1%
- Foreign-born
- 1% · Canada
- Languages at home
- 99% English-only · Spanish 1%
Political lean MEDSL · Piatt
- 2024 margin
- Solid R (+30.5) · D 33.7% · R 64.3% · Other 2.0%
- 2008→2024 swing
- -18.0pp toward R · 2008: -12.6pp · 2024: -30.5pp
- All cycles
- 2024: R+30.5 2020: R+29.6 2016: R+33.6 2012: R+26.8 2008: R+12.6
Not yet ingested
- Civics
- —
Market trends
- HPI YoY
- ▼ -100.96%
- Current HPI
- 160.6145
- Rent YoY
- —
- Metro
- —
- State GDP YoY
- ▲ 1.59%
- F500 in state
- 60
Industry mix (Fortune 500 HQ in IL)
| Industry | F500 HQs | Revenue |
|---|---|---|
| Insurance | 4 | $201B |
|
||
| Consumer Goods | 4 | $87B |
|
||
| Industrial Machinery | 3 | $64B |
|
||
| Healthcare | 2 | $55B |
|
||
| Retail / Pharmacy | 1 | $148B |
|
||
| Agriculture / Food | 1 | $86B |
|
||
Price history
+94.0% since first listed13 events — show timeline
- 2026-05-15 Pending — MRED as Distributed by MLS Grid
- 2026-05-14 Listed $155,000 MRED as Distributed by MLS Grid
- 2024-05-31 Sold (Public Records) $139,900 Public Records
- 2024-03-13 Sold (MLS) $70,000 MRED as Distributed by MLS Grid
- 2024-03-04 Pending — MRED as Distributed by MLS Grid
- 2024-03-04 Listing Removed — MRED as Distributed by MLS Grid
- 2024-02-21 Pending — MRED as Distributed by MLS Grid
- 2024-02-21 Listed $70,000 MRED as Distributed by MLS Grid
- 2023-05-16 Listing Removed — MRED as Distributed by MLS Grid
- 2023-05-16 Sold (Public Records) $70,000 Public Records
- 2023-05-16 Sold (MLS) $79,900 MRED as Distributed by MLS Grid
- 2023-03-22 Pending — MRED as Distributed by MLS Grid
- 2023-03-21 Listed $79,900 MRED as Distributed by MLS Grid
Property tax history
-2.3%/yrLatest (2024): $1,001 · -25.9% YoY. Source: county tax records.
Cash-flow waterfall
monthlySold comps — $/sqft
last 12 mo · ≤1 miLoading sold comps…