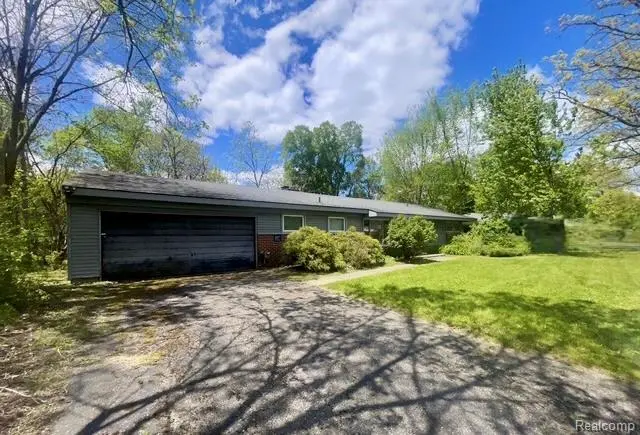
7166 Cottonwood Knoll Knl · Farmington Hills, MI
Flood risk 1/10 · Minimal
- FEMA flood zone
- X (unshaded)
- Chance of flooding over 30 yrs
- 0.0%
- Est. flood insurance / yr
- $507 – $1,088
Fire risk 1/10 · Minimal
- Est. fire insurance / yr
- $784 – $1,456
Heat risk 2/10 · Minimal
- Hot days now (above 96°F)
- 7 days/yr
- Hot days in 30 yrs
- 14 days/yr
Wind risk 2/10 · Minimal
- Chance of severe wind over 30 yrs
- —
Air-quality risk 3/10 · Minor
- Unhealthy air days now
- 2 days/yr
- Unhealthy air days in 30 yrs
- 4 days/yr
Risk factors via First Street. Map © Google.
Why this score? — see what drove the B grade
The composite is a weighted blend of 9 inputs, each scored 0–100. Each bar is that input's sub-score; the figure is the points it added to the 100-point composite (weight × sub-score).
- Cash flow +27.0/30.0
- ARV discount +15.0/15.0
- DSCR +9.3/10.0
- 1% rule +8.4/10.0
- Schools +4.6/10.0
- Livability +4.0/5.0
- Condition / age +2.5/5.0
- Rent growth +2.4/5.0
- Appreciation +0.0/10.0
$199,900
🖨 Deal sheet 📄 Offer letter ✓ Due diligence
Listing remarks MLS
Welcome to this ranch-style home in the heart of West Bloomfield offering 1,846 sq ft of comfortable living space! This home features 3 spacious bedrooms, 2 full bathrooms, and a 2-car attached garage. The bright and inviting living room is filled with natural light, creating a warm and welcoming atmosphere. The kitchen offers ample counter and cabinet space, making it ideal for meal prepping and everyday cooking. Step outside to enjoy a generous backyard perfect for family cookouts, entertaining guests, or creating your dream garden. Conveniently located near shopping, dining, parks, and top-rated schools, this home is ready for its next owner to make lasting memories. * * * CASH OFFERS ONLY * * *
Key facts
- Ample counter space
- Natural light
- Ranch-style home
Tags
Property features AI
Exterior
- Parking: Attached garage with 2 spaces
- Utilities: Public water; Public sewer
- Home design: Single-family residence; One story; Ground-level entry with steps
- Construction: Vinyl siding; Slab foundation
- Exterior features: Back yard fencing; Paved road access
Interior
- Bathrooms: Two full bathrooms
- Heating & cooling: Forced air heating (natural gas); No central cooling
- Interior features: Five total rooms
Neighborhood map
What this means for you Summary
Snapshot
- This is a 3-bed/2.0-bath single-family listed at $200k.
Deal economics
- At list price, monthly cash flow is $560 ($7k/yr) — positive.
- The deal already cash-flows at list — no discount required.
- Meets the 1% rule at list price ($3k rent vs $200k).
- Cap rate 9.7% vs local median 3.5% in Farmington Hills — top-decile yield for the area; either an underpriced asset or a hidden risk that comps aren't pricing in. Stress-test before assuming the spread holds.
Location & tenants
- Location reads 81/100 on livability (#64 in MI, #1,364 nationally) — a professional / high-income tenant draw. Strengths: employment A+, housing A+, crime A; Watch: amenities D, health & safety F.
- Farmington Public School District (urban): math 45% / reading 58% proficiency, ranked #78 of 540 in MI (top 14%) — acceptable for families but not a draw, mixed tenant base, ~2y average lease; only 19% free/reduced lunch — higher-income household profile.
- Market conditions: Rents soft (-0.4%/yr); 181 active listings in the ZIP; 7 comparable units currently listed for rent nearby; rentals leasing fast (median 2d on market — plan ~1-2 weeks tenant-placement turnaround); high-income renter base; 2,614 units permitted in Oakland County in 2024 (721 in 5+ unit buildings).
Forward outlook
- Local home prices are declining (-3.0%/yr); year-one equity from $1k of loan paydown is wiped out by about $6k of value loss. Plan a longer hold.
- Oakland County population projected at +10% by 2050 — modest demand growth; plan on rents tracking national, not racing it.
Negotiation context
- Only 7 days on market — expect competitive offers; lowballing is unlikely to land.
- 2 sale attempts with the ask held roughly flat each time — persistent listings suggest the price (not the market) is what's stuck; bring a comps-based counter.
Risks & watch-outs
- Watch-outs: property tax is 2.6% of price; built in 1954 — expect roof / HVAC / electrical / plumbing capex.
Questions for the listing agent
- Built in 1954 — when were the roof, HVAC, electrical panel, plumbing, and water heater last replaced?
- Property tax is high relative to price — has the assessment been appealed recently, and will the sale trigger a re-assessment?
- Is there a deadline driving the sale (1031 exchange, divorce, estate, relocation)? That informs how much negotiation room exists.
- Schools are B-rated — typically a magnet for longer-tenancy family renters. What's the average tenant stay here, and is there a school-zone premium baked into asking?
- What's the average days-on-market for RENTAL listings here right now (not sales)? A rising rental-DOM trend means longer vacancies and softer asking-rent achievability than the comps imply.
- What's the recent tenant-quality profile in this submarket — average credit score on applications, eviction rate, late-payment / NSF rate, and stable-employment percentage? A property-management company in the area should have these aggregated.
- How much new for-sale + rental construction is in the pipeline within 1–3 miles? Heavy new supply typically softens prices + rents 12–24 months out; constrained supply supports both.
Investment metrics
- 1% rule
- 1.34% ✓
- Cap rate
- 9.65%
- Cash-on-cash
- 12.00%
- DSCR
- 1.53
- GRM
- 6.2
CMA / ARV
- ARV (on-the-fly)
- $353,732
- Comps found
- 12
Show comp detail 12 sales within ~0.75 mi
| Address | Dist | Beds/Ba | Sqft | Sold | Price | $/sf | Match |
|---|---|---|---|---|---|---|---|
| 7396 Cornwall Ct | 0.19mi | 3/2.0 | 1,846 (-0%) | 1mo | $275,000 | $149 | 90 |
| 7159 Ward Eagle Dr | 0.25mi | 3/2.0 | 1,891 (+2%) | 12mo | $344,000 | $182 | 75 |
| 7411 N Briarcliff Knoll Dr | 0.29mi | 3/2.0 | 1,893 (+2%) | 18mo | $265,000 | $140 | 68 |
| 6709 Wild Ridge Ln | 0.43mi | 3/2.5 | 1,960 (+6%) | 1mo | $350,000 | $179 | 67 |
| 6974 Woodside Trl | 0.63mi | 3/2.0 | 1,900 (+3%) | 2mo | $395,000 | $208 | 65 |
| 5333 W Briarcliff Knoll Dr | 0.34mi | 3/2.0 | 1,984 (+7%) | 16mo | $430,000 | $217 | 58 |
| 5311 Cambourne Pl | 0.36mi | 3/2.5 | 2,062 (+11%) | 8mo | $359,900 | $175 | 56 |
| 7070 Riverstone Rd | 0.51mi | 3/2.0 | 2,077 (+12%) | 1mo | $413,000 | $199 | 55 |
| 6883 Tamerlane Dr | 0.35mi | 4/2.5 (+1) | 2,018 (+9%) | 11mo | $385,000 | $191 | 52 |
| 7496 Cornwall Ct | 0.35mi | 4/2.0 (+1) | 2,112 (+14%) | 7mo | $412,000 | $195 | 49 |
| 5402 Cambourne Pl | 0.24mi | 3/2.0 | 1,588 (-14%) | 20mo | $320,000 | $202 | 49 |
| 6600 Heather Heath Ln | 0.54mi | 3/2.5 | 1,960 (+6%) | 22mo | $365,000 | $186 | 45 |
Match score weights: distance 35% · size 25% · config 20% · recency 20%. Top-matched comps best support the ARV.
Projected returns pro-forma
-3.0% appreciation · 0.0% rent growth · sell at horizon
- IRR
- -2.2%
- Equity multiple
- 0.92×
- Total profit
- $-4,470
- Equity at exit
- $29,806
- IRR
- 3.5%
- Equity multiple
- 1.22×
- Total profit
- $12,199
- Equity at exit
- $17,284
Cash invested: $55,972 (down + closing). Projections, not guarantees.
Landlord ↔ Tenant lean methodology
- Overall (STATE)
- 62 Landlord-Friendly
- State Michigan
- 62 Landlord-Friendly · EVEN
- County
- — inherits STATE
- City
- — inherits STATE
ZIP-level market 48322
- Rents YoY
- -0.4%
- Active inventory
- 181
- Price-to-rent
- 6.2×
Monthly cashflow live
- Estimated rent
- $2,686 high interval (Pro) →
- Mortgage (P&I)
- −$1,048
- Tax from tax record
- −$431 /mo · $5,166/yr
- Insurance
- −$83
- HOA
- −$0
- Vacancy / Maint / Mgmt
- −$564
- Net cashflow
- $560
Break-even live
UW: 25.0% down · 7.5% · 30yr · 1.5% tax · 5.0% vac · 8.0% maint · 8.0% mgmt
Financing live
Cash to close
- Down payment
- $49,975
- Closing costs
- $5,997
- Reserves months
- —
- Total cash needed
- —
Loan-product check · same deal, 3 products live
Conventional
25% down · 7.5% · 30yr
- Down + closing
- —
- Monthly P&I
- —
- Monthly cashflow
- —
- DSCR
- —
- Eligible?
- —
Personal DTI + credit; lowest rate.
DSCR
20% down · 8.5% · 30yr
- Down + closing
- —
- Monthly P&I
- —
- Monthly cashflow
- —
- DSCR
- —
- Eligible?
- —
No personal income docs; deal must DSCR.
Hard money
10% down · 12.0% · 12mo
- Down + closing
- —
- Monthly P&I
- —
- Monthly cashflow
- —
- DSCR
- —
- Eligible?
- —
Short-term bridge; refi at stabilization.
Rent comps 7 comps
| Address | Beds | Baths | Sqft | Rent | $/sqft | DOM | Units | Dist |
|---|---|---|---|---|---|---|---|---|
| 6628 Heather Heath West Bloomfield, MI | 4.0 | 2.5 | 2604 | $3,000 | $1.15 | 10d | 1 | 0.48mi |
| 7020 Orchard Lake Rd West Bloomfield, MI | 1.0–3.0 | 1.0–2.5 | 1298 | $6,335 | $4.88 | 1d | 25 | 0.67mi |
| 7110 Orchard Lake Rd West Bloomfield Township, MI | 1.0–2.0 | 1.0–2.0 | 1020 | $2,650 | $2.60 | 1d | 13 | 0.70mi |
| 31200 Hunters Dr Farmington Hills, MI | 1.0–3.0 | 1.0–2.5 | 1520 | $2,363 | $1.55 | 1d | 15 | 0.90mi |
| 6625 Fireside Ct West Bloomfield Township, MI | 2.0 | 2.0 | 1450 | $2,000 | $1.38 | 24d | 1 | 0.97mi |
| 6322 Aspen Ridge Blvd West Bloomfield, MI | 2.0 | 2.5 | 2391 | $3,500 | $1.46 | 1d | 1 | 1.17mi |
| 4912 S Clunbury Rd West Bloomfield, MI | 3.0 | 2.5 | 1747 | $2,500 | $1.43 | 16d | 1 | 1.41mi |
Listing history 2 events
-
2026-05-22$199,900 Active
Show marketing remark (713 chars)
Welcome to this ranch-style home in the heart of West Bloomfield offering 1,846 sq ft of comfortable living space! This home features 3 spacious bedrooms, 2 full bathrooms, and a 2-car attached garage. The bright and inviting living room is filled with natural light, creating a warm and welcoming atmosphere. The kitchen offers ample counter and cabinet space, making it ideal for meal prepping and everyday cooking. Step outside to enjoy a generous backyard perfect for family cookouts, entertaining guests, or creating your dream garden. Conveniently located near shopping, dining, parks, and top-rated schools, this home is ready for its next owner to make lasting memories. * * * CASH OFFERS ONLY * * *
-
2026-05-22$199,900 Active 713-char remark
Show marketing remark (713 chars)
Welcome to this ranch-style home in the heart of West Bloomfield offering 1,846 sq ft of comfortable living space! This home features 3 spacious bedrooms, 2 full bathrooms, and a 2-car attached garage. The bright and inviting living room is filled with natural light, creating a warm and welcoming atmosphere. The kitchen offers ample counter and cabinet space, making it ideal for meal prepping and everyday cooking. Step outside to enjoy a generous backyard perfect for family cookouts, entertaining guests, or creating your dream garden. Conveniently located near shopping, dining, parks, and top-rated schools, this home is ready for its next owner to make lasting memories. * * * CASH OFFERS ONLY * * *
ⓘ Source: listings_history table (triggers on properties + properties_extension) + one-shot
backfill from property_details.listing_events for pre-trigger history.
Tax reassessment forecast MI · Partial reset (capped growth)
- Current annual tax
- $5,166 · $431/mo
- Projected year-2 tax
- $5,166 · $431/mo
- Expected delta
- $0/yr ($0/mo · 0.0%)
ⓘ Screening estimate from a state-policy table — verify with the county assessor before closing.
Climate risk First Street
- Flood 1/10 Low FEMA zone X (unshaded) · 0% chance over 30 yrs
- Wildfire 1/10 Low
- Heat 2/10 Low 7 d/yr ≥96°F today · 14 d/yr by 30 yrs out
- Wind 2/10 Low
- Air quality 3/10 Moderate 2 unhealthy d/yr today · 4 by 30 yrs out
Nearby sold comps map
Loading sold comps map…
Walkable amenities ~0.75 mi
Loading nearby amenities…
Taxation est. · year 1
- Rental income
- $32,229
- − Mortgage interest
- −$11,198
- − Property taxes
- −$5,166
- − Insurance
- −$1,000
- − Repairs & maintenance
- −$2,578
- − Management
- −$2,578
- − Depreciation
- −$5,815
- Taxable income
- $3,893
- Est. tax owed @ 24.0%
- −$934
- After-tax cash flow
- $5,781/yr
For passive investors: Depreciation is non-cash, so a rental often shows a tax loss while cash-flowing — sheltering income. Rental losses are passive: they offset passive income freely, and up to $25,000/yr can offset ordinary (W-2) income if you actively participate and your MAGI is under $100k (phasing out to $0 by $150k); unused losses carry forward. On sale, claimed depreciation is recaptured at up to 25%, and gains may owe capital-gains tax (a 1031 exchange can defer both). Figures are a year-1 estimate at your 24.0% rate — not tax advice; consult a CPA.
Schools (NCES district)
- District
- Farmington Public School District
- NCES district ID
- 2614070
- Math proficiency
- 45% ▼ -5.00%
- Reading proficiency
- 58% ▼ -1.00%
- Median HH income
- $72,846
- Composite
- 46.17/100
- National rank
- #2497
- State rank
- #78 of 540 in MI
Livability — Farmington Hills
- Score
- 81/100
- State rank
- #64
- US rank
- #1364
Category grades
Schools grade is shown separately in the Schools card above.
Census & demographics
- County
- Oakland County · 1,009,092 people
- City population
- 67,612
- Metro
- Detroit-Warren-Dearborn, MI
- Population (ZIP)
- 32,885
- Household income
- $113,865
- Rent vs Own
- Severe rent burden
- 911.0
Population outlook (Oakland County) Hauer SSP2
- Today (2025)
- 1,335,747 people
- By 2030
- 1,375,100 · +2.9%
- By 2040
- 1,435,385 · +7.5%
- By 2050
- 1,469,250 · +10.0%
- By 2075
- 1,531,946 · +14.7%
- By 2100
- 1,450,485 · +8.6%
Race, ethnicity, and origin ACS 2023
- Neighborhood character
- Majority White (64%)
- Race & ethnicity
- White 64% Black 20% Asian 10% Two or more races 5% Hispanic / Latino 3%
- Common ancestry
- Arab 9% Romanian 5% Scotch-Irish 4%
- Foreign-born
- 25% · Canada, China
- Languages at home
- 71% English-only · Arabic 8% Other Indo-European 5% Other Asian/Pacific 3%
Political lean MEDSL · Oakland
- 2024 margin
- D (+10.6) · D 54.4% · R 43.8% · Other 1.9%
- 2008→2024 swing
- -3.9pp toward R · 2008: 14.5pp · 2024: 10.6pp
- All cycles
- 2024: D+10.6 2020: D+14.1 2016: D+8.1 2012: D+8.1 2008: D+14.5
Not yet ingested
- Civics
- —
Market trends
- HPI YoY
- ▼ -220.52%
- Current HPI
- 149.0523
- Rent YoY
- ▼ -0.43%
- Metro
- Detroit-Warren-Dearborn, MI
- State GDP YoY
- ▲ 1.37%
- F500 in state
- 28
Industry mix (Fortune 500 HQ in MI)
| Industry | F500 HQs | Revenue |
|---|---|---|
| Automotive Parts | 3 | $48B |
|
||
| Automotive | 2 | $372B |
|
||
| Chemicals | 1 | $45B |
|
||
| Automotive Retail | 1 | $29B |
|
||
| Healthcare / Medical Devices | 1 | $23B |
|
||
| Automotive Technology | 1 | $20B |
|
||
Price history
+0.0% since first listed2 events — show timeline
- 2026-05-22 Listed $199,900 MiRealSource-MiMLS
- 2026-05-22 Listed $199,900 REALCOMP
Property tax history
+8.3%/yrLatest (2025): $5,166 · +65.4% YoY. Source: county tax records.
Cash-flow waterfall
monthlySold comps — $/sqft
last 12 mo · ≤1 miLoading sold comps…