Habgood Rd · Cuba, NY
Flood risk No data
- FEMA flood zone
- —
- Chance of flooding over 30 yrs
- —
- Est. flood insurance / yr
- —
Fire risk No data
- Est. fire insurance / yr
- —
Heat risk No data
- Hot days now (above threshold)
- —
- Hot days in 30 yrs
- —
Wind risk No data
- Chance of severe wind over 30 yrs
- —
Air-quality risk No data
- Unhealthy air days now
- —
- Unhealthy air days in 30 yrs
- —
Risk factors via First Street. Map © Google.
Why this score? — see what drove the D grade
The composite is a weighted blend of 9 inputs, each scored 0–100. Each bar is that input's sub-score; the figure is the points it added to the 100-point composite (weight × sub-score).
- Appreciation +10.0/10.0
- ARV discount +7.5/15.0
- Cash flow +7.4/30.0
- Schools +4.5/10.0
- Livability +3.7/5.0
- Rent growth +2.5/5.0
- Condition / age +2.5/5.0
- 1% rule +2.0/10.0
- DSCR +1.5/10.0
$112,000
🖨 Deal sheet (PDF) 📄 Offer letter ✓ Due diligence
Listing remarks
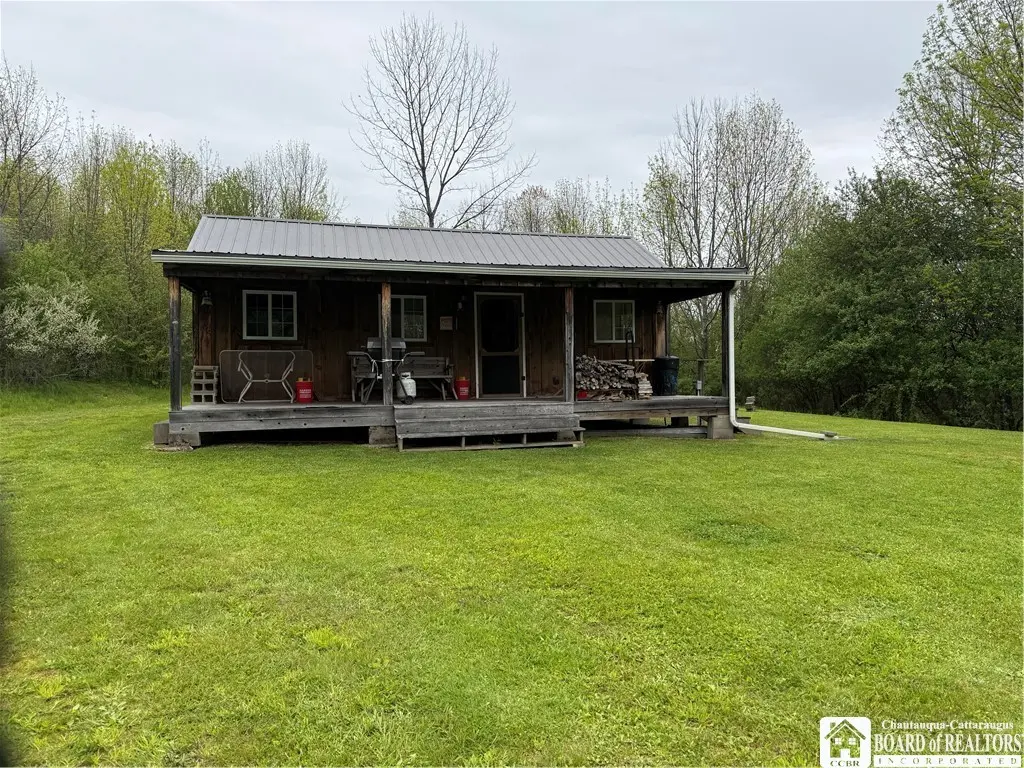
An oasis tucked away in rural Allegany County. Within minutes of state land, located on 6.3 acres this secluded cabin has all the essential amenities to make your camping experience a glamping experience. This cabin has propane heating, electric, running water, internet, septic and plumbing. This is a perfect get away from the hustle of modern life, relax and unwind with the fresh air, and the wildlife of rural America.
Key facts
- Propane heating
- Running water
- Plumbing
Tags
Property features AI
Exterior
- Parking: Dirt driveway access
- Utilities: Electricity available; Well water; Septic tank
- Home design: Single-story property
- Exterior features: Dirt driveway; County road frontage; Rectangular lot with gentle sloping; Rolling and sloping topography; see remarks
Interior
- Bathrooms: 1 full bathroom
- Interior features: Recreational use
Neighborhood map
What this means for you Summary
Snapshot
- This is a 1-bed/1.0-bath single-family listed at $112k.
Deal economics
- At list price, monthly cash flow is $-146 ($-2k/yr) — negative.
- To cash-flow at today's rent, offer at most $86k (23.0% below list).
- To meet the 1% rule (rent ≥ 1% of price), the offer needs to be $79k (29.6% below list).
- Recommended offer: $79k (29.6% below list) — sets the bar for 1% rule.
- Cap rate 4.7% vs local median 3.1% in Cuba — top-decile yield for the area; either an underpriced asset or a hidden risk that comps aren't pricing in. Stress-test before assuming the spread holds.
Location & tenants
- Location reads 73/100 on livability (#309 in NY) — a middle-class / working-renter tenant base. Strengths: cost of living A+, housing A+, health & safety A; Watch: employment D, amenities F, commute F.
- Cuba-Rushford Central School District (rural): math 44% / reading 61% proficiency, ranked #350 of 590 in NY (top 59%) — acceptable for families but not a draw, mixed tenant base, ~2y average lease.
- Zoned schools: Cuba-Rushford Elementary School (math 57% / reading 62%, grade B-, #745 of 2,108 statewide, top 39%, 363 students, 57% FRL); Cuba-Rushford Middle School (math 12% / reading 52%, grade F, #511 of 729 statewide, top 71%, 167 students, 54% FRL); Cuba-Rushford High School (math 95% / reading 84%, grade A+, #250 of 1,100 statewide, top 24%, 209 students, 53% FRL).
- Market conditions: 2 active listings in the ZIP; 87 units permitted in Allegany County in 2024 (0 in 5+ unit buildings).
Forward outlook
- In year one you build about $12k of equity ($774 loan paydown + $11k appreciation (10.0% local appreciation)).
- Allegany County population projected at -26% by 2050 — secular population decline; favor cash flow + early exit over multi-decade hold.
- By year 3, paydown + projected appreciation supports a ~$30k cash-out refi (75% LTV) — recoverable capital for the next deal without selling this one.
Negotiation context
- Only 12 days on market — expect competitive offers; lowballing is unlikely to land.
Questions for the listing agent
- What do current leases actually rent for vs. the listed asking? Can we see a recent rent roll and the last 12 months of T-12 income?
- Is there a deadline driving the sale (1031 exchange, divorce, estate, relocation)? That informs how much negotiation room exists.
- Schools are B-rated — typically a magnet for longer-tenancy family renters. What's the average tenant stay here, and is there a school-zone premium baked into asking?
- The area grade is low — what's the realistic commute time and amenity access for the typical tenant pool here? Any planned neighborhood developments (good or bad) we should know about?
- What's the average days-on-market for RENTAL listings here right now (not sales)? A rising rental-DOM trend means longer vacancies and softer asking-rent achievability than the comps imply.
- What's the recent tenant-quality profile in this submarket — average credit score on applications, eviction rate, late-payment / NSF rate, and stable-employment percentage? A property-management company in the area should have these aggregated.
- How much new for-sale + rental construction is in the pipeline within 1–3 miles? Heavy new supply typically softens prices + rents 12–24 months out; constrained supply supports both.
Investment metrics
- 1% rule
- 0.70% ✗
- Cap rate
- 4.73%
- Cash-on-cash
- -5.57%
- DSCR
- 0.75
- GRM
- 11.8
CMA / ARV
No comps found within radius.
Projected returns pro-forma
9.97% appreciation · 3.0% rent growth · sell at horizon
- IRR
- 20.3%
- Equity multiple
- 2.64×
- Total profit
- $51,486
- Equity at exit
- $100,630
- IRR
- 18.5%
- Equity multiple
- 6.07×
- Total profit
- $158,854
- Equity at exit
- $216,726
Cash invested: $31,360 (down + closing). Projections, not guarantees.
Landlord ↔ Tenant lean methodology
- Overall (STATE)
- 15 Strongly Tenant-Friendly
- State New York
- 15 Strongly Tenant-Friendly · D+10
- County
- — inherits STATE
- City
- — inherits STATE
ZIP-level market 14714
- Home prices YoY
- 3.0%
- Active inventory
- 2
- Price-to-rent
- 11.8×
Monthly cashflow live
- Estimated rent
- $789 medium interval (Pro) →
- Mortgage (P&I)
- −$587
- Tax from tax record
- −$135 /mo · $1,618/yr
- Insurance
- −$47
- HOA
- −$0
- Vacancy / Maint / Mgmt
- −$166
- Net cashflow
- $-146
Break-even live
Sensitivity live
| Price | -10% $-82 | -5% $-114 | +0% $-146 | +5% $-177 | +10% $-209 |
|---|---|---|---|---|---|
| Rent | -10% $-208 | -5% $-177 | +0% $-146 | +5% $-114 | +10% $-83 |
| Rate | -1.0pp $-89 | -0.5pp $-117 | base $-146 | +0.5pp $-175 | +1.0pp $-204 |
UW: 25.0% down · 7.5% · 30yr · 1.5% tax · 5.0% vac · 8.0% maint · 8.0% mgmt
Financing live
Cash to close
- Down payment
- $28,000
- Closing costs
- $3,360
- Reserves months
- —
- Total cash needed
- —
Loan-product check · same deal, 3 products live
Conventional
25% down · 7.5% · 30yr
- Down + closing
- —
- Monthly P&I
- —
- Monthly cashflow
- —
- DSCR
- —
- Eligible?
- —
Personal DTI + credit; lowest rate.
DSCR
20% down · 8.5% · 30yr
- Down + closing
- —
- Monthly P&I
- —
- Monthly cashflow
- —
- DSCR
- —
- Eligible?
- —
No personal income docs; deal must DSCR.
Hard money
10% down · 12.0% · 12mo
- Down + closing
- —
- Monthly P&I
- —
- Monthly cashflow
- —
- DSCR
- —
- Eligible?
- —
Short-term bridge; refi at stabilization.
Listing history 5 events
-
2026-06-04statusdays on market $112,000 Pending 12 DOM
-
2026-06-02days on market $112,000 Active 11 DOM
-
2026-06-01days on market $112,000 Active 10 DOM
-
2026-05-31days on market $112,000 Active 9 DOM
-
2026-05-22$112,000 Active
ⓘ Source: listings_history table (triggers on properties + properties_extension) + one-shot
backfill from property_details.listing_events for pre-trigger history.
Tax reassessment forecast NY · Partial reset (capped growth)
- Current annual tax
- $1,618 · $135/mo
- Projected year-2 tax
- $1,755 · $146/mo
- Expected delta
- +$137/yr (+$11/mo · 8.5%)
ⓘ Screening estimate from a state-policy table — verify with the county assessor before closing.
Nearby sold comps map
Loading sold comps map…
Walkable amenities ~0.75 mi
Loading nearby amenities…
Taxation est. · year 1
- Rental income
- $9,468
- − Mortgage interest
- −$6,274
- − Property taxes
- −$1,618
- − Insurance
- −$560
- − Repairs & maintenance
- −$757
- − Management
- −$757
- − Depreciation
- −$3,258
- Taxable loss
- −$3,757
- Est. tax savings @ 24.0%
- +$902
- After-tax cash flow
- $-845/yr
For passive investors: Depreciation is non-cash, so a rental often shows a tax loss while cash-flowing — sheltering income. Rental losses are passive: they offset passive income freely, and up to $25,000/yr can offset ordinary (W-2) income if you actively participate and your MAGI is under $100k (phasing out to $0 by $150k); unused losses carry forward. On sale, claimed depreciation is recaptured at up to 25%, and gains may owe capital-gains tax (a 1031 exchange can defer both). Figures are a year-1 estimate at your 24.0% rate — not tax advice; consult a CPA.
Schools (NCES district)
- District
- Cuba-Rushford Central School District
- NCES district ID
- 3632010
- Math proficiency
- 44% ▼ -18.00%
- Reading proficiency
- 61% ▲ 5.00%
- Median HH income
- $47,256
- Composite
- 44.53/100
- National rank
- #2792
- State rank
- #350 of 590 in NY
Livability — Cuba
- Score
- 73/100
- State rank
- #309
- US rank
- #5131
Category grades
Schools grade is shown separately in the Schools card above.
Census & demographics
- Population (ZIP)
- 556
Population outlook (Allegany County) Hauer SSP2
- Today (2025)
- 45,362 people
- By 2030
- 43,078 · -5.0%
- By 2040
- 38,031 · -16.2%
- By 2050
- 33,634 · -25.9%
- By 2075
- 25,285 · -44.3%
- By 2100
- 18,902 · -58.3%
Race, ethnicity, and origin ACS 2023
- Neighborhood character
- Predominantly White (93%)
- Race & ethnicity
- White 93% Hispanic / Latino 6% Asian 1%
- Hispanic origin (detail)
- Mexican 5%
- Common ancestry
- Polish 7% Romanian 6% Lithuanian 1%
- Foreign-born
- 1%
- Languages at home
- 84% English-only · German/W. Germanic 16%
Political lean MEDSL · Allegany
- 2024 margin
- Solid R (+43.2) · D 28.4% · R 71.6%
- 2008→2024 swing
- -21.5pp toward R · 2008: -21.7pp · 2024: -43.2pp
- All cycles
- 2024: R+43.2 2020: R+38.9 2016: R+42.3 2012: R+25.3 2008: R+21.7
Not yet ingested
- Civics
- —
Market trends
- HPI YoY
- ▲ 9.97%
- Current HPI
- 340.7919
- Rent YoY
- —
- Metro
- —
- State GDP YoY
- ▲ 2.60%
- F500 in state
- 92
Industry mix (Fortune 500 HQ in NY)
| Industry | F500 HQs | Revenue |
|---|---|---|
| Financial Services | 10 | $950B |
|
||
| Consumer Goods | 9 | $162B |
|
||
| Insurance | 4 | $225B |
|
||
| Telecommunications | 2 | $144B |
|
||
| Pharmaceuticals | 2 | $112B |
|
||
| Media / Entertainment | 2 | $69B |
|
||
Price history
1 event — show timeline
- 2026-05-22 Listed $112,000 UNYREIS
Property tax history
+53.9%/yrLatest (2025): $1,618 · +53.9% YoY. Source: county tax records.
Cash-flow waterfall
monthlySold comps — $/sqft
last 12 mo · ≤1 miLoading sold comps…