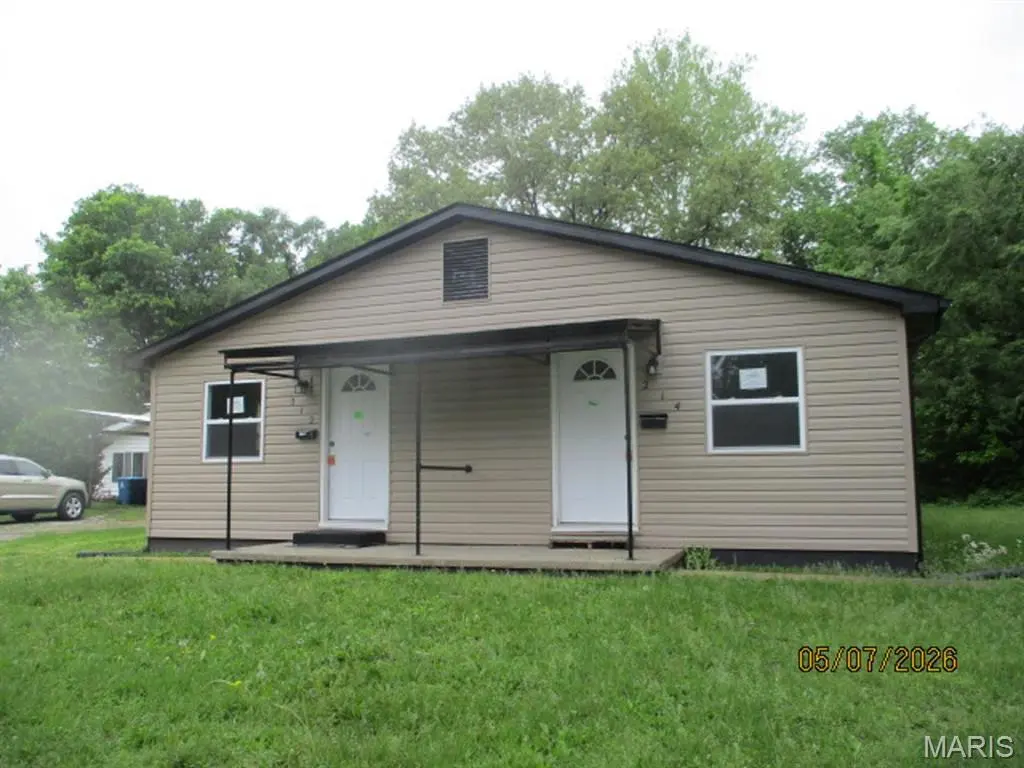
212 Clara St · Swansea, IL
Flood risk 1/10 · Minimal
- FEMA flood zone
- X
- Chance of flooding over 30 yrs
- 0.0%
- Est. flood insurance / yr
- $507 – $1,088
Fire risk 1/10 · Minimal
- Est. fire insurance / yr
- $804 – $1,492
Heat risk 5/10 · Moderate
- Hot days now (above 107°F)
- 7 days/yr
- Hot days in 30 yrs
- 21 days/yr
Wind risk 2/10 · Minimal
- Chance of severe wind over 30 yrs
- 1.0%
Air-quality risk 4/10 · Minor
- Unhealthy air days now
- 3 days/yr
- Unhealthy air days in 30 yrs
- 6 days/yr
Risk factors via First Street. Map © Google.
Why this score? — see what drove the B grade
The composite is a weighted blend of 9 inputs, each scored 0–100. Each bar is that input's sub-score; the figure is the points it added to the 100-point composite (weight × sub-score).
- Cash flow +27.0/30.0
- ARV discount +15.0/15.0
- DSCR +9.4/10.0
- 1% rule +7.3/10.0
- Livability +4.0/5.0
- Rent growth +3.6/5.0
- Condition / age +2.5/5.0
- Schools +2.2/10.0
- Appreciation +0.0/10.0
$133,000
🖨 Deal sheet (PDF) 📄 Offer letter ✓ Due diligence
Listing remarks
LOOKING FOR AN INVESTMENT PROPERTY THAT IS READY TO RENT? OR MAYBE LIVE IN ONE SIDE AND RENT OUT OTHER? THIS ONE IS MOVE IN READY WITH 2 BEDROOMS, 1 BATH IN EACH UNIT. SEPERATE ENTRANCE AND EXIT WITH STORAGE SHED ATTACHED TO BACK OF EACH UNIT. Agents must register as a User, enter the property address, and click on “Start Offer”. This property may qualify for Seller Financing (Vendee). If Property was built prior to 1978, Lead Based Paint Potentially Exists. BUYER TO VERIFY ALL MLS INFORMATION INCLUDING BUT NOT LIMITED TO SQ. FT, TAXES, ROOM SIZE, ROOM COUNT, SCHOOLS, ETC. ..
Key facts
- 0.41 acre lot
- Built 1954
- Listed 50 days
Property features AI
Finance
- Financial info: No second mortgage reported
Exterior
- Home design: Residential income property (2–4 units); Total living area about 1,600 (above grade)
- Construction: Vinyl siding exterior
- Exterior features: Lot approximately 0.41 acres
Interior
- Bedrooms: One 2-bedroom unit (2 units total of this type)
- Bathrooms: Units each have 1 bathroom
- Heating & cooling: Forced air heating; Central air conditioning
- Interior features: Forced air heating; Central air conditioning
Neighborhood map
What this means for you Summary
Snapshot
- This is a 4-bed/4.0-bath single-family listed at $133k.
Deal economics
- At list price, monthly cash flow is $374 ($4k/yr) — positive.
- The deal already cash-flows at list — no discount required.
- Meets the 1% rule at list price ($2k rent vs $133k).
- Recommended offer: $129k (3.0% below list) — sets the bar for market timing.
- Cap rate 9.7% vs local median 1.9% in Swansea — top-decile yield for the area; either an underpriced asset or a hidden risk that comps aren't pricing in. Stress-test before assuming the spread holds.
Location & tenants
- Location reads 80/100 on livability (#105 in IL, #1,705 nationally) — a professional / high-income tenant draw. Strengths: crime A+, commute A+, employment A+; Watch: health & safety C-, amenities F.
- Belleville Twp Hsd 201 (suburban): math 21% / reading 28% proficiency, ranked #308 of 620 in IL (top 50%) — low school quality limits family demand, transient renter base, plan for 1-2y turnover.
- Zoned schools: Belleville High School-West (math 19% / reading 26%, grade F, #317 of 693 statewide, top 46%, 2,234 students, 0% FRL).
- Market conditions: Rents rising fast (+4.6%/yr); 190 active listings in the ZIP; 8 comparable units currently listed for rent nearby; rentals at typical pace (median 25d on market — plan ~3-4 weeks tenant-placement turnaround); 783 units permitted in St. Clair County in 2024 (378 in 5+ unit buildings).
Forward outlook
- Local home prices are declining (-3.0%/yr); year-one equity from $920 of loan paydown is wiped out by about $4k of value loss. Plan a longer hold.
- St. Clair County population projected at -23% by 2050 — secular population decline; favor cash flow + early exit over multi-decade hold.
- At projected returns (-3.0% appreciation + 4.6% rent growth), your $37k cash investment doubles in ~9 years — after that, you're playing with house money.
Negotiation context
- It's been on market 51 days — a 3% lower offer ($129k) is reasonable based on typical stale-listing flexibility.
- 6 sale attempts since 3y ago; this cycle's ask has dropped $10k (7%) from the opening price — seller is motivated, your offer sets the floor, not the list.
Risks & watch-outs
- Watch-outs: built in 1954 — expect roof / HVAC / electrical / plumbing capex.
- Climate carrying-cost: extreme-heat days projected 7→21/yr by 2055 (HVAC capex compounding) — expect insurance premiums to compound above CPI over the hold.
Questions for the listing agent
- It's been on market 51 days. Have you received any prior offers? Is the seller open to a 3% concession, seller financing, or rate buy-down credit?
- Built in 1954 — when were the roof, HVAC, electrical panel, plumbing, and water heater last replaced?
- Is there a deadline driving the sale (1031 exchange, divorce, estate, relocation)? That informs how much negotiation room exists.
- What's the average days-on-market for RENTAL listings here right now (not sales)? A rising rental-DOM trend means longer vacancies and softer asking-rent achievability than the comps imply.
- What's the recent tenant-quality profile in this submarket — average credit score on applications, eviction rate, late-payment / NSF rate, and stable-employment percentage? A property-management company in the area should have these aggregated.
- How much new for-sale + rental construction is in the pipeline within 1–3 miles? Heavy new supply typically softens prices + rents 12–24 months out; constrained supply supports both.
Investment metrics
- 1% rule
- 1.23% ✓
- Cap rate
- 9.67%
- Cash-on-cash
- 12.05%
- DSCR
- 1.54
- GRM
- 6.8
CMA / ARV
- ARV (on-the-fly)
- $190,400
- Comps found
- 12
Show comp detail 12 sales within ~0.75 mi
| Address | Dist | Beds/Ba | Sqft | Sold | Price | $/sf | Match |
|---|---|---|---|---|---|---|---|
| 1631 N Church St | 0.61mi | 3/2.0 (-1) | 1,588 (-1%) | 2mo | $149,900 | $94 | 56 |
| 1411 N Church St | 0.50mi | 3/2.5 (-1) | 1,674 (+5%) | 4mo | $215,000 | $128 | 55 |
| 811 Lebanon Ave | 0.42mi | 3/2.0 (-1) | 1,515 (-5%) | 8mo | $179,900 | $119 | 52 |
| 117 Timber Dr | 0.67mi | 3/2.0 (-1) | 1,560 (-2%) | 4mo | $230,000 | $147 | 48 |
| 244 Brackett St | 0.58mi | 3/3.0 (-1) | 1,700 (+6%) | 7mo | $155,000 | $91 | 48 |
| 1316 N Church St | 0.51mi | 3/1.0 (-1) | 1,500 (-6%) | 2mo | $150,000 | $100 | 47 |
| 1715 Scheel St | 0.73mi | 3/2.5 (-1) | 1,509 (-6%) | 2mo | $230,000 | $152 | 44 |
| 300 Derbyshire Dr | 0.56mi | 3/2.0 (-1) | 1,750 (+9%) | 4mo | $279,000 | $159 | 42 |
| 1705 N Charles St | 0.73mi | 3/2.0 (-1) | 1,730 (+8%) | 1mo | $198,000 | $114 | 38 |
| 1006 N 2nd St | 0.65mi | 3/1.0 (-1) | 1,450 (-9%) | 2mo | $102,500 | $71 | 35 |
| 1325 Orchard St | 0.63mi | 3/1.5 (-1) | 1,368 (-14%) | 10mo | $65,000 | $48 | 23 |
| 1615 Duncan Ave | 0.70mi | 3/1.5 (-1) | 1,400 (-12%) | 11mo | $210,000 | $150 | 23 |
Match score weights: distance 35% · size 25% · config 20% · recency 20%. Top-matched comps best support the ARV.
Projected returns pro-forma
-3.0% appreciation · 4.56% rent growth · sell at horizon
- IRR
- 3.4%
- Equity multiple
- 1.13×
- Total profit
- $4,907
- Equity at exit
- $19,831
- IRR
- 14.3%
- Equity multiple
- 2.24×
- Total profit
- $46,110
- Equity at exit
- $11,499
Cash invested: $37,240 (down + closing). Projections, not guarantees.
Landlord ↔ Tenant lean methodology
- Overall (STATE)
- 43 Moderately Tenant-Leaning
- State Illinois
- 43 Moderately Tenant-Leaning · D+7
- County
- — inherits STATE
- City
- — inherits STATE
ZIP-level market 62226
- Rents YoY
- 4.6%
- Active inventory
- 190
- Price-to-rent
- 6.8×
Monthly cashflow live
- Estimated rent
- $1,638 high interval (Pro) →
- Mortgage (P&I)
- −$697
- Tax from tax record
- −$167 /mo · $2,004/yr
- Insurance
- −$55
- HOA
- −$0
- Vacancy / Maint / Mgmt
- −$344
- Net cashflow
- $374
Break-even live
Sensitivity live
| Price | -10% $449 | -5% $412 | +0% $374 | +5% $336 | +10% $299 |
|---|---|---|---|---|---|
| Rent | -10% $245 | -5% $309 | +0% $374 | +5% $439 | +10% $503 |
| Rate | -1.0pp $441 | -0.5pp $408 | base $374 | +0.5pp $340 | +1.0pp $305 |
UW: 25.0% down · 7.5% · 30yr · 1.5% tax · 5.0% vac · 8.0% maint · 8.0% mgmt
Financing live
Cash to close
- Down payment
- $33,250
- Closing costs
- $3,990
- Reserves months
- —
- Total cash needed
- —
Loan-product check · same deal, 3 products live
Conventional
25% down · 7.5% · 30yr
- Down + closing
- —
- Monthly P&I
- —
- Monthly cashflow
- —
- DSCR
- —
- Eligible?
- —
Personal DTI + credit; lowest rate.
DSCR
20% down · 8.5% · 30yr
- Down + closing
- —
- Monthly P&I
- —
- Monthly cashflow
- —
- DSCR
- —
- Eligible?
- —
No personal income docs; deal must DSCR.
Hard money
10% down · 12.0% · 12mo
- Down + closing
- —
- Monthly P&I
- —
- Monthly cashflow
- —
- DSCR
- —
- Eligible?
- —
Short-term bridge; refi at stabilization.
Rent comps 8 comps
| Address | Beds | Baths | Sqft | Rent | $/sqft | DOM | Units | Dist |
|---|---|---|---|---|---|---|---|---|
| 1107 Bristow St Belleville, IL | 3.0 | 1.0 | 1238 | $1,500 | $1.21 | 13d | 1 | 0.41mi |
| 1 Rosehaven Dr Belleville, IL | 3.0 | 2.0 | 1512 | $1,325 | $0.88 | 24d | 1 | 0.60mi |
| 1717 La Salle St Belleville, IL | 3.0 | 1.0 | 1104 | $1,350 | $1.22 | 24d | 1 | 0.82mi |
| 1528 Lebanon Ave Belleville, IL | 4.0 | 2.0 | 1600 | $1,950 | $1.22 | 24d | 1 | 0.89mi |
| 25 Glencoe Dr Belleville, IL | 3.0 | 1.0 | 1200 | $1,275 | $1.06 | 24d | 1 | 1.21mi |
| 134 Clinton Hill Dr Belleville, IL | 3.0 | 3.0 | 1890 | $1,850 | $0.98 | 2d | 1 | 1.42mi |
| 134 Clinton Hill Dr Belleville, IL | 3.0 | 3.0 | 1890 | $1,850 | $0.98 | 15d | 1 | 1.42mi |
| 134 Clinton Hill Dr Belleville, IL | 3.0 | 3.0 | 1890 | $1,850 | $0.98 | 24d | 1 | 1.42mi |
Listing history 40 events
-
2026-06-18days on market $133,000 Active 51 DOM
-
2026-06-17days on market $133,000 Active 50 DOM
-
2026-06-16days on market $133,000 Active 49 DOM
-
2026-06-15days on market $133,000 Active 48 DOM
-
2026-06-13days on market $133,000 Active 46 DOM
-
2026-06-09days on market $133,000 Active 42 DOM
-
2026-06-08days on market $133,000 Active 41 DOM
-
2026-06-07pricedays on market $133,000 Active 40 DOM
-
2026-06-03days on market $142,750 Active 36 DOM
-
2026-06-02days on market $142,750 Active 35 DOM
-
2026-06-01days on market $142,750 Active 34 DOM
-
2026-05-31days on market $142,750 Active 33 DOM
-
2026-04-28$142,750 Active
-
2024-12-12historical
-
2024-12-12historical
-
2024-10-05historical Active Under Contract
-
2024-10-05historical Active Under Contract
-
2024-09-28price $150,000
-
2024-09-28price $150,000
-
2024-09-11price $162,900
-
2024-09-11price $162,900
-
2024-08-02price $164,900
-
2024-08-02price $164,900
-
2024-07-05price $172,000
-
2024-07-05price $172,000
-
2024-06-04price $174,900
-
2024-06-04price $174,900
-
2024-05-21$179,900 Active
-
2024-05-16$179,900 Active
-
2024-05-10historical
-
2024-03-21status Active
-
2024-03-06historical
-
2024-01-30price $185,000
-
2024-01-06price $188,500
-
2023-11-16$192,000 Active
-
2023-11-16historical
-
2023-03-03soldstatus $172,000
-
2023-03-02soldstatus Closed
-
2023-01-30status Pending
-
2023-01-27$179,900 Active
ⓘ Source: listings_history table (triggers on properties + properties_extension) + one-shot
backfill from property_details.listing_events for pre-trigger history.
Tax reassessment forecast IL · Partial reset (capped growth)
- Current annual tax
- $2,004 · $167/mo
- Projected year-2 tax
- $2,512 · $209/mo
- Expected delta
- +$507/yr (+$42/mo · 25.3%)
ⓘ Screening estimate from a state-policy table — verify with the county assessor before closing.
Climate risk First Street
- Flood 1/10 Low FEMA zone X · 0% chance over 30 yrs
- Wildfire 1/10 Low
- Heat 5/10 Major 7 d/yr ≥107°F today · 21 d/yr by 30 yrs out
- Wind 2/10 Low 100% chance of damaging wind over 30 yrs
- Air quality 4/10 Moderate 3 unhealthy d/yr today · 6 by 30 yrs out
Nearby sold comps map
Loading sold comps map…
Walkable amenities ~0.75 mi
Loading nearby amenities…
Taxation est. · year 1
- Rental income
- $19,655
- − Mortgage interest
- −$7,450
- − Property taxes
- −$2,004
- − Insurance
- −$665
- − Repairs & maintenance
- −$1,572
- − Management
- −$1,572
- − Depreciation
- −$3,869
- Taxable income
- $2,522
- Est. tax owed @ 24.0%
- −$605
- After-tax cash flow
- $3,883/yr
For passive investors: Depreciation is non-cash, so a rental often shows a tax loss while cash-flowing — sheltering income. Rental losses are passive: they offset passive income freely, and up to $25,000/yr can offset ordinary (W-2) income if you actively participate and your MAGI is under $100k (phasing out to $0 by $150k); unused losses carry forward. On sale, claimed depreciation is recaptured at up to 25%, and gains may owe capital-gains tax (a 1031 exchange can defer both). Figures are a year-1 estimate at your 24.0% rate — not tax advice; consult a CPA.
Schools (NCES district)
- District
- Belleville Twp Hsd 201
- NCES district ID
- 1705640
- Math proficiency
- 21% ▼ -8.00%
- Reading proficiency
- 28% ▼ -3.00%
- Median HH income
- $58,064
- Composite
- 22.39/100
- National rank
- #8115
- State rank
- #308 of 620 in IL
Livability — Swansea
- Score
- 80/100
- State rank
- #105
- US rank
- #1705
Category grades
Schools grade is shown separately in the Schools card above.
Census & demographics
- Census place
- Swansea, IL
- County
- Saint Clair County · 169,691 people
- City population
- 28,543
- Metro
- St. Louis, MO-IL
- Population (ZIP)
- 28,255
- Household income
- $70,797
- Rent vs Own
- Severe rent burden
- 824.0
Population outlook (St. Clair County) Hauer SSP2
- Today (2025)
- 250,366 people
- By 2030
- 240,511 · -3.9%
- By 2040
- 217,391 · -13.2%
- By 2050
- 192,699 · -23.0%
- By 2075
- 140,637 · -43.8%
- By 2100
- 100,499 · -59.9%
Race, ethnicity, and origin ACS 2023
- Neighborhood character
- Majority White (64%)
- Race & ethnicity
- White 64% Black 24% Two or more races 7% Hispanic / Latino 3% Asian 2%
- Common ancestry
- Romanian 4% Lithuanian 2% Slovak 2%
- Foreign-born
- 4% · Canada, China
- Languages at home
- 96% English-only · Chinese 1% Spanish 1%
Political lean MEDSL · St. Clair
- 2024 margin
- Lean D (+7.9) · D 53.0% · R 45.1% · Other 1.8%
- 2008→2024 swing
- -14.6pp toward R · 2008: 22.4pp · 2024: 7.9pp
- All cycles
- 2024: D+7.9 2020: D+8.7 2016: D+5.6 2012: D+14.5 2008: D+22.4
Not yet ingested
- Civics
- —
Market trends
- HPI YoY
- ▼ -83.57%
- Current HPI
- 133.9028
- Rent YoY
- ▲ 4.56%
- Metro
- St. Louis, MO-IL
- State GDP YoY
- ▲ 1.59%
- F500 in state
- 60
Industry mix (Fortune 500 HQ in IL)
| Industry | F500 HQs | Revenue |
|---|---|---|
| Insurance | 4 | $201B |
|
||
| Consumer Goods | 4 | $87B |
|
||
| Industrial Machinery | 3 | $64B |
|
||
| Healthcare | 2 | $55B |
|
||
| Retail / Pharmacy | 1 | $148B |
|
||
| Agriculture / Food | 1 | $86B |
|
||
Price history
-20.7% since first listed28 events — show timeline
- 2026-04-28 Listed $142,750 MARIS as Distributed by MLS Grid
- 2024-12-12 Delisted — MARIS as Distributed by MLS Grid
- 2024-12-12 Delisted — MARIS as Distributed by MLS Grid
- 2024-10-05 Contingent — MARIS as Distributed by MLS Grid
- 2024-10-05 Contingent — MARIS as Distributed by MLS Grid
- 2024-09-28 Price Changed $150,000 MARIS as Distributed by MLS Grid
- 2024-09-28 Price Changed $150,000 MARIS as Distributed by MLS Grid
- 2024-09-11 Price Changed $162,900 MARIS as Distributed by MLS Grid
- 2024-09-11 Price Changed $162,900 MARIS as Distributed by MLS Grid
- 2024-08-02 Price Changed $164,900 MARIS as Distributed by MLS Grid
- 2024-08-02 Price Changed $164,900 MARIS as Distributed by MLS Grid
- 2024-07-05 Price Changed $172,000 MARIS as Distributed by MLS Grid
- 2024-07-05 Price Changed $172,000 MARIS as Distributed by MLS Grid
- 2024-06-04 Price Changed $174,900 MARIS as Distributed by MLS Grid
- 2024-06-04 Price Changed $174,900 MARIS as Distributed by MLS Grid
- 2024-05-21 Listed $179,900 MARIS as Distributed by MLS Grid
- 2024-05-16 Listed $179,900 MARIS as Distributed by MLS Grid
- 2024-05-10 Delisted — MARIS as Distributed by MLS Grid
- 2024-03-21 Relisted — MARIS as Distributed by MLS Grid
- 2024-03-06 Delisted — MARIS as Distributed by MLS Grid
- 2024-01-30 Price Changed $185,000 MARIS as Distributed by MLS Grid
- 2024-01-06 Price Changed $188,500 MARIS as Distributed by MLS Grid
- 2023-11-16 Listed $192,000 MARIS as Distributed by MLS Grid
- 2023-11-16 Coming Soon — MARIS as Distributed by MLS Grid
- 2023-03-03 Sold (Public Records) $172,000 Public Records
- 2023-03-02 Sold (MLS) — MARIS as Distributed by MLS Grid
- 2023-01-30 Pending — MARIS as Distributed by MLS Grid
- 2023-01-27 Listed $179,900 MARIS as Distributed by MLS Grid
Property tax history
+3.4%/yrLatest (2024): $2,004 · -4.0% YoY. Source: county tax records.
Cash-flow waterfall
monthlySold comps — $/sqft
last 12 mo · ≤1 miLoading sold comps…