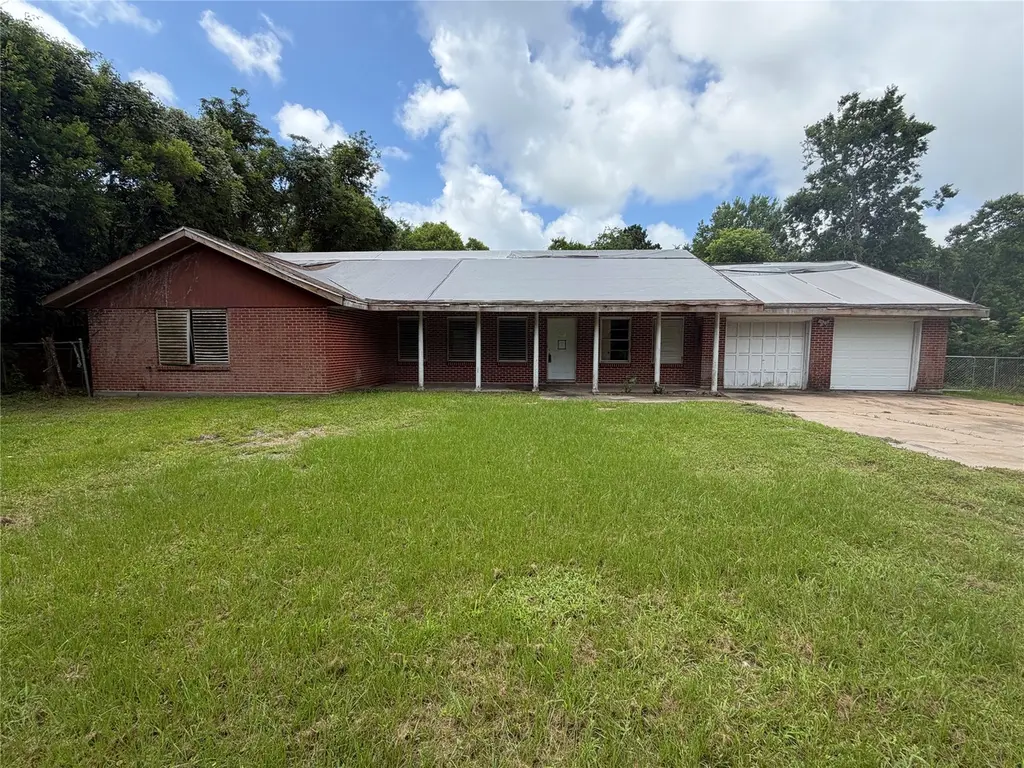
1301 N Vauthier Ln · La Marque, TX
Flood risk 6/10 · Moderate
- FEMA flood zone
- X (shaded)
- Chance of flooding over 30 yrs
- 0.5%
- Est. flood insurance / yr
- $507 – $1,088
Fire risk 4/10 · Minor
- Est. fire insurance / yr
- $1,222 – $2,270
Heat risk 10/10 · Severe
- Hot days now (above 110°F)
- 6 days/yr
- Hot days in 30 yrs
- 21 days/yr
Wind risk 10/10 · Severe
- Chance of severe wind over 30 yrs
- 99.0%
Air-quality risk 3/10 · Minor
- Unhealthy air days now
- 2 days/yr
- Unhealthy air days in 30 yrs
- 2 days/yr
Risk factors via First Street. Map © Google.
Why this score? — see what drove the B- grade
The composite is a weighted blend of 9 inputs, each scored 0–100. Each bar is that input's sub-score; the figure is the points it added to the 100-point composite (weight × sub-score).
- Cash flow +30.0/30.0
- 1% rule +10.0/10.0
- DSCR +10.0/10.0
- ARV discount +7.5/15.0
- Rent growth +3.5/5.0
- Livability +3.0/5.0
- Schools +2.6/10.0
- Condition / age +2.5/5.0
- Appreciation +0.0/10.0
$79,900
🖨 Deal sheet (PDF) 📄 Offer letter ✓ Due diligence
Listing remarks
Great opportunity with this 3-bedroom, 2-bath home located in La Marque, TX. Featuring original wood flooring, tile finishes, brick exterior, and an attached garage, the property provides a solid foundation for renovation or customization. The oversized lot offers ample room for outdoor living or future improvements. Conveniently located with easy access to I-45, shopping, dining, and local amenities, this property is ideal for investors, flippers, or buyers looking to create their dream home. Don't miss your chance to unlock the potential of this hidden gem!
Key facts
- Brick exterior
- Tile finishes
- Easy access to i-45
Tags
Property features AI
Finance
- Other: Living area approximately 2,014 (reported)
- Financial info: Lease not considered
- HOA & community: Information not provided
Exterior
- Parking: Attached 2-car garage
- Security: Information not provided
- Utilities: Public water; Public sewer
- Home design: Residential property; Information not provided for stories, entry level, or facing direction
- Construction: Built in 1974; Brick construction; Composition roof; Slab foundation
- Exterior features: Corner lot; Other lot features
Interior
- Kitchen: Information not provided
- Bedrooms: Information not provided
- Flooring: Information not provided
- Bathrooms: 2 full bathrooms
- Heating & cooling: Central heating (electric); Central air conditioning (electric)
- Interior features: 5 total rooms
- Laundry & utility: Information not provided
Neighborhood map
What this means for you Summary
Snapshot
- This is a 3-bed/2.0-bath single-family listed at $80k.
Deal economics
- At list price, monthly cash flow is $1k ($16k/yr) — positive.
- The deal already cash-flows at list — no discount required.
- Meets the 1% rule at list price ($2k rent vs $80k).
- Cap rate 26.0% vs local median 5.6% in La Marque — top-decile yield for the area; either an underpriced asset or a hidden risk that comps aren't pricing in. Stress-test before assuming the spread holds.
Location & tenants
- Location reads 59/100 on livability (#1,136 in TX) — a working-class tenant base; expect higher turnover. Strengths: cost of living A+, housing A+; Watch: employment D, crime F, amenities F.
- Hitchcock ISD (suburban): math 28% / reading 31% proficiency, ranked #628 of 826 in TX (top 76%) — low school quality limits family demand, transient renter base, plan for 1-2y turnover; 72% free/reduced lunch — lower-income household profile, screen leases tightly.
- Zoned schools: Crosby Middle (math 25% / reading 33%, grade F, #1,103 of 1,662 statewide, top 67%, 410 students, 84% FRL); Hitchcock H S (math 47% / reading 47%, grade D-, #591 of 1,632 statewide, top 38%, 470 students, 77% FRL).
- Market conditions: Rents rising (+4.0%/yr); 654 active listings in the ZIP; 3 comparable units currently listed for rent nearby; rentals leasing fast (median 3d on market — plan ~1-2 weeks tenant-placement turnaround); 3,258 units permitted in Galveston County in 2024 (0 in 5+ unit buildings).
- This rent runs 38% of the median local income ($75k/yr) — at the standard rent-burdened threshold; future hikes will face affordability resistance.
Forward outlook
- Local home prices are declining (-3.0%/yr); year-one equity from $552 of loan paydown is wiped out by about $2k of value loss. Plan a longer hold.
- Galveston County population projected at +43% by 2050 — long-run rental-demand tailwind backs the buy-and-hold thesis.
- At projected returns (-3.0% appreciation + 4.0% rent growth), your $22k cash investment doubles in ~2 years — after that, you're playing with house money.
Negotiation context
- Only 8 days on market — expect competitive offers; lowballing is unlikely to land.
Risks & watch-outs
- Climate carrying-cost: major flood risk; severe wind risk, 99% chance of damaging wind over 30y; extreme-heat days projected 6→21/yr by 2055 (HVAC capex compounding) — expect insurance premiums to compound above CPI over the hold.
Questions for the listing agent
- Built in 1974 — when were the roof, HVAC, electrical panel, plumbing, and water heater last replaced?
- Is there a deadline driving the sale (1031 exchange, divorce, estate, relocation)? That informs how much negotiation room exists.
- Schools are F-rated, which usually means shorter tenancies and higher turnover. Who's the typical renter profile here, and what's been the actual vacancy rate?
- Crime grade is F in this area — have there been break-ins, vandalism, or insurance claims at this property in the last 3 years? What carrier currently insures it and at what premium?
- What's the average days-on-market for RENTAL listings here right now (not sales)? A rising rental-DOM trend means longer vacancies and softer asking-rent achievability than the comps imply.
- What's the recent tenant-quality profile in this submarket — average credit score on applications, eviction rate, late-payment / NSF rate, and stable-employment percentage? A property-management company in the area should have these aggregated.
- How much new for-sale + rental construction is in the pipeline within 1–3 miles? Heavy new supply typically softens prices + rents 12–24 months out; constrained supply supports both.
Investment metrics
- 1% rule
- 2.95% ✓
- Cap rate
- 25.97%
- Cash-on-cash
- 70.29%
- DSCR
- 4.13
- GRM
- 2.8
CMA / ARV
- ARV (on-the-fly)
- $277,932
- Comps found
- 12
Show comp detail 12 sales within ~0.75 mi
| Address | Dist | Beds/Ba | Sqft | Sold | Price | $/sf | Match |
|---|---|---|---|---|---|---|---|
| 73 Borondo Reach | 0.40mi | 3/2.0 | 1,976 (-2%) | 9mo | $347,000 | $176 | 70 |
| 2805 N Houston Dr | 0.47mi | 3/2.5 | 1,832 (-9%) | 4mo | $130,000 | $71 | 58 |
| 3046 Cedar Dr | 0.37mi | 3/2.0 | 1,803 (-10%) | 10mo | $270,000 | $150 | 57 |
| 1401 Austin St | 0.69mi | 4/3.0 (+1) | 2,054 (+2%) | 4mo | $249,900 | $122 | 52 |
| 2508 N Houston Dr | 0.71mi | 4/2.0 (+1) | 1,867 (-7%) | 2mo | $115,000 | $62 | 48 |
| 3116 Mckinney Dr | 0.71mi | 4/2.0 (+1) | 2,116 (+5%) | 7mo | $165,000 | $78 | 48 |
| 1222 Sacred Light Ln | 0.74mi | 4/2.0 (+1) | 1,872 (-7%) | 5mo | $304,990 | $163 | 44 |
| 805 Duroux Rd | 0.65mi | 4/2.0 (+1) | 1,822 (-10%) | 10mo | $249,500 | $137 | 41 |
| 2424 Oaklawn Dr | 0.74mi | 4/2.0 (+1) | 1,744 (-13%) | 3mo | $235,000 | $135 | 36 |
| 1218 Sacred Light Ln | 0.74mi | 4/2.0 (+1) | 1,732 (-14%) | 4mo | $302,990 | $175 | 34 |
| 157 Lower Borondo | 0.62mi | 4/3.5 (+1) | 2,282 (+13%) | 6mo | $355,000 | $156 | 33 |
| 152 Lower Borondo | 0.59mi | 4/3.5 (+1) | 2,312 (+15%) | 10mo | $320,000 | $138 | 28 |
Match score weights: distance 35% · size 25% · config 20% · recency 20%. Top-matched comps best support the ARV.
Projected returns pro-forma
-3.0% appreciation · 3.95% rent growth · sell at horizon
- IRR
- 70.9%
- Equity multiple
- 4.26×
- Total profit
- $72,825
- Equity at exit
- $11,913
- IRR
- 75.2%
- Equity multiple
- 9.07×
- Total profit
- $180,546
- Equity at exit
- $6,908
Cash invested: $22,372 (down + closing). Projections, not guarantees.
Landlord ↔ Tenant lean methodology
- Overall (STATE)
- 87 Strongly Landlord-Friendly
- State Texas
- 87 Strongly Landlord-Friendly · R+5
- County
- — inherits STATE
- City
- — inherits STATE
ZIP-level market 77568
- Home prices YoY
- -22.7%
- Rents YoY
- 4.0%
- Active inventory
- 654
- Price-to-rent
- 2.8×
Monthly cashflow live
- Estimated rent
- $2,358 medium interval (Pro) →
- Mortgage (P&I)
- −$419
- Tax est. 1.5%
- −$100 /mo · $1,198/yr
- Insurance
- −$33
- HOA
- −$0
- Vacancy / Maint / Mgmt
- −$495
- Net cashflow
- $1,310
Break-even live
Sensitivity live
| Price | -10% $1,366 | -5% $1,338 | +0% $1,310 | +5% $1,283 | +10% $1,255 |
|---|---|---|---|---|---|
| Rent | -10% $1,124 | -5% $1,217 | +0% $1,310 | +5% $1,404 | +10% $1,497 |
| Rate | -1.0pp $1,351 | -0.5pp $1,331 | base $1,310 | +0.5pp $1,290 | +1.0pp $1,269 |
UW: 25.0% down · 7.5% · 30yr · 1.5% tax · 5.0% vac · 8.0% maint · 8.0% mgmt
Financing live
Cash to close
- Down payment
- $19,975
- Closing costs
- $2,397
- Reserves months
- —
- Total cash needed
- —
Loan-product check · same deal, 3 products live
Conventional
25% down · 7.5% · 30yr
- Down + closing
- —
- Monthly P&I
- —
- Monthly cashflow
- —
- DSCR
- —
- Eligible?
- —
Personal DTI + credit; lowest rate.
DSCR
20% down · 8.5% · 30yr
- Down + closing
- —
- Monthly P&I
- —
- Monthly cashflow
- —
- DSCR
- —
- Eligible?
- —
No personal income docs; deal must DSCR.
Hard money
10% down · 12.0% · 12mo
- Down + closing
- —
- Monthly P&I
- —
- Monthly cashflow
- —
- DSCR
- —
- Eligible?
- —
Short-term bridge; refi at stabilization.
Rent comps 3 comps
| Address | Beds | Baths | Sqft | Rent | $/sqft | DOM | Units | Dist |
|---|---|---|---|---|---|---|---|---|
| 1401 Austin St La Marque, TX | 4.0 | 3.0 | 1542 | $2,400 | $1.56 | 44d | 1 | 0.68mi |
| 14403 Daniel Shores Dr La Marque, TX | 4.0 | 3.0–3.5 | 1872 | $2,600 | $1.39 | 1d | 12 | 0.77mi |
| 1230 Kirsten St La Marque, TX | 3.0 | 2.0 | 1704 | $1,660 | $0.97 | 3d | 1 | 1.05mi |
Listing history 7 events
-
2026-06-18days on market $79,900 Active 8 DOM
-
2026-06-17days on market $79,900 Active 7 DOM
-
2026-06-16days on market $79,900 Active 6 DOM
-
2026-06-15days on market $79,900 Active 5 DOM
-
2026-06-13days on market $79,900 Active 3 DOM
-
2026-06-13remarks 566-char remark
-
2026-06-13$79,900 Active 2 DOM
ⓘ Source: listings_history table (triggers on properties + properties_extension) + one-shot
backfill from property_details.listing_events for pre-trigger history.
Climate risk First Street
- Flood 6/10 Major FEMA zone X (shaded) · 50% chance over 30 yrs
- Wildfire 4/10 Moderate
- Heat 10/10 Extreme 6 d/yr ≥110°F today · 21 d/yr by 30 yrs out
- Wind 10/10 Extreme 99% chance of damaging wind over 30 yrs
- Air quality 3/10 Moderate 2 unhealthy d/yr today · 2 by 30 yrs out
Nearby sold comps map
Loading sold comps map…
Walkable amenities ~0.75 mi
Loading nearby amenities…
Taxation est. · year 1
- Rental income
- $28,293
- − Mortgage interest
- −$4,476
- − Property taxes
- −$1,198
- − Insurance
- −$400
- − Repairs & maintenance
- −$2,263
- − Management
- −$2,263
- − Depreciation
- −$2,324
- Taxable income
- $15,368
- Est. tax owed @ 24.0%
- −$3,688
- After-tax cash flow
- $12,037/yr
For passive investors: Depreciation is non-cash, so a rental often shows a tax loss while cash-flowing — sheltering income. Rental losses are passive: they offset passive income freely, and up to $25,000/yr can offset ordinary (W-2) income if you actively participate and your MAGI is under $100k (phasing out to $0 by $150k); unused losses carry forward. On sale, claimed depreciation is recaptured at up to 25%, and gains may owe capital-gains tax (a 1031 exchange can defer both). Figures are a year-1 estimate at your 24.0% rate — not tax advice; consult a CPA.
Schools (NCES district)
- District
- Hitchcock ISD
- NCES district ID
- 4823310
- Math proficiency
- 28% ▼ -2.00%
- Reading proficiency
- 31% ▼ -4.00%
- Median HH income
- $47,041
- Composite
- 25.5/100
- National rank
- #7439
- State rank
- #628 of 826 in TX
Livability — La Marque
- Score
- 59/100
- State rank
- #1136
- US rank
- #20037
Category grades
Schools grade is shown separately in the Schools card above.
Census & demographics
- Census place
- La Marque, TX
- County
- Galveston County · 357,330 people
- City population
- 23,083
- Metro
- Houston-The Woodlands-Sugar Land, TX
- Population (ZIP)
- 23,083
- Household income
- $74,694
- Rent vs Own
- Severe rent burden
- 700.0
Population outlook (Galveston County) Hauer SSP2
- Today (2025)
- 390,640 people
- By 2030
- 425,226 · +8.9%
- By 2040
- 493,765 · +26.4%
- By 2050
- 559,698 · +43.3%
- By 2075
- 719,260 · +84.1%
- By 2100
- 819,628 · +109.8%
Race, ethnicity, and origin ACS 2023
- Neighborhood character
- Highly diverse neighborhood (Simpson 0.71)
- Race & ethnicity
- White 37% Hispanic / Latino 29% Black 26% Two or more races 17% Asian 3%
- Hispanic origin (detail)
- Mexican 22% Puerto Rican 1%
- Common ancestry
- Lithuanian 1% Italian 1% Serbian 1%
- Foreign-born
- 8% · Canada
- Languages at home
- 77% English-only · Spanish 21% Tagalog/Filipino 1% Other Asian/Pacific 1%
Political lean MEDSL · Galveston
- 2024 margin
- Strong R (+27.4) · D 35.7% · R 63.1% · Other 1.2%
- 2008→2024 swing
- -7.9pp toward R · 2008: -19.5pp · 2024: -27.4pp
- All cycles
- 2024: R+27.4 2020: R+22.6 2016: R+22.6 2012: R+26.9 2008: R+19.5
Not yet ingested
- Civics
- —
Market trends
- HPI YoY
- ▼ -69.39%
- Current HPI
- 236.0239
- Rent YoY
- ▲ 3.95%
- Metro
- Houston-The Woodlands-Sugar Land, TX
- State GDP YoY
- ▲ 3.95%
- F500 in state
- 110
Industry mix (Fortune 500 HQ in TX)
| Industry | F500 HQs | Revenue |
|---|---|---|
| Energy | 16 | $1,198B |
|
||
| Technology | 5 | $198B |
|
||
| Engineering / Construction | 4 | $72B |
|
||
| Energy Services | 3 | $60B |
|
||
| Utilities | 3 | $41B |
|
||
| Healthcare | 2 | $330B |
|
||
Price history
4 events — show timeline
- 2026-06-10 Listed $79,900 HARMLS
- 2025-05-27 Sold (Public Records) — Public Records
- 2013-03-26 Sold (Public Records) — Public Records
- 1995-06-26 Sold (Public Records) — Public Records
Property tax history
+6.9%/yrLatest (2025): $4,326 · +10.9% YoY. Source: county tax records.
Cash-flow waterfall
monthlySold comps — $/sqft
last 12 mo · ≤1 miLoading sold comps…