 Duplex
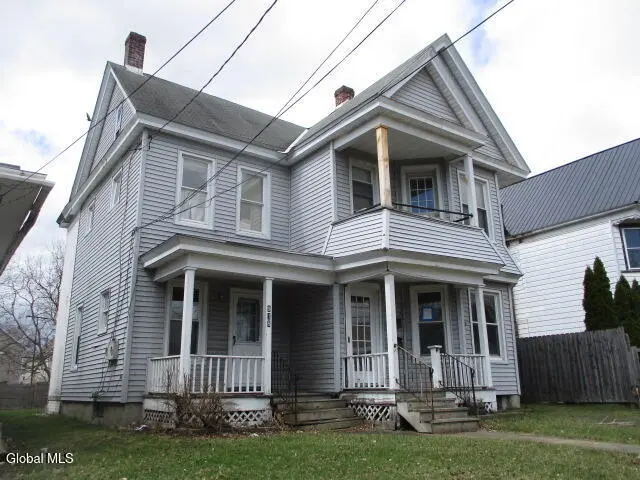
918 Hegeman St · Schenectady, NY
Flood risk 1/10 · Minimal
- FEMA flood zone
- X (unshaded)
- Chance of flooding over 30 yrs
- 0.0%
- Est. flood insurance / yr
- $473 – $860
Fire risk 3/10 · Minor
- Est. fire insurance / yr
- $691 – $1,283
Heat risk 4/10 · Minor
- Hot days now (above 96°F)
- 7 days/yr
- Hot days in 30 yrs
- 16 days/yr
Wind risk 2/10 · Minimal
- Chance of severe wind over 30 yrs
- 4.0%
Air-quality risk 1/10 · Minimal
- Unhealthy air days now
- 0 days/yr
- Unhealthy air days in 30 yrs
- 0 days/yr
Risk factors via First Street. Map © Google.
Why this score? — see what drove the B+ grade
The composite is a weighted blend of 9 inputs, each scored 0–100. Each bar is that input's sub-score; the figure is the points it added to the 100-point composite (weight × sub-score).
- Cash flow +30.0/30.0
- ARV discount +15.0/15.0
- 1% rule +10.0/10.0
- DSCR +10.0/10.0
- Livability +3.9/5.0
- Schools +3.0/10.0
- Rent growth +2.5/5.0
- Condition / age +1.5/5.0
- Appreciation +0.0/10.0
$173,850
🖨 Deal sheet 📄 Offer letter ✓ Due diligence
Multi-family units
County records classify this as Multi-Family (2-4 Unit). Listing-text estimate: 2 units. confirmed
Listing remarks
Great two unit in a great rental area. Large rooms. Nice floor plan, Full basement and attic. lots of updates, Newer windows. Newer Furnaces. Rear porch, Rear yard. best deal in Schenectady. Both units vacant easy to view. Wont last long at this price.
Key facts
- 5,227 sq ft lot
- Built 1865
- Listed 13 days
Property features AI
Exterior
- Utilities: Public water; Public sewer
- Home design: Duplex; Living area approximately 1,754; Vinyl siding
- Construction: Shingle roof
- Exterior features: Front porch; Rear covered porch
Interior
- Kitchen: Kitchens included in each unit
- Bedrooms: Two 2-bedroom units (each unit has 2 bedrooms) — bedrooms located on various levels including second floor
- Bathrooms: Two full bathrooms total (one full bath on the 1st level, one full bath on the 2nd level)
- Heating & cooling: Forced-air heating; Natural gas heating
- Interior features: Full basement with interior entry
- Laundry & utility: In-unit or on-site laundry not specified
Neighborhood map
What this means for you Summary
Snapshot
- This is a 2 × 2-bed/1.0-bath units multifamily listed at $174k. Condition is rated poor.
Deal economics
- At list price, monthly cash flow is $1k ($16k/yr) — positive. Per door: $680/mo.
- The deal already cash-flows at list — no discount required.
- Meets the 1% rule at list price ($3k rent vs $174k).
- Cap rate 15.7% vs local median 6.3% in Schenectady — top-decile yield for the area; either an underpriced asset or a hidden risk that comps aren't pricing in. Stress-test before assuming the spread holds.
Location & tenants
- Location reads 78/100 on livability (#167 in NY, #2,597 nationally) — a middle-class / working-renter tenant base. Strengths: commute A+, health & safety A+, cost of living A; Watch: employment D+, crime F.
- Schenectady City School District (urban): math 38% / reading 34% proficiency, ranked #556 of 590 in NY (top 94%) — families likely to look elsewhere, expect single-tenant / working-renter base with shorter leases; 65% free/reduced lunch — lower-income household profile, screen leases tightly.
- Zoned schools: Van Corlaer Elementary School (math 17% / reading 32%, grade F, #1,846 of 2,108 statewide, top 91%, 436 students, 78% FRL); Schenectady High School (math 75% / reading 90%, grade A, #446 of 1,100 statewide, top 41%, 2,743 students, 71% FRL).
- Zoned-school proficiency averages 54% at this address vs 36% district-wide (+18 pts) — the actual schools serving this property are materially stronger than the Schenectady City School District average implies; a family-tenant draw the district grade alone would hide.
- Market conditions: 181 active listings in the ZIP; 5 comparable units currently listed for rent nearby; rentals leasing fast (median 14d on market — plan ~1-2 weeks tenant-placement turnaround); solid renter incomes; 154 units permitted in Schenectady County in 2024 (54 in 5+ unit buildings).
- At $3,243/mo this rent would consume 47% of the median local household income ($83k/yr) (locally 629% of renters already pay >50% of income on rent) — very limited rent-growth headroom before tenants either downsize or default.
Forward outlook
- Local home prices are declining (-3.0%/yr); year-one equity from $1k of loan paydown is wiped out by about $5k of value loss. Plan a longer hold.
- Schenectady County population projected to shrink 4% by 2050 — rents likely to lag national; underwrite the cash flow, not the appreciation.
- At projected returns (-3.0% appreciation + 3.0% rent growth), your $49k cash investment doubles in ~4 years — after that, you're playing with house money.
Negotiation context
- Only 13 days on market — expect competitive offers; lowballing is unlikely to land.
- 4 sale attempts with the ask held roughly flat each time — persistent listings suggest the price (not the market) is what's stuck; bring a comps-based counter.
Risks & watch-outs
- Watch-outs: built in 1865 — expect roof / HVAC / electrical / plumbing capex.
Questions for the listing agent
- Can we see the unit-by-unit rent roll, current vacancy, and any below-market leases? What's the average tenancy length?
- What capital expenditures (roof, boiler, parking lot, exteriors) have been made in the last 5 years, and what's planned in the next 2?
- Have any recent inspections been done? Can we get a copy of the seller's disclosures and any deferred-maintenance estimates?
- Built in 1865 — when were the roof, HVAC, electrical panel, plumbing, and water heater last replaced?
- Is there a deadline driving the sale (1031 exchange, divorce, estate, relocation)? That informs how much negotiation room exists.
- Crime grade is F in this area — have there been break-ins, vandalism, or insurance claims at this property in the last 3 years? What carrier currently insures it and at what premium?
- What's the average days-on-market for RENTAL listings here right now (not sales)? A rising rental-DOM trend means longer vacancies and softer asking-rent achievability than the comps imply.
- What's the recent tenant-quality profile in this submarket — average credit score on applications, eviction rate, late-payment / NSF rate, and stable-employment percentage? A property-management company in the area should have these aggregated.
- How much new apartment / multifamily construction is in the pipeline within 1–3 miles? Heavy new supply (>2% of stock underway) typically softens rents 12–24 months out; light construction supports rent growth.
Investment metrics
- 1% rule
- 1.87% ✓
- Cap rate
- 15.68%
- Cash-on-cash
- 33.54%
- DSCR
- 2.49
- GRM
- 4.5
CMA / ARV
- ARV (on-the-fly)
- $245,560
- Comps found
- 12
Show comp detail 12 sales within ~0.75 mi
| Address | Dist | Beds/Ba | Sqft | Sold | Price | $/sf | Match |
|---|---|---|---|---|---|---|---|
| 1909 Euclid Ave | 0.21mi | 4/2.0 | 1,650 (-6%) | 12mo | $231,500 | $140 | 71 |
| 417 Shannon St | 0.32mi | 4/2.0 | 1,900 (+8%) | 9mo | $244,000 | $128 | 64 |
| 2330 Fairlee St | 0.45mi | 5/2.0 (+1) | 1,656 (-6%) | 6mo | $300,000 | $181 | 59 |
| 2820 Broadway | 0.61mi | 3/2.0 (-1) | 1,800 (+3%) | 7mo | $254,000 | $141 | 56 |
| 1108 Cutler St | 0.60mi | 4/2.0 | 1,848 (+5%) | 10mo | $278,000 | $150 | 55 |
| 2336 Turner Ave | 0.45mi | 4/3.0 | 1,932 (+10%) | 7mo | $190,000 | $98 | 52 |
| 2332 Turner Ave | 0.44mi | 5/3.0 (+1) | 1,932 (+10%) | 1mo | $255,000 | $132 | 52 |
| 420 Marengo St | 0.72mi | 5/2.0 (+1) | 1,820 (+4%) | 6mo | $309,000 | $170 | 50 |
| 954 Cleveland Ave | 0.40mi | 3/2.0 (-1) | 1,541 (-12%) | 8mo | $212,000 | $138 | 50 |
| 1417 3rd Ave | 0.59mi | 5/3.0 (+1) | 1,600 (-9%) | 2mo | $175,000 | $109 | 47 |
| 1320 4th Ave | 0.68mi | 4/2.0 | 1,564 (-11%) | 4mo | $242,250 | $155 | 47 |
| 935 Davis Ter | 0.49mi | 4/2.0 | 2,000 (+14%) | 12mo | $36,000 | $18 | 44 |
Match score weights: distance 35% · size 25% · config 20% · recency 20%. Top-matched comps best support the ARV.
Projected returns pro-forma
-3.0% appreciation · 3.0% rent growth · sell at horizon
- IRR
- 28.8%
- Equity multiple
- 2.20×
- Total profit
- $58,531
- Equity at exit
- $25,922
- IRR
- 36.2%
- Equity multiple
- 4.34×
- Total profit
- $162,746
- Equity at exit
- $15,031
Cash invested: $48,678 (down + closing). Projections, not guarantees.
Landlord ↔ Tenant lean methodology
- Overall (STATE)
- 15 Strongly Tenant-Friendly
- State New York
- 15 Strongly Tenant-Friendly · D+10
- County
- — inherits STATE
- City
- — inherits STATE
ZIP-level market 12306
- Home prices YoY
- -23.8%
- Active inventory
- 181
- Price-to-rent
- 8.9×
Monthly cashflow live
- Estimated rent
- $3,243 high interval (Pro) →
- Mortgage (P&I)
- −$912
- Tax est. 1.5%
- −$217 /mo · $2,608/yr
- Insurance
- −$72
- HOA
- −$0
- Vacancy / Maint / Mgmt
- −$681
- Net cashflow
- $1,361
Break-even live
2-unit breakdown (identical units grouped — click to expand)
| Units | Beds | Baths | Est. rent |
|---|---|---|---|
| 2× units | 2 | 1 | $3,242 |
| #1 | 2 | 1 | $1,621 |
| #2 | 2 | 1 | $1,621 |
| Total (2 units) | $3,243 | ||
UW: 25.0% down · 7.5% · 30yr · 1.5% tax · 5.0% vac · 8.0% maint · 8.0% mgmt
Financing live
Cash to close
- Down payment
- $43,462
- Closing costs
- $5,216
- Reserves months
- —
- Total cash needed
- —
Loan-product check · same deal, 3 products live
Conventional
25% down · 7.5% · 30yr
- Down + closing
- —
- Monthly P&I
- —
- Monthly cashflow
- —
- DSCR
- —
- Eligible?
- —
Personal DTI + credit; lowest rate.
DSCR
20% down · 8.5% · 30yr
- Down + closing
- —
- Monthly P&I
- —
- Monthly cashflow
- —
- DSCR
- —
- Eligible?
- —
No personal income docs; deal must DSCR.
Hard money
10% down · 12.0% · 12mo
- Down + closing
- —
- Monthly P&I
- —
- Monthly cashflow
- —
- DSCR
- —
- Eligible?
- —
Short-term bridge; refi at stabilization.
Rent comps 5 comps
| Address | Beds | Baths | Sqft | Rent | $/sqft | DOM | Units | Dist |
|---|---|---|---|---|---|---|---|---|
| 2030 Euclid Ave Schenectady, NY | 3.0 | 1.0 | 1300 | $2,000 | $1.54 | 18d | 1 | 0.07mi |
| 2007 Campbell Ave Schenectady, NY | 3.0 | 1.0 | 1272 | $1,600 | $1.26 | 13d | 1 | 0.34mi |
| 909 Vischer Ave Schenectady, NY | 3.0 | 1.5 | 1512 | $1,995 | $1.32 | 13d | 1 | 0.44mi |
| 1346 10th Ave Schenectady, NY | 4.0 | 2.0 | 2350 | $2,499 | $1.06 | 14d | 1 | 0.79mi |
| 117 Washington Ave Schenectady, NY | 2.0–4.0 | 1.0–2.0 | 1033 | $2,163 | $2.09 | 13d | 9 | 1.46mi |
Listing history 16 events
-
2026-06-08status $173,850 Pending 13 DOM
-
2026-06-07days on market $173,850 Active 13 DOM
-
2026-06-03days on market $173,850 Active 9 DOM
-
2026-06-02days on market $173,850 Active 8 DOM
-
2026-06-01days on market $173,850 Active 7 DOM
-
2026-05-31days on market $173,850 Active 6 DOM
-
2026-05-31days on market $173,850 Active 5 DOM
-
2026-05-22status Pending
-
2026-05-19status Active
-
2026-04-08status Pending
-
2026-04-08$173,850 Active
-
2026-02-11price $173,850
-
2026-02-05status Active
-
2026-01-28status Pending
-
2026-01-28historical
-
2026-01-06$183,000 Active
ⓘ Source: listings_history table (triggers on properties + properties_extension) + one-shot
backfill from property_details.listing_events for pre-trigger history.
Climate risk First Street
- Flood 1/10 Low FEMA zone X (unshaded) · 0% chance over 30 yrs
- Wildfire 3/10 Moderate
- Heat 4/10 Moderate 7 d/yr ≥96°F today · 16 d/yr by 30 yrs out
- Wind 2/10 Low 4% chance of damaging wind over 30 yrs
- Air quality 1/10 Low 0 unhealthy d/yr today · 0 by 30 yrs out
Nearby sold comps map
Loading sold comps map…
Walkable amenities ~0.75 mi
Loading nearby amenities…
Taxation est. · year 1
- Rental income
- $38,916
- − Mortgage interest
- −$9,738
- − Property taxes
- −$2,608
- − Insurance
- −$869
- − Repairs & maintenance
- −$3,113
- − Management
- −$3,113
- − Depreciation
- −$5,057
- Taxable income
- $14,417
- Est. tax owed @ 24.0%
- −$3,460
- After-tax cash flow
- $12,866/yr
For passive investors: Depreciation is non-cash, so a rental often shows a tax loss while cash-flowing — sheltering income. Rental losses are passive: they offset passive income freely, and up to $25,000/yr can offset ordinary (W-2) income if you actively participate and your MAGI is under $100k (phasing out to $0 by $150k); unused losses carry forward. On sale, claimed depreciation is recaptured at up to 25%, and gains may owe capital-gains tax (a 1031 exchange can defer both). Figures are a year-1 estimate at your 24.0% rate — not tax advice; consult a CPA.
Condition & rehab AI · 12 photos
This two-unit property requires extensive renovations to bring it up to modern standards, with a focus on the kitchen and bathrooms. Improvements would significantly increase its value for both resale and rental purposes.
Repairs flagged
- Major kitchen cabinets — severely worn and outdated
- Major bathroom fixtures — dated and worn
- Major exterior siding — weathered and in need of repainting
- Major porch — worn and in need of repair
- Major flooring — dated and worn tile
Value-add opportunities
- Both kitchen renovation — modernizing the kitchen would increase both resale and rental value
- Both bathroom renovation — modernizing the bathrooms would increase both resale and rental value
- Both exterior painting — painting the exterior would improve curb appeal and increase both resale and rental value
- Both landscaping — improving the landscaping would increase curb appeal and increase both resale and rental value
Renovation cost estimate screening
| Repair item | Severity | Est. cost |
|---|---|---|
| kitchen cabinets · severely worn and outdated | Major | $15,000–50,000 |
| bathroom fixtures · dated and worn | Major | $15,000–50,000 |
| exterior siding · weathered and in need of repainting | Major | $15,000–50,000 |
| porch · worn and in need of repair | Major | $15,000–50,000 |
| flooring · dated and worn tile | Major | $15,000–50,000 |
| Total estimated repair cost · 5 items | $75,000–250,000 |
Value-add ROI direction
- Both kitchen renovation — modernizing the kitchen would increase both resale and rental value ↑
- Both bathroom renovation — modernizing the bathrooms would increase both resale and rental value ↑
- Both exterior painting — painting the exterior would improve curb appeal and increase both resale and rental value ↑
- Both landscaping — improving the landscaping would increase curb appeal and increase both resale and rental value ↑
ⓘ Cost ranges are severity-bucket heuristics (US national rule-of-thumb). Get contractor quotes + a written scope before underwriting a rehab budget.
Schools (NCES district)
- District
- Schenectady City School District
- NCES district ID
- 3626010
- Math proficiency
- 38% ▲ 12.00%
- Reading proficiency
- 34% ▲ 2.00%
- Median HH income
- $39,453
- Composite
- 30.2/100
- National rank
- #6309
- State rank
- #556 of 590 in NY
Livability — Schenectady
- Score
- 78/100
- State rank
- #167
- US rank
- #2597
Category grades
Schools grade is shown separately in the Schools card above.
Census & demographics
- Census place
- Schenectady, NY
- County
- Schenectady County · 141,369 people
- City population
- 141,369
- Metro
- Albany-Schenectady-Troy, NY
- Population (ZIP)
- 27,865
- Household income
- $83,202
- Rent vs Own
- Severe rent burden
- 629.0
Population outlook (Schenectady County) Hauer SSP2
- Today (2025)
- 155,046 people
- By 2030
- 154,322 · -0.5%
- By 2040
- 151,796 · -2.1%
- By 2050
- 148,621 · -4.1%
- By 2075
- 141,229 · -8.9%
- By 2100
- 126,014 · -18.7%
Race, ethnicity, and origin ACS 2023
- Neighborhood character
- Predominantly White (78%)
- Race & ethnicity
- White 78% Two or more races 8% Black 7% Hispanic / Latino 7% Asian 3%
- Hispanic origin (detail)
- Puerto Rican 4% Dominican 1%
- Common ancestry
- Romanian 7% Lithuanian 5% Iranian 3%
- Foreign-born
- 6% · Canada
- Languages at home
- 94% English-only · Spanish 3% Other Indo-European 1% Other Asian/Pacific 1%
Political lean MEDSL · Schenectady
- 2024 margin
- D (+10.8) · D 55.4% · R 44.6%
- 2008→2024 swing
- -1.8pp toward R · 2008: 12.7pp · 2024: 10.8pp
- All cycles
- 2024: D+10.8 2020: D+15.7 2016: D+5.8 2012: D+15.4 2008: D+12.7
Not yet ingested
- Civics
- —
Market trends
- HPI YoY
- ▼ -91.35%
- Current HPI
- 292.1229
- Rent YoY
- —
- Metro
- Albany-Schenectady-Troy, NY
- State GDP YoY
- ▲ 2.60%
- F500 in state
- 92
Industry mix (Fortune 500 HQ in NY)
| Industry | F500 HQs | Revenue |
|---|---|---|
| Financial Services | 10 | $950B |
|
||
| Consumer Goods | 9 | $162B |
|
||
| Insurance | 4 | $225B |
|
||
| Telecommunications | 2 | $144B |
|
||
| Pharmaceuticals | 2 | $112B |
|
||
| Media / Entertainment | 2 | $69B |
|
||
Price history
-5.0% since first listed9 events — show timeline
- 2026-05-22 Pending — Global MLS
- 2026-05-19 Relisted — Global MLS
- 2026-04-08 Pending — Global MLS
- 2026-04-08 Listed $173,850 Global MLS
- 2026-02-11 Price Changed $173,850 Global MLS
- 2026-02-05 Relisted — Global MLS
- 2026-01-28 Pending — Global MLS
- 2026-01-28 Listing Removed — Global MLS
- 2026-01-06 Listed $183,000 Global MLS
Cash-flow waterfall
monthlySold comps — $/sqft
last 12 mo · ≤1 miLoading sold comps…