19602 N 32nd St #23 · Phoenix, AZ
Flood risk 1/10 · Minimal
- FEMA flood zone
- X (shaded)
- Chance of flooding over 30 yrs
- 0.0%
- Est. flood insurance / yr
- $507 – $1,088
Fire risk 4/10 · Minor
- Est. fire insurance / yr
- $610 – $1,132
Heat risk 8/10 · Major
- Hot days now (above 111°F)
- 6 days/yr
- Hot days in 30 yrs
- 17 days/yr
Wind risk 1/10 · Minimal
- Chance of severe wind over 30 yrs
- —
Air-quality risk 3/10 · Minor
- Unhealthy air days now
- 3 days/yr
- Unhealthy air days in 30 yrs
- 5 days/yr
Risk factors via First Street. Map © Google.
Why this score? — see what drove the B+ grade
The composite is a weighted blend of 9 inputs, each scored 0–100. Each bar is that input's sub-score; the figure is the points it added to the 100-point composite (weight × sub-score).
- Cash flow +30.0/30.0
- ARV discount +15.0/15.0
- 1% rule +10.0/10.0
- DSCR +10.0/10.0
- Condition / age +4.0/5.0
- Schools +3.8/10.0
- Livability +3.8/5.0
- Rent growth +3.0/5.0
- Appreciation +0.0/10.0
$83,000
🖨 Deal sheet 📄 Offer letter ✓ Due diligence
Listing remarks
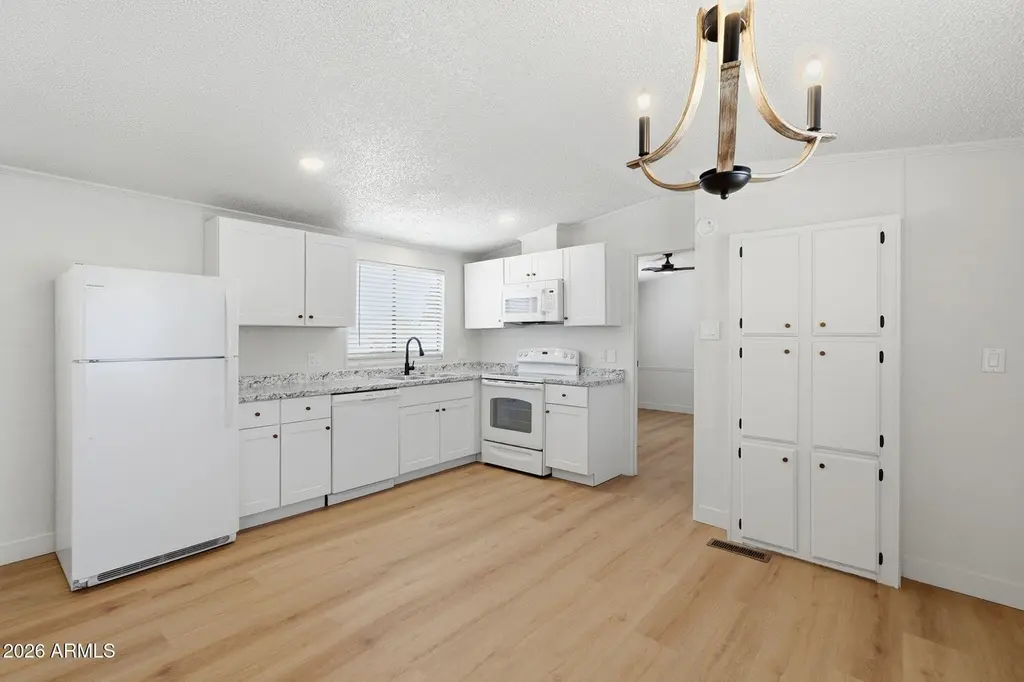
Located in Carefree Manor, an ALL AGES gated community, this fully remodeled single-wide is move-in ready from day one. A brand new roof and fresh updates throughout mean zero projects just a clean, well-finished home waiting for its next chapter. Inside you'll find modern finishes and fixtures throughout, with new LVP flooring and a split floorplan that gives you room to live, work and entertain comfortably. The community itself adds even more value- enjoy the pool, clubhouse, on-site laundry, a playground and a welcoming pet-friendly atmosphere. The location is hard to beat: less than a mile from Costco and Albertsons, minutes from Desert Ridge Marketplace for shopping and dining, quick a
Key facts
- Gated community
- Fully remodeled
- Brand new roof
Tags
Property features AI
Finance
- Other: Community amenities include gated access and coin-operated community laundry
- HOA & community: Land lease (approximately $944 monthly); Association maintains grounds; Community pool; Community spa (heated); Near bus stop
Exterior
- Parking: 2 covered parking spaces; 2-car carport
- Security: Gated community
- Utilities: City water; Public sewer
- Home design: Manufactured/mobile home; Leasehold ownership
- Construction: Vinyl siding; Steel frame construction; Painted exterior; Tile roof
- Exterior features: Storage space; Gravel/stone front yard; Gravel/stone backyard; Asphalt road access
Interior
- Kitchen: Built-in microwave; Laminate countertops; Refrigerator; Dishwasher; Garbage disposal
- Bedrooms: Up to 3 possible bedrooms
- Flooring: Vinyl flooring
- Bathrooms: 2 full bathrooms
- Heating & cooling: Electric heating; Central air conditioning; Ceiling fans
- Interior features: Eat-in kitchen; Full bath in primary bedroom; Laminate counters; Refrigerator; Dishwasher; Garbage disposal
- Laundry & utility: Community laundry (coin-operated)
Neighborhood map
What this means for you Summary
Snapshot
- This is a 3-bed/2.0-bath manufactured listed at $83k. Condition is rated good.
Deal economics
- At list price, monthly cash flow is $1k ($16k/yr) — positive.
- The deal already cash-flows at list — no discount required.
- Meets the 1% rule at list price ($2k rent vs $83k).
- Recommended offer: $82k (1.5% below list) — sets the bar for market timing.
- Cap rate 26.0% vs local median 3.3% in Phoenix — top-decile yield for the area; either an underpriced asset or a hidden risk that comps aren't pricing in. Stress-test before assuming the spread holds.
Location & tenants
- Location reads 75/100 on livability (#16 in AZ, #3,924 nationally) — a middle-class / working-renter tenant base. Strengths: amenities A+, commute A+, housing A+; Watch: health & safety C-, crime F.
- Paradise Valley Unified District (4241) (urban): math 39% / reading 46% proficiency, ranked #56 of 249 in AZ (top 22%) — families likely to look elsewhere, expect single-tenant / working-renter base with shorter leases.
- Zoned schools: Fireside Elementary School (math 76% / reading 80%, grade A, #19 of 1,109 statewide, top 2%, 730 students, 5% FRL); Mountain Trail Middle School (math 33% / reading 41%, grade F, #57 of 218 statewide, top 27%, 680 students, 24% FRL); Pinnacle High School (math 49% / reading 54%, grade D+, #35 of 381 statewide, top 9%, 2,479 students, 8% FRL) — zoned schools average 12% FRL vs 29% district-wide (17 pts lower); this property's tenant base skews higher-income than the district average.
- Zoned-school proficiency averages 56% at this address vs 42% district-wide (+13 pts) — the actual schools serving this property are materially stronger than the Paradise Valley Unified District (4241) average implies; a family-tenant draw the district grade alone would hide.
- Market conditions: Rents rising (+2.0%/yr); 218 active listings in the ZIP; 33 comparable units currently listed for rent nearby; rentals leasing fast (median 13d on market — plan ~1-2 weeks tenant-placement turnaround); high-income renter base; 36,011 units permitted in Maricopa County in 2024 (12,801 in 5+ unit buildings).
Forward outlook
- Local home prices are declining (-3.0%/yr); year-one equity from $574 of loan paydown is wiped out by about $2k of value loss. Plan a longer hold.
- Maricopa County population projected at +38% by 2050 — long-run rental-demand tailwind backs the buy-and-hold thesis.
- At projected returns (-3.0% appreciation + 2.0% rent growth), your $23k cash investment doubles in ~2 years — after that, you're playing with house money.
Negotiation context
- It's been on market 22 days — a 2% lower offer ($82k) is reasonable based on typical stale-listing flexibility.
Risks & watch-outs
- Climate carrying-cost: extreme-heat days projected 6→17/yr by 2055 (HVAC capex compounding) — expect insurance premiums to compound above CPI over the hold.
Questions for the listing agent
- Is there a deadline driving the sale (1031 exchange, divorce, estate, relocation)? That informs how much negotiation room exists.
- Crime grade is F in this area — have there been break-ins, vandalism, or insurance claims at this property in the last 3 years? What carrier currently insures it and at what premium?
- What's the average days-on-market for RENTAL listings here right now (not sales)? A rising rental-DOM trend means longer vacancies and softer asking-rent achievability than the comps imply.
- What's the recent tenant-quality profile in this submarket — average credit score on applications, eviction rate, late-payment / NSF rate, and stable-employment percentage? A property-management company in the area should have these aggregated.
- How much new for-sale + rental construction is in the pipeline within 1–3 miles? Heavy new supply typically softens prices + rents 12–24 months out; constrained supply supports both.
Investment metrics
- 1% rule
- 2.95% ✓
- Cap rate
- 25.98%
- Cash-on-cash
- 70.32%
- DSCR
- 4.13
- GRM
- 2.8
CMA / ARV
- ARV (on-the-fly)
- $108,864
- Comps found
- 10
Show comp detail 10 sales within ~0.75 mi
| Address | Dist | Beds/Ba | Sqft | Sold | Price | $/sf | Match |
|---|---|---|---|---|---|---|---|
| 19602 N 32nd St #21 | 0.00mi | 3/1.5 | 1,152 (+14%) | 4mo | $124,000 | $108 | 71 |
| 19802 N 32nd St #51 | 0.14mi | 2/2.0 (-1) | 1,080 (+7%) | 7mo | $49,500 | $46 | 71 |
| 19645 N 30th St | 0.11mi | 3/2.0 | 1,147 (+14%) | 18mo | $295,000 | $257 | 57 |
| 2701 E Utopia Rd #8 | 0.68mi | 3/2.0 | 984 (-2%) | 14mo | $72,000 | $73 | 53 |
| 2701 E Utopia Rd #66 | 0.68mi | 2/2.0 (-1) | 1,024 (+2%) | 10mo | $50,000 | $49 | 52 |
| 2701 E Utopia Rd #234 | 0.41mi | 2/1.0 (-1) | 896 (-11%) | 3mo | $18,000 | $20 | 51 |
| 19639 N 25th Pl | 0.66mi | 2/2.0 (-1) | 1,057 (+5%) | 12mo | $165,000 | $156 | 46 |
| 2539 E Oraibi Dr | 0.60mi | 2/2.0 (-1) | 985 (-2%) | 21mo | $240,000 | $244 | 46 |
| 19809 N 26th St | 0.57mi | 3/2.0 | 1,152 (+14%) | 7mo | $125,000 | $109 | 44 |
| 19802 N 32nd St #28 | 0.64mi | 2/2.0 (-1) | 1,152 (+14%) | 22mo | $90,000 | $78 | 23 |
Match score weights: distance 35% · size 25% · config 20% · recency 20%. Top-matched comps best support the ARV.
Projected returns pro-forma
-3.0% appreciation · 1.98% rent growth · sell at horizon
- IRR
- 68.7%
- Equity multiple
- 4.05×
- Total profit
- $70,839
- Equity at exit
- $12,376
- IRR
- 72.5%
- Equity multiple
- 8.04×
- Total profit
- $163,522
- Equity at exit
- $7,176
Cash invested: $23,240 (down + closing). Projections, not guarantees.
Landlord ↔ Tenant lean methodology
- Overall (STATE)
- 87 Strongly Landlord-Friendly
- State Arizona
- 87 Strongly Landlord-Friendly · R+3
- County
- — inherits STATE
- City
- — inherits STATE
ZIP-level market 85050
- Home prices YoY
- -21.9%
- Rents YoY
- 2.0%
- Active inventory
- 218
- Price-to-rent
- 2.8×
Monthly cashflow live
- Estimated rent
- $2,450 high interval (Pro) →
- Mortgage (P&I)
- −$435
- Tax est. 1.5%
- −$104 /mo · $1,245/yr
- Insurance
- −$35
- HOA
- −$0
- Vacancy / Maint / Mgmt
- −$515
- Net cashflow
- $1,362
Break-even live
UW: 25.0% down · 7.5% · 30yr · 1.5% tax · 5.0% vac · 8.0% maint · 8.0% mgmt
Financing live
Cash to close
- Down payment
- $20,750
- Closing costs
- $2,490
- Reserves months
- —
- Total cash needed
- —
Loan-product check · same deal, 3 products live
Conventional
25% down · 7.5% · 30yr
- Down + closing
- —
- Monthly P&I
- —
- Monthly cashflow
- —
- DSCR
- —
- Eligible?
- —
Personal DTI + credit; lowest rate.
DSCR
20% down · 8.5% · 30yr
- Down + closing
- —
- Monthly P&I
- —
- Monthly cashflow
- —
- DSCR
- —
- Eligible?
- —
No personal income docs; deal must DSCR.
Hard money
10% down · 12.0% · 12mo
- Down + closing
- —
- Monthly P&I
- —
- Monthly cashflow
- —
- DSCR
- —
- Eligible?
- —
Short-term bridge; refi at stabilization.
Rent comps 33 comps
| Address | Beds | Baths | Sqft | Rent | $/sqft | DOM | Units | Dist |
|---|---|---|---|---|---|---|---|---|
| 19246 N 31st St Phoenix, AZ | 4.0 | 2.0 | 1370 | $2,375 | $1.73 | 7d | 1 | 0.22mi |
| 3122 E Topeka Dr Phoenix, AZ | 3.0 | 2.0 | 1272 | $2,100 | $1.65 | 22d | 1 | 0.32mi |
| 3220 E Kerry Ln Phoenix, AZ | 3.0 | 2.0 | 1370 | $2,299 | $1.68 | 24d | 1 | 0.36mi |
| 3220 E Kerry Ln Phoenix, AZ | 3.0 | 2.0 | 1370 | $2,299 | $1.68 | 15d | 1 | 0.36mi |
| 20223 N 30th St Phoenix, AZ | 3.0 | 2.0 | 1467 | $2,300 | $1.57 | 1d | 1 | 0.40mi |
| 3056 E Siesta Ln Phoenix, AZ | 3.0 | 2.0 | 1476 | $2,375 | $1.61 | 12d | 1 | 0.40mi |
| 2934 E Blackhawk Dr Phoenix, AZ | 3.0 | 2.0 | 1467 | $2,280 | $1.55 | 2d | 1 | 0.44mi |
| 3214 E Siesta Ln Phoenix, AZ | 2.0 | 2.0 | 1228 | $2,200 | $1.79 | 24d | 1 | 0.50mi |
| 3301 E Wescott Dr Phoenix, AZ | 3.0 | 2.0 | 1101 | $1,995 | $1.81 | 24d | 1 | 0.58mi |
| 19635 N Cave Creek Rd Phoenix, AZ | 3.0 | 1.0–2.0 | 999 | $1,933 | $1.93 | 2d | 22 | 0.69mi |
| 2500 E Marco Polo Rd Phoenix, AZ | 2.0 | 1.0–2.0 | 918 | $2,390 | $2.60 | 2d | 16 | 0.71mi |
| 18617 N 35th St Phoenix, AZ | 3.0 | 2.5 | 1425 | $2,400 | $1.68 | 11d | 1 | 0.84mi |
| 2336 E Utopia Rd Phoenix, AZ | 2.0–3.0 | 2.5 | 1327 | $2,395 | $1.80 | 5d | 1 | 0.85mi |
| 2335 E Utopia Rd Unit 16 Phoenix, AZ | 3.0 | 2.5 | 1426 | $2,550 | $1.79 | 18d | 1 | 0.86mi |
| 20050 N Cave Creek Rd Phoenix, AZ | 1.0–2.0 | 1.0–2.0 | 909 | $1,770 | $1.95 | 1d | 10 | 0.89mi |
| 2755 E Michigan Ave Phoenix, AZ | 3.0 | 2.0 | 1316 | $2,700 | $2.05 | 17d | 1 | 0.98mi |
| 2220 E Beardsley Rd Phoenix, AZ | 4.0 | 1.0–2.0 | 855 | $1,964 | $2.30 | 3d | 62 | 1.04mi |
| 18660 N Cave Creek Rd Phoenix, AZ | 1.0–3.0 | 1.0–2.0 | 961 | $1,955 | $2.03 | 2d | 11 | 1.05mi |
| 2554 E Villa Rita Dr Phoenix, AZ | 2.0 | 1.0 | 1118 | $2,750 | $2.46 | 24d | 1 | 1.14mi |
| 18416 N Cave Creek Rd Phoenix, AZ | 2.0 | 1.0–2.0 | 786 | $3,000 | $3.81 | 4d | 9 | 1.15mi |
| 2602 E Charleston Ave Phoenix, AZ | 3.0 | 2.0 | 1426 | $2,100 | $1.47 | 24d | 1 | 1.18mi |
| 3916 E Morrow Dr Phoenix, AZ | 3.0 | 2.0 | 1350 | $2,425 | $1.80 | 12d | 1 | 1.20mi |
| 20007 N 20th Way Phoenix, AZ | 3.0 | 2.0 | 1251 | $3,900 | $3.12 | 43d | 1 | 1.21mi |
| 20660 N 40th St #2137 Phoenix, AZ | 2.0 | 2.0 | 1131 | $3,500 | $3.09 | 43d | 1 | 1.22mi |
| 17833 N 26th St Phoenix, AZ | 4.0 | 2.0 | 1220 | $2,397 | $1.96 | 1d | 1 | 1.23mi |
| 2030 E Wahalla Ln Phoenix, AZ | 3.0 | 2.0 | 1400 | $2,115 | $1.51 | 3d | 1 | 1.24mi |
| 18202 N Cave Creek Rd Phoenix, AZ | 1.0–3.0 | 1.0–2.0 | 722 | $1,500 | $2.08 | 4d | 7 | 1.25mi |
| 20660 N 40th St Phoenix, AZ | 2.0–3.0 | 2.0 | 1325 | $3,500 | $2.64 | 18d | 4 | 1.26mi |
| 2221 E Union Hills Dr #158 Phoenix, AZ | 3.0 | 2.0 | 1332 | $2,100 | $1.58 | 18d | 1 | 1.28mi |
| 3316 E Helena Dr Phoenix, AZ | 3.0 | 2.0 | 1176 | $2,000 | $1.70 | 24d | 1 | 1.39mi |
| 18239 N 40th St Phoenix, AZ | 2.0 | 1.5–2.5 | 1460 | $1,538 | $1.05 | 24d | 4 | 1.47mi |
| 18239 N 40th St Phoenix, AZ | 2.0 | 1.5–2.5 | 1494 | $1,700 | $1.14 | 15d | 3 | 1.47mi |
| 18239 N 40th St #168 Phoenix, AZ | 2.0 | 2.5 | 1189 | $1,698 | $1.43 | 2d | 1 | 1.47mi |
Listing history 16 events
-
2026-06-18days on market $83,000 Active 22 DOM
-
2026-06-17price $83,000 Active 21 DOM
-
2026-06-17days on market $84,000 Active 21 DOM
-
2026-06-16days on market $84,000 Active 20 DOM
-
2026-06-15days on market $84,000 Active 19 DOM
-
2026-06-13days on market $84,000 Active 17 DOM
-
2026-06-13days on market $84,000 Active 16 DOM
-
2026-06-09pricedays on market $84,000 Active 13 DOM
-
2026-06-08days on market $85,000 Active 12 DOM
-
2026-06-07days on market $85,000 Active 11 DOM
-
2026-06-04days on market $85,000 Active 8 DOM
-
2026-06-03days on market $85,000 Active 7 DOM
-
2026-06-02days on market $85,000 Active 6 DOM
-
2026-06-01days on market $85,000 Active 5 DOM
-
2026-05-31days on market $85,000 Active 4 DOM
-
2026-05-27$85,000 Active
ⓘ Source: listings_history table (triggers on properties + properties_extension) + one-shot
backfill from property_details.listing_events for pre-trigger history.
Climate risk First Street
- Flood 1/10 Low FEMA zone X (shaded) · 0% chance over 30 yrs
- Wildfire 4/10 Moderate
- Heat 8/10 Severe 6 d/yr ≥111°F today · 17 d/yr by 30 yrs out
- Wind 1/10 Low
- Air quality 3/10 Moderate 3 unhealthy d/yr today · 5 by 30 yrs out
Nearby sold comps map
Loading sold comps map…
Walkable amenities ~0.75 mi
Loading nearby amenities…
Taxation est. · year 1
- Rental income
- $29,400
- − Mortgage interest
- −$4,649
- − Property taxes
- −$1,245
- − Insurance
- −$415
- − Repairs & maintenance
- −$2,352
- − Management
- −$2,352
- − Depreciation
- −$2,415
- Taxable income
- $15,972
- Est. tax owed @ 24.0%
- −$3,833
- After-tax cash flow
- $12,510/yr
For passive investors: Depreciation is non-cash, so a rental often shows a tax loss while cash-flowing — sheltering income. Rental losses are passive: they offset passive income freely, and up to $25,000/yr can offset ordinary (W-2) income if you actively participate and your MAGI is under $100k (phasing out to $0 by $150k); unused losses carry forward. On sale, claimed depreciation is recaptured at up to 25%, and gains may owe capital-gains tax (a 1031 exchange can defer both). Figures are a year-1 estimate at your 24.0% rate — not tax advice; consult a CPA.
Condition & rehab AI · 12 photos
This fully remodeled single-wide is move-in ready with modern finishes and new LVP flooring, offering a great value in a gated community with amenities.
Value-add opportunities
- Both landscaping — improves curb appeal and adds value
- Both upgraded appliances — enhances kitchen functionality and aesthetics
- Both smart home integration — increases home's marketability and convenience
Renovation cost estimate screening
Value-add ROI direction
- Both landscaping — improves curb appeal and adds value ↑
- Both upgraded appliances — enhances kitchen functionality and aesthetics ↑
- Both smart home integration — increases home's marketability and convenience ↑
ⓘ Cost ranges are severity-bucket heuristics (US national rule-of-thumb). Get contractor quotes + a written scope before underwriting a rehab budget.
Schools (NCES district)
- District
- Paradise Valley Unified District (4241)
- NCES district ID
- 0405930
- Math proficiency
- 39% ▼ -11.00%
- Reading proficiency
- 46% ▼ -7.00%
- Median HH income
- $64,106
- Composite
- 37.89/100
- National rank
- #4316
- State rank
- #56 of 249 in AZ
Livability — Phoenix
- Score
- 75/100
- State rank
- #16
- US rank
- #3924
Category grades
Schools grade is shown separately in the Schools card above.
Census & demographics
- Census place
- Phoenix, AZ
- County
- Maricopa County · 4,537,380 people
- City population
- 1,500,198
- Metro
- Phoenix-Mesa-Chandler, AZ
- Population (ZIP)
- 33,118
- Household income
- $139,836
- Rent vs Own
- Severe rent burden
- 432.0
Population outlook (Maricopa County) Hauer SSP2
- Today (2025)
- 4,979,203 people
- By 2030
- 5,378,229 · +8.0%
- By 2040
- 6,156,598 · +23.6%
- By 2050
- 6,872,376 · +38.0%
- By 2075
- 8,401,270 · +68.7%
- By 2100
- 9,247,439 · +85.7%
Race, ethnicity, and origin ACS 2023
- Neighborhood character
- Predominantly White (71%)
- Race & ethnicity
- White 71% Hispanic / Latino 11% Two or more races 11% Asian 9% Black 2%
- Hispanic origin (detail)
- Mexican 8%
- Common ancestry
- Romanian 5% Italian 4% Lithuanian 3%
- Foreign-born
- 15% · Canada, China, Vietnam
- Languages at home
- 82% English-only · Spanish 6% Other Indo-European 5% Other Asian/Pacific 2%
Political lean MEDSL · Maricopa
- 2024 margin
- Toss-up / Even · D 47.7% · R 51.2% · Other 1.1%
- 2008→2024 swing
- +7.1pp toward D · 2008: -10.6pp · 2024: -3.5pp
- All cycles
- 2024: R+3.5 2020: D+2.2 2016: R+3.5 2012: R+12.0 2008: R+10.6
Not yet ingested
- Civics
- —
Market trends
- HPI YoY
- ▼ -86.38%
- Current HPI
- 308.7483
- Rent YoY
- ▲ 1.98%
- Metro
- Phoenix-Mesa-Chandler, AZ
- State GDP YoY
- ▲ 4.54%
- F500 in state
- 20
Industry mix (Fortune 500 HQ in AZ)
| Industry | F500 HQs | Revenue |
|---|---|---|
| Technology | 2 | $13B |
|
||
| Mining / Metals | 1 | $23B |
|
||
| Environmental Services | 1 | $16B |
|
||
| Metals / Steel | 1 | $14B |
|
||
| Technology Distribution | 1 | $9B |
|
||
| Homebuilding | 1 | $8B |
|
||
Price history
1 event — show timeline
- 2026-05-27 Listed $85,000 ARMLS
Cash-flow waterfall
monthlySold comps — $/sqft
last 12 mo · ≤1 miLoading sold comps…