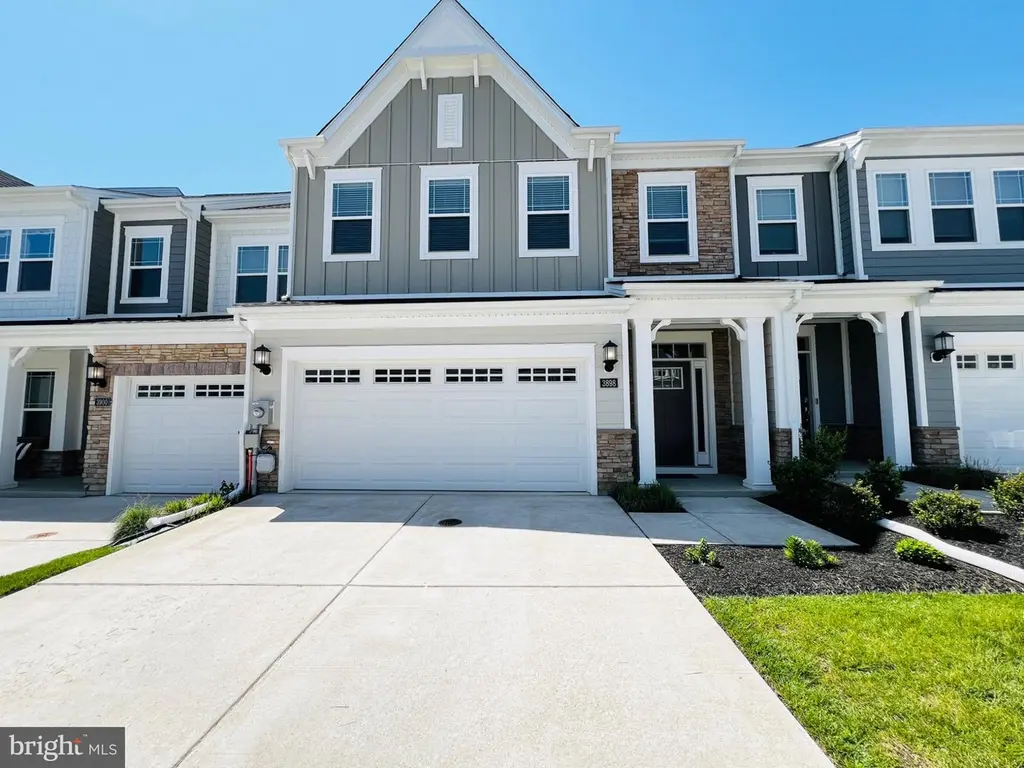
3898 Glacier Bay Pl · Waldorf, MD
Flood risk 1/10 · Minimal
- FEMA flood zone
- X (unshaded)
- Chance of flooding over 30 yrs
- 0.0%
- Est. flood insurance / yr
- $507 – $1,088
Fire risk 4/10 · Minor
- Est. fire insurance / yr
- $755 – $1,403
Heat risk 8/10 · Major
- Hot days now (above 102°F)
- 7 days/yr
- Hot days in 30 yrs
- 16 days/yr
Wind risk 6/10 · Moderate
- Chance of severe wind over 30 yrs
- 27.0%
Air-quality risk 2/10 · Minimal
- Unhealthy air days now
- 1 days/yr
- Unhealthy air days in 30 yrs
- 2 days/yr
Risk factors via First Street. Map © Google.
Why this score? — see what drove the C- grade
The composite is a weighted blend of 9 inputs, each scored 0–100. Each bar is that input's sub-score; the figure is the points it added to the 100-point composite (weight × sub-score).
- Cash flow +16.5/30.0
- ARV discount +15.0/15.0
- 1% rule +5.7/10.0
- DSCR +5.1/10.0
- Condition / age +4.0/5.0
- Livability +3.6/5.0
- Rent growth +2.5/5.0
- Schools +2.3/10.0
- Appreciation +0.0/10.0
$315,000
🖨 Deal sheet 📄 Offer letter ✓ Due diligence
Listing remarks
AGENTS - PLEASE VIEW AGENT REMARKS IN BRIGHT MLS. Why wait for new construction when you can move right into this practically new Lafayette model in The Parklands, a highly sought-after 50+ community in White Plains. Only 2 years young, this beautifully maintained villa offers 3 spacious bedrooms and 2 full baths, thoughtfully designed for easy living, comfort, and style. Enjoy modern finishes, open-concept living, and all the benefits of a newer home without the wait for construction. One of the home’s standout features is the spacious loft overlooking the stunning living room below, creating an airy and inviting feel. This versatile space can be transformed into the perfect relaxati
Key facts
- Grilling areas
- Pickleball courts
- Bocce ball courts
Tags
Property features AI
Finance
- Other: Front foot fee and HOA apply
- Financial info: Front foot fee of $595 paid annually
- HOA & community: HOA fee of $279 per month; Community pool included
Exterior
- Parking: Attached front-entry garage with 2 spaces
- Utilities: Public water; Public sewer; Natural gas heating; Tankless hot water
- Home design: Interior townhouse/rowhouse; Built by Lennar; Located in a senior community with a 50+ age requirement; Fee simple ownership
- Construction: Vinyl and aluminum siding; Shingle roof; Permanent foundation; Year built per assessor
- Exterior features: Community pool; Above-grade and below-grade structures noted
Interior
- Kitchen: Finished kitchen (appliances not specified)
- Bedrooms: Three bedrooms on the upper level
- Bathrooms: Two full bathrooms (upper levels); One half bathroom on the main level
- Heating & cooling: Central heating; Central cooling (natural gas for cooling fuel listed)
- Interior features: No basement; Finished above-grade living area
- Laundry & utility: Hot water provided by a tankless system
Neighborhood map
What this means for you Summary
Snapshot
- This is a 3-bed/2.5-bath townhouse listed at $315k. Condition is rated good.
Deal economics
- At list price, monthly cash flow is $185 ($2k/yr) — positive.
- The deal already cash-flows at list — no discount required.
- Meets the 1% rule at list price ($3k rent vs $315k).
- Cap rate 7.0% vs local median 4.8% in Waldorf — top-decile yield for the area; either an underpriced asset or a hidden risk that comps aren't pricing in. Stress-test before assuming the spread holds.
Location & tenants
- Location reads 72/100 on livability (#141 in MD) — a middle-class / working-renter tenant base. Strengths: commute A+, employment A+, housing A+; Watch: schools D+, crime D-, amenities F.
- Charles County Public Schools (suburban): math 13% / reading 29% proficiency, ranked #14 of 24 in MD (top 58%) — low school quality limits family demand, transient renter base, plan for 1-2y turnover.
- Market conditions: 245 active listings in the ZIP; 14 comparable units currently listed for rent nearby; rentals at typical pace (median 24d on market — plan ~3-4 weeks tenant-placement turnaround); high-income renter base; 1,542 units permitted in Charles County in 2024 (516 in 5+ unit buildings).
Forward outlook
- Local home prices are declining (-3.0%/yr); year-one equity from $2k of loan paydown is wiped out by about $9k of value loss. Plan a longer hold.
- Charles County population projected at +27% by 2050 — long-run rental-demand tailwind backs the buy-and-hold thesis.
Negotiation context
- Only 10 days on market — expect competitive offers; lowballing is unlikely to land.
- 2 sale attempts with the ask held roughly flat each time — persistent listings suggest the price (not the market) is what's stuck; bring a comps-based counter.
Risks & watch-outs
- Climate carrying-cost: major wind risk, 27% chance of damaging wind over 30y; extreme-heat days projected 7→16/yr by 2055 (HVAC capex compounding) — expect insurance premiums to compound above CPI over the hold.
Questions for the listing agent
- What does the HOA fee cover, when was the last increase, and are there any pending special assessments or reserve-fund shortfalls?
- Is there a deadline driving the sale (1031 exchange, divorce, estate, relocation)? That informs how much negotiation room exists.
- Schools are D-rated, which usually means shorter tenancies and higher turnover. Who's the typical renter profile here, and what's been the actual vacancy rate?
- Crime grade is D in this area — have there been break-ins, vandalism, or insurance claims at this property in the last 3 years? What carrier currently insures it and at what premium?
- What's the average days-on-market for RENTAL listings here right now (not sales)? A rising rental-DOM trend means longer vacancies and softer asking-rent achievability than the comps imply.
- What's the recent tenant-quality profile in this submarket — average credit score on applications, eviction rate, late-payment / NSF rate, and stable-employment percentage? A property-management company in the area should have these aggregated.
- How much new for-sale + rental construction is in the pipeline within 1–3 miles? Heavy new supply typically softens prices + rents 12–24 months out; constrained supply supports both.
Investment metrics
- 1% rule
- 1.07% ✓
- Cap rate
- 7.00%
- Cash-on-cash
- 2.51%
- DSCR
- 1.11
- GRM
- 7.8
CMA / ARV
- ARV (median comp)
- $458,027
- List price
- $315,000
- Delta
- -8.30%
- Verdict
- FAIR
- Comps
- 20 within 1.0 mi
Show comp detail 12 sales within ~0.75 mi
| Address | Dist | Beds/Ba | Sqft | Sold | Price | $/sf | Match |
|---|---|---|---|---|---|---|---|
| 10624 Great Basin Pl | 0.47mi | 3/2.5 | 2,172 (-4%) | 1mo | $424,990 | $196 | 71 |
| 10639 Great Basin Pl | 0.52mi | 3/2.5 | 2,172 (-4%) | 6mo | $482,065 | $222 | 64 |
| 10634 Great Basin Pl | 0.49mi | 4/3.5 (+1) | 2,322 (+3%) | 4mo | $414,990 | $179 | 60 |
| 11521 Charlotte Bronte Ln | 0.63mi | 3/3.0 | 2,400 (+6%) | 1mo | $455,000 | $190 | 58 |
| 10581 Great Basin Pl | 0.41mi | 4/3.5 (+1) | 2,450 (+8%) | 2mo | $497,790 | $203 | 56 |
| 10669 Millport St | 0.71mi | 3/3.0 | 2,351 (+4%) | 7mo | $389,990 | $166 | 52 |
| 10826 Cosmic Pl | 0.73mi | 3/3.0 | 2,355 (+4%) | 7mo | $409,990 | $174 | 51 |
| 10818 Cosmic Pl | 0.74mi | 3/3.0 | 2,355 (+4%) | 7mo | $436,390 | $185 | 51 |
| 11720 Emily Dickinson Pl | 0.61mi | 3/4.0 | 2,472 (+9%) | 5mo | $445,000 | $180 | 46 |
| 10671 Millport St | 0.71mi | 4/3.5 (+1) | 2,351 (+4%) | 7mo | $379,990 | $162 | 45 |
| 10560 Roundstone Ln | 0.74mi | 3/3.5 | 2,072 (-8%) | 7mo | $364,990 | $176 | 42 |
| 10558 Roundstone Ln | 0.74mi | 3/3.5 | 2,072 (-8%) | 7mo | $379,990 | $183 | 42 |
Match score weights: distance 35% · size 25% · config 20% · recency 20%. Top-matched comps best support the ARV.
Projected returns pro-forma
-3.0% appreciation · 3.0% rent growth · sell at horizon
- IRR
- -12.2%
- Equity multiple
- 0.56×
- Total profit
- $-39,042
- Equity at exit
- $46,968
- IRR
- -3.0%
- Equity multiple
- 0.80×
- Total profit
- $-17,867
- Equity at exit
- $27,235
Cash invested: $88,200 (down + closing). Projections, not guarantees.
Landlord ↔ Tenant lean methodology
- Overall (STATE)
- 27 Tenant-Leaning
- State Maryland
- 27 Tenant-Leaning · D+14
- County
- — inherits STATE
- City
- — inherits STATE
ZIP-level market 20695
- Home prices YoY
- -5.3%
- Active inventory
- 245
- Price-to-rent
- 7.8×
Monthly cashflow live
- Estimated rent
- $3,386 high interval (Pro) →
- Mortgage (P&I)
- −$1,652
- Tax from tax record
- −$428 /mo · $5,139/yr
- Insurance
- −$131
- HOA
- −$279
- Vacancy / Maint / Mgmt
- −$711
- Net cashflow
- $185
Break-even live
UW: 25.0% down · 7.5% · 30yr · 1.5% tax · 5.0% vac · 8.0% maint · 8.0% mgmt
Financing live
Cash to close
- Down payment
- $78,750
- Closing costs
- $9,450
- Reserves months
- —
- Total cash needed
- —
Loan-product check · same deal, 3 products live
Conventional
25% down · 7.5% · 30yr
- Down + closing
- —
- Monthly P&I
- —
- Monthly cashflow
- —
- DSCR
- —
- Eligible?
- —
Personal DTI + credit; lowest rate.
DSCR
20% down · 8.5% · 30yr
- Down + closing
- —
- Monthly P&I
- —
- Monthly cashflow
- —
- DSCR
- —
- Eligible?
- —
No personal income docs; deal must DSCR.
Hard money
10% down · 12.0% · 12mo
- Down + closing
- —
- Monthly P&I
- —
- Monthly cashflow
- —
- DSCR
- —
- Eligible?
- —
Short-term bridge; refi at stabilization.
Rent comps 14 comps
| Address | Beds | Baths | Sqft | Rent | $/sqft | DOM | Units | Dist |
|---|---|---|---|---|---|---|---|---|
| 3908 Glacier Bay Pl White Plains, MD | 3.0 | 2.5 | 2388 | $3,200 | $1.34 | 24d | 1 | 0.02mi |
| 4165 Brodie Pl White Plains, MD | 3.0 | 3.5 | 2544 | $3,000 | $1.18 | 17d | 1 | 0.58mi |
| 11180 Conway Pl White Plains, MD | 3.0 | 2.5 | 1765 | $3,258 | $1.85 | 5d | 7 | 0.66mi |
| 5692 Glencoe Pl White Plains, MD | 3.0 | 2.5 | 1942 | $3,332 | $1.72 | 1d | 2 | 0.68mi |
| 10893 Drummond Pl White Plains, MD | 3.0 | 2.5 | 2192 | $3,250 | $1.48 | 21d | 1 | 0.69mi |
| 5401 Phillis Wheatley Pl White Plains, MD | 3.0 | 3.5 | 2688 | $3,500 | $1.30 | 43d | 1 | 0.71mi |
| 10933 Drummond Pl Unit 10933 White Plains, MD | 3.0 | 3.0 | 2300 | $3,500 | $1.52 | 5d | 1 | 0.75mi |
| 10939 Drummond Pl White Plains, MD | 3.0 | 2.5 | 2192 | $3,500 | $1.60 | 24d | 1 | 0.76mi |
| 5527 Aberdeen Pl White Plains, MD | 3.0 | 4.0 | 1880 | $3,000 | $1.60 | 12d | 1 | 0.81mi |
| 10626 Roundstone Ln White Plains, MD | 3.0 | 3.5 | 2736 | $3,800 | $1.39 | 43d | 1 | 0.82mi |
| 5754 Frederick Douglas Pl White Plains, MD | 3.0 | 3.5 | 2220 | $3,500 | $1.58 | 43d | 1 | 0.93mi |
| 11472 Stockport Pl White Plains, MD | 4.0 | 3.5 | 2418 | $3,500 | $1.45 | 43d | 1 | 1.10mi |
| 1056 Rye Dr La Plata, MD | 4.0 | 3.5 | 2336 | $3,000 | $1.28 | 43d | 1 | 1.22mi |
| 981 Rye Dr La Plata, MD | 3.0 | 3.5 | 2380 | $3,000 | $1.26 | 24d | 1 | 1.26mi |
HOA detail
- Monthly dues
- $279 · $3,348/yr
Listing history 15 events
-
2026-06-18days on market $315,000 Active 10 DOM
-
2026-06-17days on market $315,000 Active 9 DOM
-
2026-06-16days on market $315,000 Active 8 DOM
-
2026-06-15days on market $315,000 Active 7 DOM
-
2026-06-13days on market $315,000 Active 5 DOM
-
2026-06-08remarks 693-char remark
-
2026-06-08pricedays on market $315,000 Active 1 DOM
-
2026-06-07days on market $420,000 Active 23 DOM
-
2026-06-04days on market $420,000 Active 20 DOM
-
2026-06-03days on market $420,000 Active 19 DOM
-
2026-06-02days on market $420,000 Active 18 DOM
-
2026-06-01days on market $420,000 Active 17 DOM
-
2026-05-31days on market $420,000 Active 16 DOM
-
2026-05-16$420,000 Active 1350-char remark
-
2026-04-22historical $420,000 1350-char remark
ⓘ Source: listings_history table (triggers on properties + properties_extension) + one-shot
backfill from property_details.listing_events for pre-trigger history.
Tax reassessment forecast MD · Partial reset (capped growth)
- Current annual tax
- $5,139 · $428/mo
- Projected year-2 tax
- $5,139 · $428/mo
- Expected delta
- $0/yr ($0/mo · 0.0%)
ⓘ Screening estimate from a state-policy table — verify with the county assessor before closing.
Climate risk First Street
- Flood 1/10 Low FEMA zone X (unshaded) · 0% chance over 30 yrs
- Wildfire 4/10 Moderate
- Heat 8/10 Severe 7 d/yr ≥102°F today · 16 d/yr by 30 yrs out
- Wind 6/10 Major 27% chance of damaging wind over 30 yrs
- Air quality 2/10 Low 1 unhealthy d/yr today · 2 by 30 yrs out
Nearby sold comps map
Loading sold comps map…
Walkable amenities ~0.75 mi
Loading nearby amenities…
Taxation est. · year 1
- Rental income
- $40,633
- − Mortgage interest
- −$17,645
- − Property taxes
- −$5,139
- − Insurance
- −$1,575
- − Repairs & maintenance
- −$3,251
- − Management
- −$3,251
- − HOA
- −$3,348
- − Depreciation
- −$9,164
- Taxable loss
- −$2,739
- Est. tax savings @ 24.0%
- +$657
- After-tax cash flow
- $2,873/yr
For passive investors: Depreciation is non-cash, so a rental often shows a tax loss while cash-flowing — sheltering income. Rental losses are passive: they offset passive income freely, and up to $25,000/yr can offset ordinary (W-2) income if you actively participate and your MAGI is under $100k (phasing out to $0 by $150k); unused losses carry forward. On sale, claimed depreciation is recaptured at up to 25%, and gains may owe capital-gains tax (a 1031 exchange can defer both). Figures are a year-1 estimate at your 24.0% rate — not tax advice; consult a CPA.
Condition & rehab AI · 5 photos
This townhouse is in good condition with a fresh exterior and interior, making it a great move-in-ready property.
Value-add opportunities
- Both Painting the exterior and interior — Fresh paint enhances curb appeal and interior aesthetics.
- Both Landscaping improvements — Enhances curb appeal and adds value to the property.
Renovation cost estimate screening
Value-add ROI direction
- Both Painting the exterior and interior — Fresh paint enhances curb appeal and interior aesthetics. ↑
- Both Landscaping improvements — Enhances curb appeal and adds value to the property. ↑
ⓘ Cost ranges are severity-bucket heuristics (US national rule-of-thumb). Get contractor quotes + a written scope before underwriting a rehab budget.
Schools (NCES district)
- District
- Charles County Public Schools
- NCES district ID
- 2400270
- Math proficiency
- 13% ▼ -19.00%
- Reading proficiency
- 29% ▼ -13.00%
- Median HH income
- $90,389
- Composite
- 22.54/100
- National rank
- #8087
- State rank
- #14 of 24 in MD
Livability — Waldorf
- Score
- 72/100
- State rank
- #141
- US rank
- #6083
Category grades
Schools grade is shown separately in the Schools card above.
Census & demographics
- Census place
- Waldorf, MD
- County
- Charles County · 103,527 people
- City population
- 103,527
- Metro
- Washington-Arlington-Alexandria, DC-VA-MD-WV
- Population (ZIP)
- 16,407
- Household income
- $141,959
- Rent vs Own
- Severe rent burden
- 311.0
Population outlook (Charles County) Hauer SSP2
- Today (2025)
- 176,616 people
- By 2030
- 186,471 · +5.6%
- By 2040
- 206,472 · +16.9%
- By 2050
- 224,883 · +27.3%
- By 2075
- 272,101 · +54.1%
- By 2100
- 303,564 · +71.9%
Race, ethnicity, and origin ACS 2023
- Neighborhood character
- Diverse neighborhood (Simpson 0.58)
- Race & ethnicity
- Black 61% White 23% Two or more races 9% Hispanic / Latino 4% Asian 2%
- Common ancestry
- Slovak 1% Italian 1% Lithuanian 1%
- Foreign-born
- 9% · Canada, South Korea
- Languages at home
- 91% English-only · Spanish 4% Tagalog/Filipino 1% French/Haitian/Cajun 1%
Political lean MEDSL · Charles
- 2024 margin
- Solid D (+40.7) · D 69.2% · R 28.5% · Other 2.2%
- 2008→2024 swing
- +15.2pp toward D · 2008: 25.5pp · 2024: 40.7pp
- All cycles
- 2024: D+40.7 2020: D+40.9 2016: D+30.2 2012: D+31.3 2008: D+25.5
Not yet ingested
- Civics
- —
Market trends
- HPI YoY
- ▼ -12.63%
- Current HPI
- 226.972
- Rent YoY
- —
- Metro
- Washington-Arlington-Alexandria, DC-VA-MD-WV
- State GDP YoY
- ▲ 2.97%
- F500 in state
- 12
Industry mix (Fortune 500 HQ in MD)
| Industry | F500 HQs | Revenue |
|---|---|---|
| Aerospace / Defense | 1 | $71B |
|
||
| Utilities | 1 | $25B |
|
||
| Hotels | 1 | $24B |
|
||
| Consumer Goods | 1 | $7B |
|
||
| Real Estate | 1 | $6B |
|
||
| Chemicals | 1 | $2B |
|
||
Price history
-25.0% since first listed4 events — show timeline
- 2026-06-08 Listed $315,000 BRIGHT MLS
- 2026-06-08 Listing Removed — BRIGHT MLS
- 2026-05-16 Listed $420,000 BRIGHT MLS
- 2026-04-22 Coming Soon — BRIGHT MLS
Property tax history
+125.6%/yrLatest (2025): $5,139 · +5.9% YoY. Source: county tax records.
Cash-flow waterfall
monthlySold comps — $/sqft
last 12 mo · ≤1 miLoading sold comps…