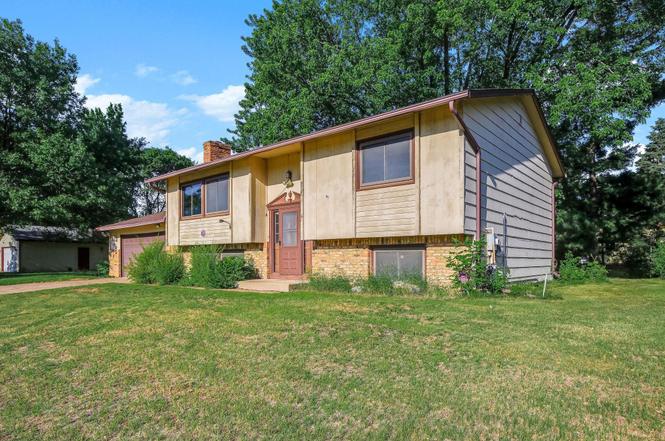
8009 Noble Ave N · Brooklyn Park, MN
Flood risk 1/10 · Minimal
- FEMA flood zone
- X (unshaded)
- Chance of flooding over 30 yrs
- 0.0%
- Est. flood insurance / yr
- $473 – $860
Fire risk 1/10 · Minimal
- Est. fire insurance / yr
- $888 – $1,650
Heat risk 2/10 · Minimal
- Hot days now (above 100°F)
- 7 days/yr
- Hot days in 30 yrs
- 14 days/yr
Wind risk 2/10 · Minimal
- Chance of severe wind over 30 yrs
- —
Air-quality risk 2/10 · Minimal
- Unhealthy air days now
- 2 days/yr
- Unhealthy air days in 30 yrs
- 2 days/yr
Risk factors via First Street. Map © Google.
Why this score? — see what drove the F grade
The composite is a weighted blend of 9 inputs, each scored 0–100. Each bar is that input's sub-score; the figure is the points it added to the 100-point composite (weight × sub-score).
- ARV discount +7.5/15.0
- Cash flow +4.6/30.0
- Schools +4.2/10.0
- Rent growth +4.1/5.0
- Livability +4.0/5.0
- Condition / age +2.5/5.0
- 1% rule +0.4/10.0
- DSCR +0.0/10.0
- Appreciation +0.0/10.0
$270,000
🖨 Deal sheet 📄 Offer letter ✓ Due diligence
Listing remarks
Vaulted ceilings with exposed beams and expansive windows give this home a sense of character that's hard to find in newer construction. The main living area feels bright and open, featuring a welcoming living room, dining space with access to the deck, and a functional kitchen at the heart of it all. Two bedrooms and a full bathroom complete the main level. Downstairs, the finished lower level offers two additional bedrooms, a 3/4 bathroom, and a spacious family room anchored by a classic brick fireplace. Natural light fills the living spaces throughout, highlighting the home's unique architectural details and inviting layout. Outside, the large backyard provides plenty of room for outdoor
Key facts
- Expansive windows
- Exposed beams
- Vaulted ceilings
Tags
Property features AI
Exterior
- Parking: Attached 2-car garage (24 x 24, concrete, electric)
- Security: Security system
- Utilities: City water (connected); City sewer (connected); Natural gas fuel; Electric service with circuit breakers (100 amp)
- Home design: Residential split-entry (bi-level) design; Main entry on main level
- Construction: Frame construction; Block foundation
- Exterior features: Deck; Partial chain link fencing; Storage shed; Lot approximately 0.25 acres (84 x 130)
Interior
- Kitchen: Range; Dishwasher; Refrigerator; Freezer; Kitchen with breakfast bar and kitchen/dining area
- Bedrooms: 4 bedrooms total; Main level bedrooms included (several bedrooms on main level and lower level)
- Bathrooms: Main floor full bathroom; Basement 3/4 bathroom
- Heating & cooling: Forced air heating; Central air conditioning
- Interior features: Finished full basement with daylight/lookout windows; Vaulted ceilings; Natural woodwork; Security system; Stone and wood exterior accents; Fireplace (brick, wood-burning) in the family room; Kitchen window; Main floor primary bedroom
- Laundry & utility: Washer; Dryer; Gas water heater; Water softener (owned); Humidifier
Neighborhood map
What this means for you Summary
Snapshot
- This is a 2-bed/2.0-bath single-family listed at $270k.
Deal economics
- At list price, monthly cash flow is $-689 ($-8k/yr) — negative.
- To cash-flow at today's rent, offer at most $148k (45.1% below list).
- To meet the 1% rule (rent ≥ 1% of price), the offer needs to be $146k (45.7% below list).
- Recommended offer: $146k (45.7% below list) — sets the bar for 1% rule.
Location & tenants
- Location reads 81/100 on livability (#50 in MN, #1,308 nationally) — a professional / high-income tenant draw. Strengths: commute A+, employment A+, housing A+; Watch: crime C-, schools D, amenities F.
- Osseo Public School District (suburban): math 42% / reading 51% proficiency, ranked #129 of 301 in MN (top 43%) — families likely to look elsewhere, expect single-tenant / working-renter base with shorter leases.
- Market conditions: Rents rising fast (+6.3%/yr); 169 active listings in the ZIP; 19 comparable units currently listed for rent nearby; rentals leasing fast (median 10d on market — plan ~1-2 weeks tenant-placement turnaround); solid renter incomes; 4,651 units permitted in Hennepin County in 2024 (2,443 in 5+ unit buildings).
Forward outlook
- Local home prices are declining (-3.0%/yr); year-one equity from $2k of loan paydown is wiped out by about $8k of value loss. Plan a longer hold.
- Hennepin County population projected at +30% by 2050 — long-run rental-demand tailwind backs the buy-and-hold thesis.
Negotiation context
- Only 1 days on market — expect competitive offers; lowballing is unlikely to land.
- Current owner paid $83k; list at $270k implies a 225% gain — meaningful room to come down on a strong offer.
Questions for the listing agent
- What do current leases actually rent for vs. the listed asking? Can we see a recent rent roll and the last 12 months of T-12 income?
- Built in 1977 — when were the roof, HVAC, electrical panel, plumbing, and water heater last replaced?
- Is there a deadline driving the sale (1031 exchange, divorce, estate, relocation)? That informs how much negotiation room exists.
- Schools are D-rated, which usually means shorter tenancies and higher turnover. Who's the typical renter profile here, and what's been the actual vacancy rate?
- The area grade is low — what's the realistic commute time and amenity access for the typical tenant pool here? Any planned neighborhood developments (good or bad) we should know about?
- What's the average days-on-market for RENTAL listings here right now (not sales)? A rising rental-DOM trend means longer vacancies and softer asking-rent achievability than the comps imply.
- What's the recent tenant-quality profile in this submarket — average credit score on applications, eviction rate, late-payment / NSF rate, and stable-employment percentage? A property-management company in the area should have these aggregated.
- How much new for-sale + rental construction is in the pipeline within 1–3 miles? Heavy new supply typically softens prices + rents 12–24 months out; constrained supply supports both.
Investment metrics
- 1% rule
- 0.54% ✗
- Cap rate
- 3.23%
- Cash-on-cash
- -10.94%
- DSCR
- 0.51
- GRM
- 15.4
CMA / ARV
No comps found within radius.
Projected returns pro-forma
-3.0% appreciation · 6.26% rent growth · sell at horizon
- IRR
- -32.8%
- Equity multiple
- -0.09×
- Total profit
- $-82,663
- Equity at exit
- $40,258
- IRR
- -25.9%
- Equity multiple
- -0.41×
- Total profit
- $-106,676
- Equity at exit
- $23,345
Cash invested: $75,600 (down + closing). Projections, not guarantees.
Landlord ↔ Tenant lean methodology
- Overall (STATE)
- 46 Balanced
- State Minnesota
- 46 Balanced · D+2
- County
- — inherits STATE
- City
- — inherits STATE
ZIP-level market 55443
- Rents YoY
- 6.3%
- Active inventory
- 169
- Price-to-rent
- 15.4×
Monthly cashflow live
- Estimated rent
- $1,465 high interval (Pro) →
- Mortgage (P&I)
- −$1,416
- Tax from tax record
- −$318 /mo · $3,813/yr
- Insurance
- −$112
- HOA
- −$0
- Vacancy / Maint / Mgmt
- −$308
- Net cashflow
- $-689
Break-even live
UW: 25.0% down · 7.5% · 30yr · 1.5% tax · 5.0% vac · 8.0% maint · 8.0% mgmt
Financing live
Cash to close
- Down payment
- $67,500
- Closing costs
- $8,100
- Reserves months
- —
- Total cash needed
- —
Loan-product check · same deal, 3 products live
Conventional
25% down · 7.5% · 30yr
- Down + closing
- —
- Monthly P&I
- —
- Monthly cashflow
- —
- DSCR
- —
- Eligible?
- —
Personal DTI + credit; lowest rate.
DSCR
20% down · 8.5% · 30yr
- Down + closing
- —
- Monthly P&I
- —
- Monthly cashflow
- —
- DSCR
- —
- Eligible?
- —
No personal income docs; deal must DSCR.
Hard money
10% down · 12.0% · 12mo
- Down + closing
- —
- Monthly P&I
- —
- Monthly cashflow
- —
- DSCR
- —
- Eligible?
- —
Short-term bridge; refi at stabilization.
Rent comps 19 comps
| Address | Beds | Baths | Sqft | Rent | $/sqft | DOM | Units | Dist |
|---|---|---|---|---|---|---|---|---|
| 8447 Regent Ave N Minneapolis, MN | 1.0–2.0 | 1.0–2.0 | 1000 | $1,555 | $1.55 | 2d | 5 | 0.56mi |
| 5528 Brookdale Dr N Minneapolis, MN | 3.0 | 2.0 | 1400 | $2,195 | $1.57 | 43d | 1 | 0.59mi |
| 5521 Brookdale Dr N Brooklyn Park, MN | 1.0–2.0 | 1.0 | 855 | $1,525 | $1.78 | 1d | 10 | 0.63mi |
| 8104 Zane Ave N Minneapolis, MN | 1.0–2.0 | 1.0 | 900 | $1,395 | $1.55 | 17d | 3 | 0.67mi |
| 7870 Zane Ave N Minneapolis, MN | 1.0–2.0 | 1.0 | 760 | $1,375 | $1.81 | 1d | 12 | 0.68mi |
| 7449 Imperial Dr N Minneapolis, MN | 3.0 | 1.0 | 775 | $1,376 | $1.78 | 43d | 1 | 0.74mi |
| 7449 Imperial Dr N Minneapolis, MN | 1.0 | 1.0 | 700 | $1,159 | $1.66 | 10d | 3 | 0.74mi |
| 8304 Zane Ave N Unit North-312 Minneapolis, MN | 2.0 | 1.5 | 1000 | $1,195 | $1.20 | 4d | 1 | 0.74mi |
| 8308 Zane Ave N Unit North-106 Brooklyn Park, MN | 2.0 | 1.5 | 1000 | $1,195 | $1.20 | 4d | 1 | 0.76mi |
| 8300 Zane Ave N Minneapolis, MN | 1.0–2.0 | 1.0–1.5 | 868 | $1,195 | $1.38 | 4d | 5 | 0.78mi |
| 8217 Zane Ct N Unit 8221 Minneapolis, MN | 2.0 | 1.0 | 1000 | $1,575 | $1.57 | 2d | 1 | 0.80mi |
| 8316 Zane Ave N Unit NORTH-207 Brooklyn Park, MN | 3.0 | 1.5 | 1370 | $1,695 | $1.24 | 43d | 1 | 0.80mi |
| 6200 78th Ave N Minneapolis, MN | 1.0 | 1.0 | 750 | $1,092 | $1.46 | 1d | 3 | 0.82mi |
| 5840 73rd Ave N Minneapolis, MN | 1.0–2.0 | 1.0 | 1031 | $1,650 | $1.60 | 14d | 1 | 1.06mi |
| 8425 Brunswick Ave N Minneapolis, MN | 2.0 | 1.0 | 1032 | $1,850 | $1.79 | 43d | 1 | 1.10mi |
| 7021 Brooklyn Blvd Unit 7021-219 Brooklyn Center, MN | 1.0 | 1.0 | 725 | $1,149 | $1.58 | 43d | 1 | 1.19mi |
| 7021 Brooklyn Blvd Unit 7021-216 Brooklyn Center, MN | 2.0 | 1.0 | 825 | $1,399 | $1.70 | 43d | 1 | 1.19mi |
| 7531 Jersey Ave N Minneapolis, MN | 1.0–2.0 | 1.0 | 880 | $1,415 | $1.61 | 2d | 10 | 1.45mi |
| 5625 69th Ave N Minneapolis, MN | 1.0–2.0 | 1.0 | 750 | $1,435 | $1.91 | 24d | 11 | 1.48mi |
Listing history 2 events
-
2026-06-17remarks 699-char remark
-
2026-06-17$270,000 Coming Soon 1 DOM
ⓘ Source: listings_history table (triggers on properties + properties_extension) + one-shot
backfill from property_details.listing_events for pre-trigger history.
Tax reassessment forecast MN · Partial reset (capped growth)
- Current annual tax
- $3,813 · $318/mo
- Projected year-2 tax
- $3,813 · $318/mo
- Expected delta
- $0/yr ($0/mo · 0.0%)
ⓘ Screening estimate from a state-policy table — verify with the county assessor before closing.
Climate risk First Street
- Flood 1/10 Low FEMA zone X (unshaded) · 0% chance over 30 yrs
- Wildfire 1/10 Low
- Heat 2/10 Low 7 d/yr ≥100°F today · 14 d/yr by 30 yrs out
- Wind 2/10 Low
- Air quality 2/10 Low 2 unhealthy d/yr today · 2 by 30 yrs out
Nearby sold comps map
Loading sold comps map…
Walkable amenities ~0.75 mi
Loading nearby amenities…
Taxation est. · year 1
- Rental income
- $17,577
- − Mortgage interest
- −$15,124
- − Property taxes
- −$3,813
- − Insurance
- −$1,350
- − Repairs & maintenance
- −$1,406
- − Management
- −$1,406
- − Depreciation
- −$7,855
- Taxable loss
- −$13,377
- Est. tax savings @ 24.0%
- +$3,210
- After-tax cash flow
- $-5,058/yr
For passive investors: Depreciation is non-cash, so a rental often shows a tax loss while cash-flowing — sheltering income. Rental losses are passive: they offset passive income freely, and up to $25,000/yr can offset ordinary (W-2) income if you actively participate and your MAGI is under $100k (phasing out to $0 by $150k); unused losses carry forward. On sale, claimed depreciation is recaptured at up to 25%, and gains may owe capital-gains tax (a 1031 exchange can defer both). Figures are a year-1 estimate at your 24.0% rate — not tax advice; consult a CPA.
Schools (NCES district)
- District
- Osseo Public School District
- NCES district ID
- 2725200
- Math proficiency
- 42% ▼ -7.00%
- Reading proficiency
- 51% ▼ -4.00%
- Median HH income
- $76,168
- Composite
- 42.35/100
- National rank
- #3250
- State rank
- #129 of 301 in MN
Livability — Brooklyn Park
- Score
- 81/100
- State rank
- #50
- US rank
- #1308
Category grades
Schools grade is shown separately in the Schools card above.
Census & demographics
- Census place
- Brooklyn Park, MN
- County
- Hennepin County · 1,150,272 people
- City population
- 33,660
- Metro
- Minneapolis-St. Paul-Bloomington, MN-WI
- Population (ZIP)
- 33,660
- Household income
- $95,082
- Rent vs Own
- Severe rent burden
- 968.0
Population outlook (Hennepin County) Hauer SSP2
- Today (2025)
- 1,405,227 people
- By 2030
- 1,492,650 · +6.2%
- By 2040
- 1,660,157 · +18.1%
- By 2050
- 1,823,498 · +29.8%
- By 2075
- 2,221,283 · +58.1%
- By 2100
- 2,509,976 · +78.6%
Race, ethnicity, and origin ACS 2023
- Neighborhood character
- Highly diverse neighborhood (Simpson 0.71)
- Race & ethnicity
- White 40% Black 30% Asian 19% Two or more races 8% Hispanic / Latino 4%
- Common ancestry
- Portuguese 7% Swiss 4% Romanian 3%
- Foreign-born
- 25% · Vietnam, Canada, South Korea
- Languages at home
- 71% English-only · Other Asian/Pacific 10% Vietnamese 4% Spanish 2%
Political lean MEDSL · Hennepin
- 2024 margin
- Solid D (+42.6) · D 70.2% · R 27.5% · Other 2.3%
- 2008→2024 swing
- +14.0pp toward D · 2008: 28.6pp · 2024: 42.6pp
- All cycles
- 2024: D+42.6 2020: D+43.2 2016: D+35.3 2012: D+27.1 2008: D+28.6
Not yet ingested
- Civics
- —
Market trends
- HPI YoY
- ▼ -199.26%
- Current HPI
- 206.3855
- Rent YoY
- ▲ 6.26%
- Metro
- Minneapolis-St. Paul-Bloomington, MN-WI
- State GDP YoY
- ▲ 2.41%
- F500 in state
- 34
Industry mix (Fortune 500 HQ in MN)
| Industry | F500 HQs | Revenue |
|---|---|---|
| Healthcare | 2 | $407B |
|
||
| Retail | 2 | $150B |
|
||
| Consumer Goods | 2 | $32B |
|
||
| Industrial Machinery | 2 | $6B |
|
||
| Agriculture | 1 | $40B |
|
||
| Healthcare / Medical Devices | 1 | $32B |
|
||
Price history
+383.0% since first listed3 events — show timeline
- 2026-06-17 Coming Soon $270,000 NORTHSTARMLS as Distributed by MLS Grid
- 1986-04-01 Sold (Public Records) $83,000 Public Records
- 1977-07-01 Sold (Public Records) $55,900 Public Records
Property tax history
+4.1%/yrLatest (2025): $3,813 · +0.2% YoY. Source: county tax records.
Cash-flow waterfall
monthlySold comps — $/sqft
last 12 mo · ≤1 miLoading sold comps…