45706 Belvoir Rd · California, MD
Flood risk 7/10 · Major
- FEMA flood zone
- X (unshaded)
- Chance of flooding over 30 yrs
- 0.76%
- Est. flood insurance / yr
- $473 – $860
Fire risk 4/10 · Minor
- Est. fire insurance / yr
- $755 – $1,403
Heat risk 9/10 · Severe
- Hot days now (above 101°F)
- 7 days/yr
- Hot days in 30 yrs
- 17 days/yr
Wind risk 6/10 · Moderate
- Chance of severe wind over 30 yrs
- 71.0%
Air-quality risk 2/10 · Minimal
- Unhealthy air days now
- 1 days/yr
- Unhealthy air days in 30 yrs
- 2 days/yr
Risk factors via First Street. Map © Google.
Why this score? — see what drove the C- grade
The composite is a weighted blend of 9 inputs, each scored 0–100. Each bar is that input's sub-score; the figure is the points it added to the 100-point composite (weight × sub-score).
- Cash flow +16.2/30.0
- ARV discount +15.0/15.0
- DSCR +5.0/10.0
- 1% rule +3.7/10.0
- Livability +3.7/5.0
- Schools +3.0/10.0
- Rent growth +2.5/5.0
- Condition / age +2.5/5.0
- Appreciation +0.0/10.0
$325,000
🖨 Deal sheet (PDF) 📄 Offer letter ✓ Due diligence
Listing remarks
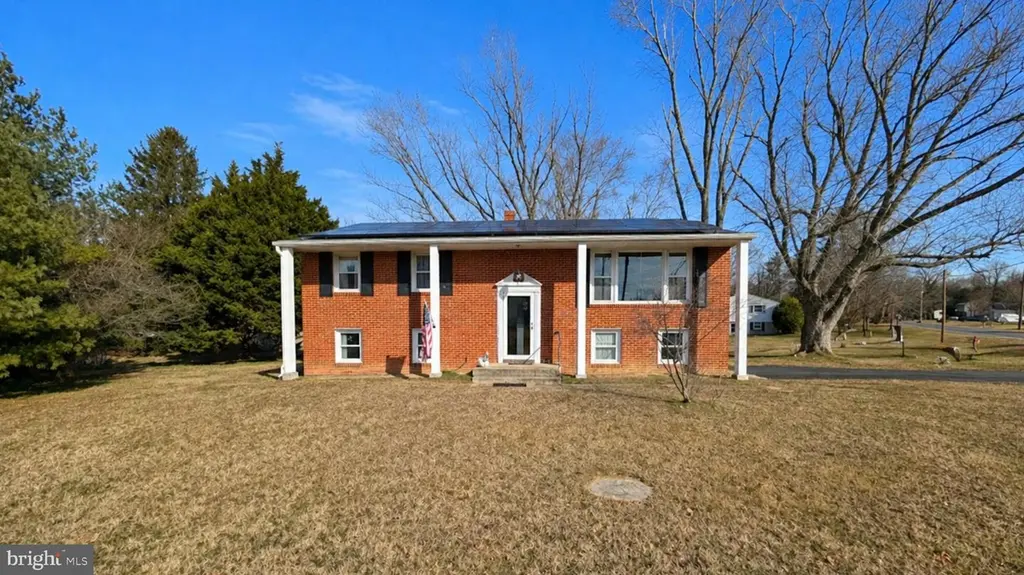
Welcome to this spacious home set on a large lot, offering sought-after features including energy-efficient solar panels. This split-foyer design includes an attached garage and is ideally located for an easy commute to Pax River, with convenient access to shopping and dining. Featuring 5 bedrooms and 2 bathrooms, this home provides plenty of space for comfortable living. Come take a tour today!
Key facts
- 0.6 acre lot
- 2 garage spots
- Built 1962
Property features AI
Finance
- Other: Finished below-grade area of 887; Above-grade finished area of 1,251
- Financial info: Fee simple ownership
Exterior
- Parking: Attached front-entry 2-car garage
- Utilities: Public water; Public sewer; Electric service for heating/cooling/hot water
- Home design: Detached structure; Frame construction
- Construction: Frame construction; Slab foundation
- Exterior features: Below-grade finished area present
Interior
- Bedrooms: Three bedrooms on the upper level; Two bedrooms on the main level
- Bathrooms: Two full bathrooms (one on main level, one on upper level)
- Heating & cooling: Central heating; Electric hot water; Other-type cooling with electric fuel
- Interior features: No basement
Neighborhood map
What this means for you Summary
Snapshot
- This is a 5-bed/2.0-bath single-family listed at $325k.
Deal economics
- At list price, monthly cash flow is $119 ($1k/yr) — positive.
- The deal already cash-flows at list — no discount required.
- To meet the 1% rule (rent ≥ 1% of price), the offer needs to be $282k (13.1% below list).
- Recommended offer: $282k (13.1% below list) — sets the bar for 1% rule.
- Cap rate 6.9% vs local median 4.2% in California — top-decile yield for the area; either an underpriced asset or a hidden risk that comps aren't pricing in. Stress-test before assuming the spread holds.
Location & tenants
- Location reads 73/100 on livability (#127 in MD) — a middle-class / working-renter tenant base. Strengths: employment A+, housing A+, health & safety A+; Watch: crime D+, amenities F, commute F.
- St. Mary'S County Public Schools (rural): math 23% / reading 38% proficiency, ranked #8 of 24 in MD (top 33%) — families likely to look elsewhere, expect single-tenant / working-renter base with shorter leases.
- Zoned schools: Greenview Knolls Elementary (math 12% / reading 17%, grade F, #477 of 860 statewide, top 59%, 412 students, 62% FRL); Esperanza Middle (math 18% / reading 41%, grade F, #67 of 225 statewide, top 32%, 875 students, 41% FRL); Great Mills High (math 42% / reading 55%, grade D, #111 of 222 statewide, top 50%, 1,779 students, 55% FRL) — zoned schools average 53% FRL vs 28% district-wide (25 pts higher); higher-poverty schools than district average — tighter screening recommended.
- Market conditions: 31 active listings in the ZIP; high-income renter base; 265 units permitted in St. Mary's County in 2024 (0 in 5+ unit buildings).
Forward outlook
- Local home prices are declining (-3.0%/yr); year-one equity from $2k of loan paydown is wiped out by about $10k of value loss. Plan a longer hold.
- St. Mary's County population projected at +16% by 2050 — long-run rental-demand tailwind backs the buy-and-hold thesis.
Negotiation context
- It's been on market 55 days — a 3% lower offer ($315k) is reasonable based on typical stale-listing flexibility.
- Current owner paid $144k; list at $325k implies a 126% gain — meaningful room to come down on a strong offer.
Risks & watch-outs
- Watch-outs: flood insurance adds $56/mo.
- Climate carrying-cost: major flood risk; major wind risk, 71% chance of damaging wind over 30y; extreme-heat days projected 7→17/yr by 2055 (HVAC capex compounding) — expect insurance premiums to compound above CPI over the hold.
Questions for the listing agent
- It's been on market 55 days. Have you received any prior offers? Is the seller open to a 13% concession, seller financing, or rate buy-down credit?
- Built in 1962 — when were the roof, HVAC, electrical panel, plumbing, and water heater last replaced?
- What's the actual annual flood-insurance premium (NFIP or private), and is the property in a SFHA with mandatory coverage?
- Is there a deadline driving the sale (1031 exchange, divorce, estate, relocation)? That informs how much negotiation room exists.
- Crime grade is D in this area — have there been break-ins, vandalism, or insurance claims at this property in the last 3 years? What carrier currently insures it and at what premium?
- What's the average days-on-market for RENTAL listings here right now (not sales)? A rising rental-DOM trend means longer vacancies and softer asking-rent achievability than the comps imply.
- What's the recent tenant-quality profile in this submarket — average credit score on applications, eviction rate, late-payment / NSF rate, and stable-employment percentage? A property-management company in the area should have these aggregated.
- How much new for-sale + rental construction is in the pipeline within 1–3 miles? Heavy new supply typically softens prices + rents 12–24 months out; constrained supply supports both.
Investment metrics
- 1% rule
- 0.87% ✗
- Cap rate
- 6.94%
- Cash-on-cash
- 2.31%
- DSCR
- 1.10
- GRM
- 9.6
CMA / ARV
- ARV (median comp)
- $402,447
- List price
- $325,000
- Delta
- -19.24%
- Verdict
- UNDERPRICED
- Comps
- 20 within 1.0 mi
Show comp detail 12 sales within ~0.75 mi
| Address | Dist | Beds/Ba | Sqft | Sold | Price | $/sf | Match |
|---|---|---|---|---|---|---|---|
| 45655 Centerview Ln | 0.08mi | 4/2.5 (-1) | 2,088 (-2%) | 4mo | $419,900 | $201 | 82 |
| 22190 Goldenrod Dr | 0.34mi | 4/2.5 (-1) | 2,084 (-2%) | 5mo | $430,000 | $206 | 69 |
| 45621 Taras Ct | 0.36mi | 4/2.5 (-1) | 2,232 (+4%) | 1mo | $440,000 | $197 | 68 |
| 22380 Gough Ter | 0.37mi | 4/3.0 (-1) | 2,212 (+4%) | 5mo | $375,000 | $170 | 64 |
| 45854 Church Dr | 0.41mi | 4/3.0 (-1) | 2,079 (-3%) | 11mo | $420,000 | $202 | 58 |
| 45867 Broun Ter | 0.35mi | 6/3.0 (+1) | 2,279 (+7%) | 8mo | $326,000 | $143 | 57 |
| 22254 Linwood Way | 0.42mi | 4/3.0 (-1) | 2,092 (-2%) | 18mo | $375,000 | $179 | 53 |
| 22136 Snapdragon Ct | 0.32mi | 4/3.5 (-1) | 2,382 (+11%) | 2mo | $489,900 | $206 | 53 |
| 22121 Goldenrod Dr | 0.41mi | 4/2.5 (-1) | 2,313 (+8%) | 15mo | $410,000 | $177 | 48 |
| 45538 Longfields Blvd | 0.49mi | 4/2.5 (-1) | 2,316 (+8%) | 17mo | $427,500 | $185 | 42 |
| 21897 Chancellors Run Rd | 0.62mi | 4/2.0 (-1) | 2,310 (+8%) | 17mo | $370,000 | $160 | 38 |
| 22526 Duleek Way | 0.67mi | 4/3.5 (-1) | 2,018 (-6%) | 15mo | $360,000 | $178 | 36 |
Match score weights: distance 35% · size 25% · config 20% · recency 20%. Top-matched comps best support the ARV.
Projected returns pro-forma
-3.0% appreciation · 3.0% rent growth · sell at horizon
- IRR
- -13.8%
- Equity multiple
- 0.50×
- Total profit
- $-45,105
- Equity at exit
- $48,459
- IRR
- -5.0%
- Equity multiple
- 0.67×
- Total profit
- $-29,654
- Equity at exit
- $28,100
Cash invested: $91,000 (down + closing). Projections, not guarantees.
Landlord ↔ Tenant lean methodology
- Overall (STATE)
- 27 Tenant-Leaning
- State Maryland
- 27 Tenant-Leaning · D+14
- County
- — inherits STATE
- City
- — inherits STATE
ZIP-level market 20634
- Home prices YoY
- -5.7%
- Active inventory
- 31
- Price-to-rent
- 9.6×
Monthly cashflow live
- Estimated rent
- $2,823 medium interval (Pro) →
- Mortgage (P&I)
- −$1,704
- Tax from tax record
- −$216 /mo · $2,591/yr
- Insurance
- −$135
- Flood insurance flood zone
- −$56 /mo · $666/yr
- HOA
- −$0
- Lot rent
- −$0
- Vacancy / Maint / Mgmt
- −$593
- Net cashflow
- $119
Break-even live
Sensitivity live
| Price | -10% $303 | -5% $211 | +0% $119 | +5% $27 | +10% $-65 |
|---|---|---|---|---|---|
| Rent | -10% $-104 | -5% $8 | +0% $119 | +5% $231 | +10% $342 |
| Rate | -1.0pp $283 | -0.5pp $202 | base $119 | +0.5pp $35 | +1.0pp $-51 |
UW: 25.0% down · 7.5% · 30yr · 1.5% tax · 5.0% vac · 8.0% maint · 8.0% mgmt
Financing live
Cash to close
- Down payment
- $81,250
- Closing costs
- $9,750
- Reserves months
- —
- Total cash needed
- —
Loan-product check · same deal, 3 products live
Conventional
25% down · 7.5% · 30yr
- Down + closing
- —
- Monthly P&I
- —
- Monthly cashflow
- —
- DSCR
- —
- Eligible?
- —
Personal DTI + credit; lowest rate.
DSCR
20% down · 8.5% · 30yr
- Down + closing
- —
- Monthly P&I
- —
- Monthly cashflow
- —
- DSCR
- —
- Eligible?
- —
No personal income docs; deal must DSCR.
Hard money
10% down · 12.0% · 12mo
- Down + closing
- —
- Monthly P&I
- —
- Monthly cashflow
- —
- DSCR
- —
- Eligible?
- —
Short-term bridge; refi at stabilization.
Listing history 21 events
-
2026-06-22days on market $325,000 Coming Soon 55 DOM
-
2026-06-21days on market $325,000 Coming Soon 54 DOM
-
2026-06-19days on market $325,000 Coming Soon 52 DOM
-
2026-06-18days on market $325,000 Coming Soon 51 DOM
-
2026-06-17days on market $325,000 Coming Soon 50 DOM
-
2026-06-16days on market $325,000 Coming Soon 49 DOM
-
2026-06-15days on market $325,000 Coming Soon 48 DOM
-
2026-06-14days on market $325,000 Coming Soon 46 DOM
-
2026-06-12days on market $325,000 Coming Soon 45 DOM
-
2026-06-09days on market $325,000 Coming Soon 42 DOM
-
2026-06-08days on market $325,000 Coming Soon 41 DOM
-
2026-06-07days on market $325,000 Coming Soon 40 DOM
-
2026-06-05days on market $325,000 Coming Soon 37 DOM
-
2026-06-02days on market $325,000 Coming Soon 35 DOM
-
2026-06-01days on market $325,000 Coming Soon 34 DOM
-
2026-05-31days on market $325,000 Coming Soon 33 DOM
-
2026-05-30days on market $325,000 Coming Soon 32 DOM
-
2026-04-28historical $325,000 398-char remark
-
2001-07-19soldstatus $144,000
-
1987-06-26soldstatus $91,971
-
1986-08-07soldstatus $87,500
ⓘ Source: listings_history table (triggers on properties + properties_extension) + one-shot
backfill from property_details.listing_events for pre-trigger history.
Tax reassessment forecast MD · Partial reset (capped growth)
- Current annual tax
- $2,591 · $216/mo
- Projected year-2 tax
- $3,067 · $256/mo
- Expected delta
- +$476/yr (+$40/mo · 18.4%)
ⓘ Screening estimate from a state-policy table — verify with the county assessor before closing.
Climate risk First Street
- Flood 7/10 Severe FEMA zone X (unshaded) · 76% chance over 30 yrs
- Wildfire 4/10 Moderate
- Heat 9/10 Extreme 7 d/yr ≥101°F today · 17 d/yr by 30 yrs out
- Wind 6/10 Major 71% chance of damaging wind over 30 yrs
- Air quality 2/10 Low 1 unhealthy d/yr today · 2 by 30 yrs out
Nearby sold comps map
Loading sold comps map…
Walkable amenities ~0.75 mi
Loading nearby amenities…
Taxation est. · year 1
- Rental income
- $33,881
- − Mortgage interest
- −$18,205
- − Property taxes
- −$2,591
- − Insurance
- −$2,292
- − Repairs & maintenance
- −$2,710
- − Management
- −$2,710
- − Depreciation
- −$9,455
- Taxable loss
- −$4,082
- Est. tax savings @ 24.0%
- +$980
- After-tax cash flow
- $2,411/yr
For passive investors: Depreciation is non-cash, so a rental often shows a tax loss while cash-flowing — sheltering income. Rental losses are passive: they offset passive income freely, and up to $25,000/yr can offset ordinary (W-2) income if you actively participate and your MAGI is under $100k (phasing out to $0 by $150k); unused losses carry forward. On sale, claimed depreciation is recaptured at up to 25%, and gains may owe capital-gains tax (a 1031 exchange can defer both). Figures are a year-1 estimate at your 24.0% rate — not tax advice; consult a CPA.
Schools (NCES district)
- District
- St. Mary'S County Public Schools
- NCES district ID
- 2400600
- Math proficiency
- 23% ▼ -23.00%
- Reading proficiency
- 38% ▼ -12.00%
- Median HH income
- $83,240
- Composite
- 29.74/100
- National rank
- #6444
- State rank
- #8 of 24 in MD
Livability — California
- Score
- 73/100
- State rank
- #127
- US rank
- #5421
Category grades
Schools grade is shown separately in the Schools card above.
Census & demographics
- Census place
- California, MD
- County
- Saint Marys County · 48,152 people
- City population
- 14,212
- Metro
- California-Lexington Park, MD
- Population (ZIP)
- 7,088
- Household income
- $139,375
- Rent vs Own
- Severe rent burden
- 111.0
Population outlook (St. Mary's County) Hauer SSP2
- Today (2025)
- 123,125 people
- By 2030
- 128,374 · +4.3%
- By 2040
- 137,305 · +11.5%
- By 2050
- 143,065 · +16.2%
- By 2075
- 153,408 · +24.6%
- By 2100
- 151,790 · +23.3%
Race, ethnicity, and origin ACS 2023
- Neighborhood character
- Diverse neighborhood (Simpson 0.58)
- Race & ethnicity
- White 57% Black 31% Two or more races 6% Hispanic / Latino 5% Asian 3%
- Common ancestry
- Slovak 3% Romanian 2% Lithuanian 2%
- Foreign-born
- 6% · Canada
- Languages at home
- 95% English-only · Spanish 2% Tagalog/Filipino 1% Other Asian/Pacific 1%
Political lean MEDSL · St. Mary's
- 2024 margin
- R (+17.2) · D 40.2% · R 57.4% · Other 2.4%
- 2008→2024 swing
- -4.4pp toward R · 2008: -12.8pp · 2024: -17.2pp
- All cycles
- 2024: R+17.2 2020: R+13.8 2016: R+24.6 2012: R+16.1 2008: R+12.8
Not yet ingested
- Civics
- —
Market trends
- HPI YoY
- ▼ -14.78%
- Current HPI
- 244.1447
- Rent YoY
- —
- Metro
- California-Lexington Park, MD
- State GDP YoY
- ▲ 2.97%
- F500 in state
- 12
Industry mix (Fortune 500 HQ in MD)
| Industry | F500 HQs | Revenue |
|---|---|---|
| Aerospace / Defense | 1 | $71B |
|
||
| Utilities | 1 | $25B |
|
||
| Hotels | 1 | $24B |
|
||
| Consumer Goods | 1 | $7B |
|
||
| Real Estate | 1 | $6B |
|
||
| Chemicals | 1 | $2B |
|
||
Price history
+271.4% since first listed4 events — show timeline
- 2026-04-28 Coming Soon $325,000 BRIGHT MLS
- 2001-07-19 Sold (Public Records) $144,000 Public Records
- 1987-06-26 Sold (Public Records) $91,971 Public Records
- 1986-08-07 Sold (Public Records) $87,500 Public Records
Property tax history
+3.2%/yrLatest (2025): $2,591 · +3.7% YoY. Source: county tax records.
Cash-flow waterfall
monthlySold comps — $/sqft
last 12 mo · ≤1 miLoading sold comps…