 Duplex
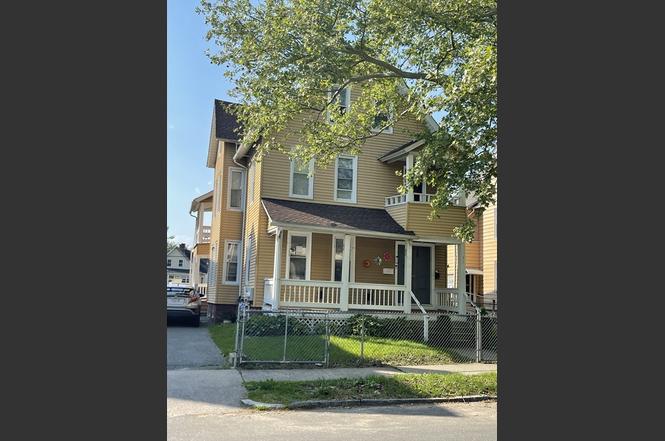
52 Acushnet St · Springfield, MA
Flood risk No data
- FEMA flood zone
- —
- Chance of flooding over 30 yrs
- —
- Est. flood insurance / yr
- —
Fire risk No data
- Est. fire insurance / yr
- —
Heat risk No data
- Hot days now (above threshold)
- —
- Hot days in 30 yrs
- —
Wind risk No data
- Chance of severe wind over 30 yrs
- —
Air-quality risk No data
- Unhealthy air days now
- —
- Unhealthy air days in 30 yrs
- —
Risk factors via First Street. Map © Google.
Why this score? — see what drove the C grade
The composite is a weighted blend of 9 inputs, each scored 0–100. Each bar is that input's sub-score; the figure is the points it added to the 100-point composite (weight × sub-score).
- Cash flow +19.8/30.0
- ARV discount +13.3/15.0
- DSCR +6.3/10.0
- Appreciation +5.5/10.0
- 1% rule +4.6/10.0
- Livability +3.7/5.0
- Rent growth +2.5/5.0
- Condition / age +2.5/5.0
- Schools +1.6/10.0
$379,900
🖨 Deal sheet 📄 Offer letter ✓ Due diligence
Multi-family units
County records classify this as Multi-Family (2-4 Unit). Listing-text estimate: 2 units. confirmed
Listing remarks MLS
**BACK ON MARKET 2ND FLOOR IS FRESHLY PAINTED** LEAD CERTIFIED MULTIFAMILY! Are you an investor looking for the perfect investment property with well maintained units?! Look no further!! This attractive multifamily is located in the heart of downtown and easily accessible to I-91. 1st floor tenant has resided in unit for over 15 years and 2nd floor tenant is in their 5th year. The 3rd floor is finished and has connected utilities to the 2nd floor. Schedule your showing today!
Key facts
- Immediate cash flow
- Well-maintained
- Strong rental appeal
Tags
Property features AI
Finance
- HOA & community: Not a senior community
Exterior
- Parking: Paved off-street parking; 6 open parking spaces
- Utilities: Public water; Public sewer; Electric service 110 volts; Electric range capability
- Home design: 2-family up/down configuration; 2 stories; Yellow exterior color
- Construction: Block construction; Block foundation; Shingle roof; Built (public records)
- Exterior features: Porch; Paved road access
Interior
- Flooring: Wood flooring
- Bathrooms: 3 full bathrooms
- Interior features: Insulated windows; 14 total rooms
Neighborhood map
What this means for you Summary
Snapshot
- This is a 2 × 3-bed/?-bath units multifamily listed at $380k.
Deal economics
- At list price, monthly cash flow is $452 ($5k/yr) — positive. Per door: $226/mo.
- The deal already cash-flows at list — no discount required.
- To meet the 1% rule (rent ≥ 1% of price), the offer needs to be $366k (3.7% below list).
- Recommended offer: $366k (3.7% below list) — sets the bar for 1% rule.
- Cap rate 7.7% vs local median 5.1% in Springfield — top-decile yield for the area; either an underpriced asset or a hidden risk that comps aren't pricing in. Stress-test before assuming the spread holds.
Location & tenants
- Location reads 73/100 on livability (#97 in MA) — a middle-class / working-renter tenant base. Strengths: commute A+, health & safety A+, amenities A; Watch: schools D, crime F, employment D-.
- Springfield (urban): math 13% / reading 25% proficiency, ranked #296 of 302 in MA (top 98%) — low school quality limits family demand, transient renter base, plan for 1-2y turnover; 81% free/reduced lunch — lower-income household profile, screen leases tightly.
- Market conditions: 18 active listings in the ZIP; 3 comparable units currently listed for rent nearby; rentals lingering (median 44d on market — plan ~5-8 weeks vacancy on turnover, expect pricing pressure); 67% of comp listings sitting > 30 days — soft ceiling on asking rent; 453 units permitted in Hampden County in 2024 (116 in 5+ unit buildings).
Forward outlook
- In year one you build about $7k of equity ($3k loan paydown + $4k appreciation (1.1% local appreciation)).
- Hampden County population projected at +5% by 2050 — modest demand growth; plan on rents tracking national, not racing it.
- At projected returns (1.1% appreciation + 3.0% rent growth), your $106k cash investment doubles in ~7 years — after that, you're playing with house money.
- By year 5, paydown + projected appreciation supports a ~$31k cash-out refi (75% LTV) — recoverable capital for the next deal without selling this one.
Negotiation context
- Only 7 days on market — expect competitive offers; lowballing is unlikely to land.
- 9 sale attempts since 32y ago with the ask held roughly flat each time — persistent listings suggest the price (not the market) is what's stuck; bring a comps-based counter.
- Current owner paid $167k; list at $380k implies a 127% gain — meaningful room to come down on a strong offer.
Risks & watch-outs
- Watch-outs: built in 1900 — expect roof / HVAC / electrical / plumbing capex.
Questions for the listing agent
- Can we see the unit-by-unit rent roll, current vacancy, and any below-market leases? What's the average tenancy length?
- What capital expenditures (roof, boiler, parking lot, exteriors) have been made in the last 5 years, and what's planned in the next 2?
- Built in 1900 — when were the roof, HVAC, electrical panel, plumbing, and water heater last replaced?
- Is there a deadline driving the sale (1031 exchange, divorce, estate, relocation)? That informs how much negotiation room exists.
- Schools are D-rated, which usually means shorter tenancies and higher turnover. Who's the typical renter profile here, and what's been the actual vacancy rate?
- Crime grade is F in this area — have there been break-ins, vandalism, or insurance claims at this property in the last 3 years? What carrier currently insures it and at what premium?
- What's the average days-on-market for RENTAL listings here right now (not sales)? A rising rental-DOM trend means longer vacancies and softer asking-rent achievability than the comps imply.
- What's the recent tenant-quality profile in this submarket — average credit score on applications, eviction rate, late-payment / NSF rate, and stable-employment percentage? A property-management company in the area should have these aggregated.
- How much new apartment / multifamily construction is in the pipeline within 1–3 miles? Heavy new supply (>2% of stock underway) typically softens rents 12–24 months out; light construction supports rent growth.
Investment metrics
- 1% rule
- 0.96% ✗
- Cap rate
- 7.72%
- Cash-on-cash
- 5.10%
- DSCR
- 1.23
- GRM
- 8.6
CMA / ARV
- ARV (on-the-fly)
- $435,600
- Comps found
- 12
Show comp detail 12 sales within ~0.75 mi
| Address | Dist | Beds/Ba | Sqft | Sold | Price | $/sf | Match |
|---|---|---|---|---|---|---|---|
| 24 Warriner Ave | 0.10mi | 7/2.0 (+1) | 2,643 (+0%) | 14mo | $400,000 | $151 | 74 |
| 274 Pine St | 0.38mi | 5/3.0 (-1) | 2,628 (-0%) | 4mo | $295,000 | $112 | 73 |
| 63-65 Euclid Ave | 0.58mi | 6/3.0 | 2,560 (-3%) | 1mo | $555,000 | $217 | 67 |
| 78-80 Shamrock St | 0.74mi | 6/2.0 | 2,648 (+0%) | 5mo | $355,000 | $134 | 57 |
| 89 Cedar St | 0.69mi | 6/2.0 | 2,538 (-4%) | 3mo | $278,000 | $110 | 55 |
| 113-117 Cedar St | 0.74mi | 6/3.0 | 2,456 (-7%) | 1mo | $450,000 | $183 | 53 |
| 29-31 Knox St | 0.46mi | 7/2.0 (+1) | 2,884 (+9%) | 4mo | $380,000 | $132 | 51 |
| 211-213 Pine St | 0.49mi | 6/3.0 | 2,400 (-9%) | 14mo | $496,000 | $207 | 51 |
| 509-511 Hancock St | 0.52mi | 6/3.0 | 2,340 (-11%) | 10mo | $497,000 | $212 | 48 |
| 60 Foster St | 0.48mi | 6/2.0 | 2,335 (-12%) | 11mo | $360,000 | $154 | 45 |
| 3-5 Noel St | 0.54mi | 5/3.0 (-1) | 2,246 (-15%) | 5mo | $370,000 | $165 | 41 |
| 48-50 Spruce St | 0.63mi | 6/3.0 | 2,280 (-14%) | 11mo | $475,000 | $208 | 39 |
Match score weights: distance 35% · size 25% · config 20% · recency 20%. Top-matched comps best support the ARV.
Projected returns pro-forma
1.08% appreciation · 3.0% rent growth · sell at horizon
- IRR
- 6.9%
- Equity multiple
- 1.35×
- Total profit
- $37,319
- Equity at exit
- $131,270
- IRR
- 10.9%
- Equity multiple
- 2.34×
- Total profit
- $142,502
- Equity at exit
- $175,673
Cash invested: $106,372 (down + closing). Projections, not guarantees.
Landlord ↔ Tenant lean methodology
- Overall (STATE)
- 20 Strongly Tenant-Friendly
- State Massachusetts
- 20 Strongly Tenant-Friendly · D+15
- County
- — inherits STATE
- City
- — inherits STATE
ZIP-level market 01105
- Home prices YoY
- 0.3%
- Active inventory
- 18
- Price-to-rent
- 17.3×
Monthly cashflow live
- Estimated rent
- $3,660 high interval (Pro) →
- Mortgage (P&I)
- −$1,992
- Tax from tax record
- −$289 /mo · $3,466/yr
- Insurance
- −$158
- HOA
- −$0
- Vacancy / Maint / Mgmt
- −$769
- Net cashflow
- $452
Break-even live
2-unit breakdown (identical units grouped — click to expand)
| Units | Beds | Baths | Est. rent |
|---|---|---|---|
| 2× units | 3 | — | $3,660 |
| #1 | 3 | — | $1,830 |
| #2 | 3 | — | $1,830 |
| Total (2 units) | $3,660 | ||
UW: 25.0% down · 7.5% · 30yr · 1.5% tax · 5.0% vac · 8.0% maint · 8.0% mgmt
Financing live
Cash to close
- Down payment
- $94,975
- Closing costs
- $11,397
- Reserves months
- —
- Total cash needed
- —
Loan-product check · same deal, 3 products live
Conventional
25% down · 7.5% · 30yr
- Down + closing
- —
- Monthly P&I
- —
- Monthly cashflow
- —
- DSCR
- —
- Eligible?
- —
Personal DTI + credit; lowest rate.
DSCR
20% down · 8.5% · 30yr
- Down + closing
- —
- Monthly P&I
- —
- Monthly cashflow
- —
- DSCR
- —
- Eligible?
- —
No personal income docs; deal must DSCR.
Hard money
10% down · 12.0% · 12mo
- Down + closing
- —
- Monthly P&I
- —
- Monthly cashflow
- —
- DSCR
- —
- Eligible?
- —
Short-term bridge; refi at stabilization.
Rent comps 3 comps
| Address | Beds | Baths | Sqft | Rent | $/sqft | DOM | Units | Dist |
|---|---|---|---|---|---|---|---|---|
| 15 Wigwam Pl Springfield, MA | 5.0 | 2.0 | 2000 | $2,800 | $1.40 | 43d | 1 | 0.55mi |
| 296 Hancock St Springfield, MA | 6.0 | 2.0 | 2000 | $2,900 | $1.45 | 43d | 1 | 0.78mi |
| 834 Worthington St Unit 2nd Fl Springfield, MA | 5.0 | 1.0 | 1841 | $2,450 | $1.33 | 21d | 1 | 1.34mi |
Listing history 7 events
-
2026-06-18days on market $379,900 Active 7 DOM
-
2026-06-17days on market $379,900 Active 6 DOM
-
2026-06-16days on market $379,900 Active 5 DOM
-
2026-06-15statusdays on market $379,900 Active 4 DOM
-
2026-06-14days on market $379,900 New 2 DOM
-
2026-06-13remarks 699-char remark
-
2026-06-13$379,900 New 1 DOM
ⓘ Source: listings_history table (triggers on properties + properties_extension) + one-shot
backfill from property_details.listing_events for pre-trigger history.
Tax reassessment forecast MA · Partial reset (capped growth)
- Current annual tax
- $3,466 · $289/mo
- Projected year-2 tax
- $4,069 · $339/mo
- Expected delta
- +$603/yr (+$50/mo · 17.4%)
ⓘ Screening estimate from a state-policy table — verify with the county assessor before closing.
Nearby sold comps map
Loading sold comps map…
Walkable amenities ~0.75 mi
Loading nearby amenities…
Taxation est. · year 1
- Rental income
- $43,920
- − Mortgage interest
- −$21,280
- − Property taxes
- −$3,466
- − Insurance
- −$1,900
- − Repairs & maintenance
- −$3,514
- − Management
- −$3,514
- − Depreciation
- −$11,052
- Taxable loss
- −$805
- Est. tax savings @ 24.0%
- +$193
- After-tax cash flow
- $5,618/yr
For passive investors: Depreciation is non-cash, so a rental often shows a tax loss while cash-flowing — sheltering income. Rental losses are passive: they offset passive income freely, and up to $25,000/yr can offset ordinary (W-2) income if you actively participate and your MAGI is under $100k (phasing out to $0 by $150k); unused losses carry forward. On sale, claimed depreciation is recaptured at up to 25%, and gains may owe capital-gains tax (a 1031 exchange can defer both). Figures are a year-1 estimate at your 24.0% rate — not tax advice; consult a CPA.
Schools (NCES district)
- District
- Springfield
- NCES district ID
- 2511130
- Math proficiency
- 13% ▼ -12.00%
- Reading proficiency
- 25% ▼ -5.00%
- Median HH income
- $34,938
- Composite
- 15.6/100
- National rank
- #9293
- State rank
- #296 of 302 in MA
Livability — Springfield
- Score
- 73/100
- State rank
- #97
- US rank
- #5195
Category grades
Schools grade is shown separately in the Schools card above.
Census & demographics
- Census place
- Springfield, MA
- City population
- 61,006
- Population (ZIP)
- 11,469
Population outlook (Hampden County) Hauer SSP2
- Today (2025)
- 485,646 people
- By 2030
- 491,517 · +1.2%
- By 2040
- 500,539 · +3.1%
- By 2050
- 508,827 · +4.8%
- By 2075
- 539,167 · +11.0%
- By 2100
- 545,698 · +12.4%
Race, ethnicity, and origin ACS 2023
- Neighborhood character
- Predominantly Hispanic (74%)
- Race & ethnicity
- Hispanic / Latino 74% Two or more races 37% Black 14% White 10%
- Hispanic origin (detail)
- Puerto Rican 63% Dominican 5%
- Common ancestry
- Lithuanian 1% Romanian 1%
- Foreign-born
- 8% · Canada
- Languages at home
- 44% English-only · Spanish 53% Other Indo-European 2% French/Haitian/Cajun 1%
Political lean MEDSL · Hampden
- 2024 margin
- Lean D (+8.9) · D 53.4% · R 44.5% · Other 2.1%
- 2008→2024 swing
- -16.4pp toward R · 2008: 25.3pp · 2024: 8.9pp
- All cycles
- 2024: D+8.9 2020: D+17.7 2016: D+16.0 2012: D+25.4 2008: D+25.3
Not yet ingested
- Civics
- —
Market trends
- HPI YoY
- ▲ 1.08%
- Current HPI
- 322.6127
- Rent YoY
- —
- Metro
- —
- State GDP YoY
- ▲ 2.28%
- F500 in state
- 38
Industry mix (Fortune 500 HQ in MA)
| Industry | F500 HQs | Revenue |
|---|---|---|
| Technology | 3 | $17B |
|
||
| Insurance | 2 | $84B |
|
||
| Retail | 2 | $76B |
|
||
| Life Sciences | 1 | $43B |
|
||
| Energy Technology | 1 | $31B |
|
||
| Aerospace / Defense | 1 | $18B |
|
||
Price history
+661.3% since first listed21 events — show timeline
- 2026-06-11 Listed $379,900 MLS PIN
- 2020-03-13 Sold (MLS) $167,000 MLS PIN
- 2019-10-16 Listed $169,900 MLS PIN
- 2012-04-11 Sold (MLS) $70,000 MLS PIN
- 2010-12-13 Listed $85,000 MLS PIN
- 2007-09-28 Sold (Public Records) $188,000 Public Records
- 2007-09-28 Sold (MLS) $188,000 MLS PIN
- 2007-06-25 Listed $179,000 MLS PIN
- 2007-05-30 Sold (MLS) $95,000 MLS PIN
- 2007-04-19 Listed $99,900 MLS PIN
- 2005-02-01 Sold (Public Records) $145,000 Public Records
- 2005-02-01 Sold (MLS) $145,000 MLS PIN
- 2004-11-29 Listed $147,900 MLS PIN
- 2000-11-09 Sold (Public Records) $76,800 Public Records
- 2000-11-09 Sold (MLS) $76,800 MLS PIN
- 2000-07-17 Listed $77,000 MLS PIN
- 1999-09-30 Sold (MLS) $74,000 MLS PIN
- 1999-09-28 Sold (Public Records) $74,000 Public Records
- 1999-08-16 Listed $79,000 MLS PIN
- 1995-02-15 Sold (MLS) $21,500 MLS PIN
- 1994-09-21 Listed $49,900 MLS PIN
Property tax history
+3.2%/yrLatest (2023): $3,466 · +5.6% YoY. Source: county tax records.
Cash-flow waterfall
monthlySold comps — $/sqft
last 12 mo · ≤1 miLoading sold comps…