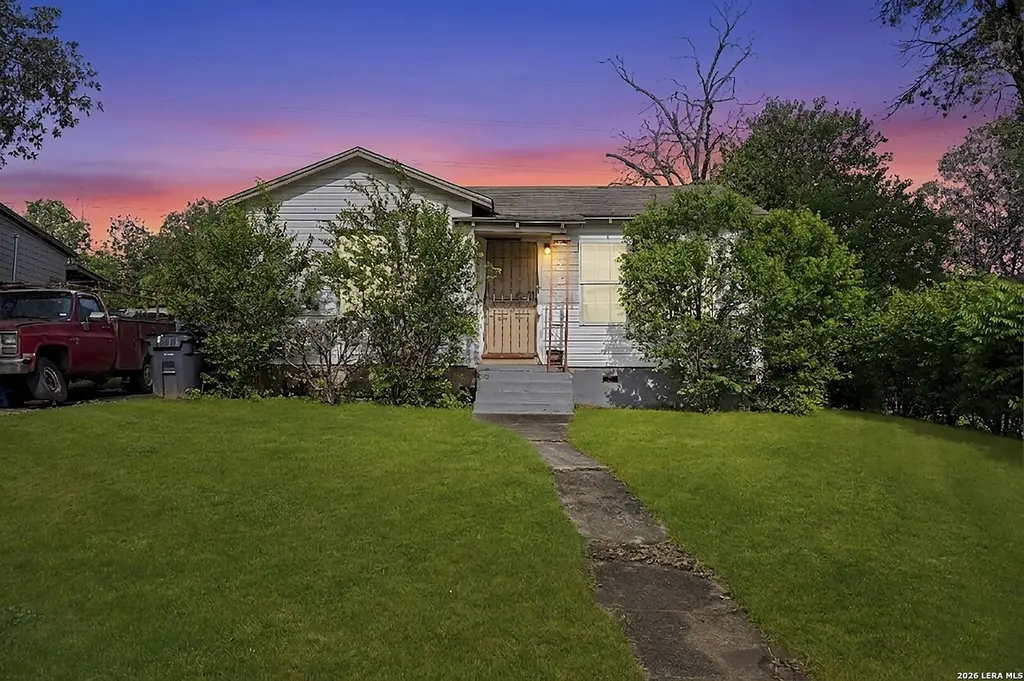
211 Robeson Ave · San Antonio, TX
Flood risk 1/10 · Minimal
- FEMA flood zone
- X (unshaded)
- Chance of flooding over 30 yrs
- 0.0%
- Est. flood insurance / yr
- $507 – $1,088
Fire risk 1/10 · Minimal
- Est. fire insurance / yr
- $1,222 – $2,270
Heat risk 8/10 · Major
- Hot days now (above 108°F)
- 7 days/yr
- Hot days in 30 yrs
- 22 days/yr
Wind risk 8/10 · Major
- Chance of severe wind over 30 yrs
- 80.0%
Air-quality risk 2/10 · Minimal
- Unhealthy air days now
- 0 days/yr
- Unhealthy air days in 30 yrs
- 2 days/yr
Risk factors via First Street. Map © Google.
Why this score? — see what drove the B- grade
The composite is a weighted blend of 9 inputs, each scored 0–100. Each bar is that input's sub-score; the figure is the points it added to the 100-point composite (weight × sub-score).
- Cash flow +19.6/30.0
- ARV discount +15.0/15.0
- Appreciation +10.0/10.0
- 1% rule +7.6/10.0
- DSCR +6.2/10.0
- Livability +4.0/5.0
- Rent growth +2.6/5.0
- Condition / age +2.5/5.0
- Schools +1.4/10.0
$110,000
🖨 Deal sheet (PDF) 📄 Offer letter ✓ Due diligence
Listing remarks MLS
The perfect investment opportunity. This house have 3 bedroom 1 bathroom. It can be fixed and remodeled the way you want it.
Key facts
- Updated electrical
- Fully replaced hvac
- New ductwork
Tags
Property features AI
Finance
- Other: Possession at closing/funding; For sale (not a short sale)
- HOA & community: Located in Lincolnshire/Willow Park subdivision
Exterior
- Utilities: City water and sewer
- Home design: Pre-owned property; Approximately 73 years old
- Construction: Composition roof
- Exterior features: Partial fence; Mature trees; Siding exterior
Interior
- Kitchen: Kitchen 10 x 11
- Bedrooms: Master bedroom 15 x 14 (on lower level; other features—see remarks); Second bedroom 12 x 23; Third bedroom 12 x 11
- Flooring: Wood flooring; Other flooring (see remarks)
- Bathrooms: 1 full bathroom
- Heating & cooling: Electric heat; Other heating (see remarks); Other A/C (see remarks)
- Interior features: Washer and dryer connections; Electric water heater; City garbage service; Single living area; All bedrooms located downstairs; Laundry on main level
- Laundry & utility: Washer connection; Dryer connection; Electric water heater
Neighborhood map
What this means for you Summary
Snapshot
- This is a 3-bed/1.0-bath single-family listed at $110k.
Deal economics
- At list price, monthly cash flow is $128 ($2k/yr) — positive.
- The deal already cash-flows at list — no discount required.
- Meets the 1% rule at list price ($1k rent vs $110k).
- Recommended offer: $108k (1.5% below list) — sets the bar for market timing.
- Cap rate 7.7% vs local median 3.8% in San Antonio — top-decile yield for the area; either an underpriced asset or a hidden risk that comps aren't pricing in. Stress-test before assuming the spread holds.
Location & tenants
- Location reads 80/100 on livability (#31 in TX, #1,616 nationally) — a professional / high-income tenant draw. Strengths: amenities A+, commute A+, cost of living A+; Watch: crime F.
- San Antonio ISD (urban): math 12% / reading 22% proficiency, ranked #805 of 826 in TX (top 98%) — low school quality limits family demand, transient renter base, plan for 1-2y turnover; 80% free/reduced lunch — lower-income household profile, screen leases tightly.
- Zoned schools: Dorie Miller El (math 27% / reading 27%, grade F, #2,791 of 4,322 statewide, top 68%, 326 students, 97% FRL); Davis Middle (math 5% / reading 15%, grade F, #1,641 of 1,662 statewide, top 99%, 545 students, 96% FRL, charter); Houston H S (math 12% / reading 18%, grade F, #1,507 of 1,632 statewide, top 93%, 856 students, 95% FRL) — zoned schools average 96% FRL vs 80% district-wide (16 pts higher); higher-poverty schools than district average — tighter screening recommended.
- Market conditions: Rents flat; 116 active listings in the ZIP; 40 comparable units currently listed for rent nearby; rentals at typical pace (median 26d on market — plan ~3-4 weeks tenant-placement turnaround); lower-income renter base — watch delinquency; 8,308 units permitted in Bexar County in 2024 (2,506 in 5+ unit buildings).
Forward outlook
- In year one you build about $12k of equity ($761 loan paydown + $11k appreciation (10.0% local appreciation)).
- Bexar County population projected at +50% by 2050 — long-run rental-demand tailwind backs the buy-and-hold thesis.
- At projected returns (10.0% appreciation + 0.5% rent growth), your $31k cash investment doubles in ~3 years — after that, you're playing with house money.
- By year 4, paydown + projected appreciation supports a ~$42k cash-out refi (75% LTV) — recoverable capital for the next deal without selling this one.
Negotiation context
- It's been on market 30 days — a 2% lower offer ($108k) is reasonable based on typical stale-listing flexibility.
- 2 sale attempts since 4y ago; this cycle's ask has dropped $15k (12%) from the opening price — seller is motivated, your offer sets the floor, not the list.
Risks & watch-outs
- Watch-outs: property tax is 3.8% of price; built in 1953 — expect roof / HVAC / electrical / plumbing capex.
- Climate carrying-cost: severe wind risk, 80% chance of damaging wind over 30y; extreme-heat days projected 7→22/yr by 2055 (HVAC capex compounding) — expect insurance premiums to compound above CPI over the hold.
Questions for the listing agent
- Built in 1953 — when were the roof, HVAC, electrical panel, plumbing, and water heater last replaced?
- Property tax is high relative to price — has the assessment been appealed recently, and will the sale trigger a re-assessment?
- Is there a deadline driving the sale (1031 exchange, divorce, estate, relocation)? That informs how much negotiation room exists.
- Crime grade is F in this area — have there been break-ins, vandalism, or insurance claims at this property in the last 3 years? What carrier currently insures it and at what premium?
- What's the average days-on-market for RENTAL listings here right now (not sales)? A rising rental-DOM trend means longer vacancies and softer asking-rent achievability than the comps imply.
- What's the recent tenant-quality profile in this submarket — average credit score on applications, eviction rate, late-payment / NSF rate, and stable-employment percentage? A property-management company in the area should have these aggregated.
- How much new for-sale + rental construction is in the pipeline within 1–3 miles? Heavy new supply typically softens prices + rents 12–24 months out; constrained supply supports both.
Investment metrics
- 1% rule
- 1.26% ✓
- Cap rate
- 7.68%
- Cash-on-cash
- 4.97%
- DSCR
- 1.22
- GRM
- 6.6
CMA / ARV
- ARV (on-the-fly)
- $180,000
- Comps found
- 12
Show comp detail 12 sales within ~0.75 mi
| Address | Dist | Beds/Ba | Sqft | Sold | Price | $/sf | Match |
|---|---|---|---|---|---|---|---|
| 227 Jemison St | 0.23mi | 3/2.0 | 1,216 (+1%) | 7mo | $190,000 | $156 | 78 |
| 2846 Wyoming St | 0.42mi | 3/2.0 | 1,255 (+5%) | 1mo | $185,000 | $147 | 68 |
| 1210 S Walters | 0.66mi | 3/1.0 | 1,203 (+0%) | 2mo | $75,000 | $62 | 67 |
| 370 Sterling | 0.51mi | 3/1.0 | 1,155 (-4%) | 5mo | $105,000 | $91 | 66 |
| 515 South Grimes | 0.51mi | 3/2.0 | 1,155 (-4%) | 3mo | $239,000 | $207 | 64 |
| 3006 Martin Luther King | 0.36mi | 3/2.0 | 1,275 (+6%) | 7mo | $199,999 | $157 | 63 |
| 230 Corliss | 0.46mi | 3/1.5 | 1,296 (+8%) | 5mo | $189,900 | $147 | 59 |
| 237 Corliss | 0.49mi | 3/2.0 | 1,296 (+8%) | 4mo | $195,000 | $150 | 57 |
| 2006 Virginia | 0.65mi | 3/1.0 | 1,098 (-8%) | 3mo | $169,000 | $154 | 53 |
| 511 Cooper | 0.74mi | 3/2.0 | 1,176 (-2%) | 7mo | $145,000 | $123 | 52 |
| 771 Yucca | 0.53mi | 4/1.0 (+1) | 1,094 (-9%) | 7mo | $142,500 | $130 | 50 |
| 623 Belmont | 0.71mi | 3/2.0 | 1,355 (+13%) | 0mo | $230,000 | $170 | 41 |
Match score weights: distance 35% · size 25% · config 20% · recency 20%. Top-matched comps best support the ARV.
Projected returns pro-forma
10.0% appreciation · 0.53% rent growth · sell at horizon
- IRR
- 26.8%
- Equity multiple
- 3.10×
- Total profit
- $64,809
- Equity at exit
- $99,097
- IRR
- 22.6%
- Equity multiple
- 6.80×
- Total profit
- $178,590
- Equity at exit
- $213,706
Cash invested: $30,800 (down + closing). Projections, not guarantees.
Landlord ↔ Tenant lean methodology
- Overall (STATE)
- 87 Strongly Landlord-Friendly
- State Texas
- 87 Strongly Landlord-Friendly · R+5
- County
- — inherits STATE
- City
- — inherits STATE
ZIP-level market 78220
- Home prices YoY
- 9.1%
- Rents YoY
- 0.5%
- Active inventory
- 116
- Price-to-rent
- 6.6×
Monthly cashflow live
- Estimated rent
- $1,390 high interval (Pro) →
- Mortgage (P&I)
- −$577
- Tax from tax record
- −$348 /mo · $4,174/yr
- Insurance
- −$46
- HOA
- −$0
- Vacancy / Maint / Mgmt
- −$292
- Net cashflow
- $128
Break-even live
Sensitivity live
| Price | -10% $190 | -5% $159 | +0% $128 | +5% $96 | +10% $65 |
|---|---|---|---|---|---|
| Rent | -10% $18 | -5% $73 | +0% $128 | +5% $182 | +10% $237 |
| Rate | -1.0pp $183 | -0.5pp $155 | base $128 | +0.5pp $99 | +1.0pp $70 |
UW: 25.0% down · 7.5% · 30yr · 1.5% tax · 5.0% vac · 8.0% maint · 8.0% mgmt
Financing live
Cash to close
- Down payment
- $27,500
- Closing costs
- $3,300
- Reserves months
- —
- Total cash needed
- —
Loan-product check · same deal, 3 products live
Conventional
25% down · 7.5% · 30yr
- Down + closing
- —
- Monthly P&I
- —
- Monthly cashflow
- —
- DSCR
- —
- Eligible?
- —
Personal DTI + credit; lowest rate.
DSCR
20% down · 8.5% · 30yr
- Down + closing
- —
- Monthly P&I
- —
- Monthly cashflow
- —
- DSCR
- —
- Eligible?
- —
No personal income docs; deal must DSCR.
Hard money
10% down · 12.0% · 12mo
- Down + closing
- —
- Monthly P&I
- —
- Monthly cashflow
- —
- DSCR
- —
- Eligible?
- —
Short-term bridge; refi at stabilization.
Rent comps 40 comps
| Address | Beds | Baths | Sqft | Rent | $/sqft | DOM | Units | Dist |
|---|---|---|---|---|---|---|---|---|
| 143 Ranger Unit 101 San Antonio, TX | 3.0 | 2.0 | 876 | $1,099 | $1.25 | 3d | 1 | 0.21mi |
| 154 Ferris Ave San Antonio, TX | 3.0 | 2.0 | 1438 | $1,275 | $0.89 | 23d | 1 | 0.29mi |
| 154 Ferris Ave San Antonio, TX | 3.0 | 2.0 | 1438 | $1,499 | $1.04 | 45d | 1 | 0.29mi |
| 311 Spriggsdale Ave Unit 710 San Antonio, TX | 2.0 | 2.0 | 890 | $973 | $1.09 | 0d | 1 | 0.37mi |
| 3030 Martin Luther King Dr San Antonio, TX | 3.0 | 1.0 | 938 | $1,295 | $1.38 | 25d | 1 | 0.40mi |
| 239 Ferris Ave San Antonio, TX | 3.0 | 2.0 | 909 | $1,249 | $1.37 | 45d | 1 | 0.44mi |
| 215 Edna Ave San Antonio, TX | 2.0 | 1.0 | 968 | $1,260 | $1.30 | 45d | 1 | 0.44mi |
| 420 Clark Ave San Antonio, TX | 2.0 | 1.0 | 756 | $1,295 | $1.71 | 19d | 1 | 0.46mi |
| 311 Ferris Ave San Antonio, TX | 3.0 | 2.0 | 909 | $1,245 | $1.37 | 6d | 1 | 0.57mi |
| 918 Hampton St Unit 1 San Antonio, TX | 3.0 | 1.0 | 912 | $975 | $1.07 | 45d | 1 | 0.57mi |
| 406 Como St San Antonio, TX | 3.0 | 1.5 | 1278 | $1,350 | $1.06 | 45d | 1 | 0.58mi |
| 323 Ferris Ave San Antonio, TX | 3.0 | 2.0 | 1298 | $1,414 | $1.09 | 0d | 1 | 0.59mi |
| 125 Magendie St San Antonio, TX | 2.0 | 2.0 | 820 | $1,323 | $1.61 | 6d | 1 | 0.60mi |
| 610 Pecan Valley Dr San Antonio, TX | 3.0 | 1.0 | 1287 | $1,650 | $1.28 | 45d | 1 | 0.61mi |
| 227 S Grimes St Unit 202 San Antonio, TX | 3.0 | 2.5 | 1089 | $1,550 | $1.42 | 45d | 1 | 0.61mi |
| 314 Maryland St Unit 102 San Antonio, TX | 2.0 | 2.5 | 1055 | $1,295 | $1.23 | 45d | 1 | 0.66mi |
| 318 Ferguson Ave Unit 1 San Antonio, TX | 3.0 | 2.0 | 1450 | $1,550 | $1.07 | 6d | 1 | 0.68mi |
| 342 Vine St San Antonio, TX | 2.0 | 1.0 | 768 | $995 | $1.30 | 25d | 1 | 0.69mi |
| 342 Vine St Unit B San Antonio, TX | 2.0 | 1.0 | 768 | $875 | $1.14 | 45d | 1 | 0.69mi |
| 1431 Aransas Ave San Antonio, TX | 3.0 | 1.0 | 1108 | $1,195 | $1.08 | 16d | 1 | 0.69mi |
| 139 San Salvador Ave Unit 103 San Antonio, TX | 2.0 | 2.5 | 1245 | $1,490 | $1.20 | 16d | 1 | 0.70mi |
| 455 Lincolnshire Dr San Antonio, TX | 2.0 | 1.0 | 768 | $925 | $1.20 | 22d | 1 | 0.70mi |
| 610 Belmont San Antonio, TX | 2.0 | 1.0 | 1050 | $1,195 | $1.14 | 45d | 1 | 0.72mi |
| 322 Vine St #102 San Antonio, TX | 3.0 | 2.5 | 1401 | $1,400 | $1.00 | 25d | 1 | 0.73mi |
| 723 Sewanee St San Antonio, TX | 3.0 | 2.0 | 1028 | $1,264 | $1.23 | 14d | 1 | 0.74mi |
| 512 Cooper St San Antonio, TX | 2.0 | 1.0 | 1116 | $1,295 | $1.16 | 25d | 1 | 0.77mi |
| 313 San Salvador Ave San Antonio, TX | 4.0 | 2.5 | 1240 | $1,395 | $1.12 | 45d | 1 | 0.77mi |
| 302 Dorie St San Antonio, TX | 3.0 | 2.0 | 1028 | $1,285 | $1.25 | 23d | 1 | 0.80mi |
| 242 Vine St San Antonio, TX | 4.0 | 2.0 | 1250 | $1,695 | $1.36 | 45d | 1 | 0.81mi |
| 1518 S Walters St Unit 102 San Antonio, TX | 3.0 | 2.5 | 1180 | $1,400 | $1.19 | 6d | 1 | 0.82mi |
| 1303 Essex St #102 San Antonio, TX | 3.0 | 2.5 | 1180 | $1,400 | $1.19 | 25d | 1 | 0.82mi |
| 3259 Martin Luther King Dr San Antonio, TX | 3.0 | 2.0 | 909 | $1,135 | $1.25 | 0d | 1 | 0.86mi |
| 458 Ferris Ave San Antonio, TX | 3.0 | 2.0 | 909 | $1,350 | $1.49 | 0d | 1 | 0.87mi |
| 1435 Gibbs San Antonio, TX | 3.0 | 1.0 | 975 | $1,435 | $1.47 | 25d | 1 | 0.87mi |
| 1303 Rigsby Ave Unit 710 San Antonio, TX | 2.0 | 2.0 | 950 | $1,165 | $1.23 | 0d | 1 | 0.92mi |
| 2818 E Houston St San Antonio, TX | 3.0 | 1.0 | 1184 | $1,495 | $1.26 | 16d | 1 | 0.93mi |
| 2018 E Drexel Ave San Antonio, TX | 3.0 | 2.0 | 1268 | $1,750 | $1.38 | 25d | 1 | 0.93mi |
| 147 Vine St San Antonio, TX | 3.0 | 3.0 | 1438 | $1,700 | $1.18 | 25d | 1 | 0.94mi |
| 3318 Martin Luther King Dr San Antonio, TX | 3.0 | 2.0 | 909 | $975 | $1.07 | 45d | 1 | 0.96mi |
| 574 Morningview Dr San Antonio, TX | 3.0 | 2.0 | 1298 | $1,499 | $1.15 | 0d | 1 | 0.97mi |
Listing history 22 events
-
2026-06-21days on market $110,000 Active 30 DOM
-
2026-06-18days on market $110,000 Active 27 DOM
-
2026-06-18status $110,000 Active 26 DOM
-
2026-06-17days on market $110,000 Price Change 26 DOM
-
2026-06-16days on market $110,000 Price Change 25 DOM
-
2026-06-15days on market $110,000 Price Change 24 DOM
-
2026-06-13days on market $110,000 Price Change 22 DOM
-
2026-06-09days on market $110,000 Price Change 18 DOM
-
2026-06-08days on market $110,000 Price Change 17 DOM
-
2026-06-08pricestatus $110,000 Price Change 16 DOM
-
2026-06-07days on market $125,000 Active 16 DOM
-
2026-06-04days on market $125,000 Active 13 DOM
-
2026-06-03days on market $125,000 Active 12 DOM
-
2026-06-02statusdays on market $125,000 Active 11 DOM
-
2026-06-01days on market $125,000 New 10 DOM
-
2026-05-31days on market $125,000 New 9 DOM
-
2026-05-22$125,000 New
-
2022-11-28historical 125-char remark
Show marketing remark (125 chars)
The perfect investment opportunity. This house have 3 bedroom 1 bathroom. It can be fixed and remodeled the way you want it.
-
2022-11-28soldstatus
Show marketing remark (125 chars)
The perfect investment opportunity. This house have 3 bedroom 1 bathroom. It can be fixed and remodeled the way you want it.
-
2022-11-23soldstatus Sold 125-char remark
Show marketing remark (125 chars)
The perfect investment opportunity. This house have 3 bedroom 1 bathroom. It can be fixed and remodeled the way you want it.
-
2022-11-13status Pending SB 125-char remark
Show marketing remark (125 chars)
The perfect investment opportunity. This house have 3 bedroom 1 bathroom. It can be fixed and remodeled the way you want it.
-
2022-11-01$75,000 New 125-char remark
Show marketing remark (125 chars)
The perfect investment opportunity. This house have 3 bedroom 1 bathroom. It can be fixed and remodeled the way you want it.
ⓘ Source: listings_history table (triggers on properties + properties_extension) + one-shot
backfill from property_details.listing_events for pre-trigger history.
Tax reassessment forecast TX · Resets to sale price
- Current annual tax
- $4,174 · $348/mo
- Projected year-2 tax
- $4,174 · $348/mo
- Expected delta
- $0/yr ($0/mo · 0.0%)
ⓘ Screening estimate from a state-policy table — verify with the county assessor before closing.
Climate risk First Street
- Flood 1/10 Low FEMA zone X (unshaded) · 0% chance over 30 yrs
- Wildfire 1/10 Low
- Heat 8/10 Severe 7 d/yr ≥108°F today · 22 d/yr by 30 yrs out
- Wind 8/10 Severe 80% chance of damaging wind over 30 yrs
- Air quality 2/10 Low 0 unhealthy d/yr today · 2 by 30 yrs out
Nearby sold comps map
Loading sold comps map…
Walkable amenities ~0.75 mi
Loading nearby amenities…
Taxation est. · year 1
- Rental income
- $16,678
- − Mortgage interest
- −$6,162
- − Property taxes
- −$4,174
- − Insurance
- −$550
- − Repairs & maintenance
- −$1,334
- − Management
- −$1,334
- − Depreciation
- −$3,200
- Taxable loss
- −$76
- Est. tax savings @ 24.0%
- +$18
- After-tax cash flow
- $1,548/yr
For passive investors: Depreciation is non-cash, so a rental often shows a tax loss while cash-flowing — sheltering income. Rental losses are passive: they offset passive income freely, and up to $25,000/yr can offset ordinary (W-2) income if you actively participate and your MAGI is under $100k (phasing out to $0 by $150k); unused losses carry forward. On sale, claimed depreciation is recaptured at up to 25%, and gains may owe capital-gains tax (a 1031 exchange can defer both). Figures are a year-1 estimate at your 24.0% rate — not tax advice; consult a CPA.
Schools (NCES district)
- District
- San Antonio ISD
- NCES district ID
- 4838730
- Math proficiency
- 12% ▼ -21.00%
- Reading proficiency
- 22% ▼ -7.00%
- Median HH income
- $30,952
- Composite
- 13.57/100
- National rank
- #9512
- State rank
- #805 of 826 in TX
Livability — San Antonio
- Score
- 80/100
- State rank
- #31
- US rank
- #1616
Category grades
Schools grade is shown separately in the Schools card above.
Census & demographics
- Census place
- San Antonio, TX
- County
- Bexar County · 1,990,555 people
- City population
- 1,806,925
- Metro
- San Antonio-New Braunfels, TX
- Population (ZIP)
- 19,423
- Household income
- $41,710
- Rent vs Own
- Severe rent burden
- 705.0
Population outlook (Bexar County) Hauer SSP2
- Today (2025)
- 2,336,851 people
- By 2030
- 2,560,728 · +9.6%
- By 2040
- 3,020,569 · +29.3%
- By 2050
- 3,493,522 · +49.5%
- By 2075
- 4,668,459 · +99.8%
- By 2100
- 5,533,242 · +136.8%
Race, ethnicity, and origin ACS 2023
- Neighborhood character
- Majority Hispanic (60%)
- Race & ethnicity
- Hispanic / Latino 60% Black 30% Two or more races 22% White 8%
- Hispanic origin (detail)
- Mexican 47% Puerto Rican 1%
- Foreign-born
- 11% · Canada
- Languages at home
- 63% English-only · Spanish 36%
Political lean MEDSL · Bexar
- 2024 margin
- Lean D (+9.8) · D 54.3% · R 44.6% · Other 1.1%
- 2008→2024 swing
- +4.2pp toward D · 2008: 5.6pp · 2024: 9.8pp
- All cycles
- 2024: D+9.8 2020: D+18.2 2016: D+13.5 2012: D+4.6 2008: D+5.6
Not yet ingested
- Civics
- —
Market trends
- HPI YoY
- ▲ 23.86%
- Current HPI
- 284.9844
- Rent YoY
- ▲ 0.53%
- Metro
- San Antonio-New Braunfels, TX
- State GDP YoY
- ▲ 3.95%
- F500 in state
- 110
Industry mix (Fortune 500 HQ in TX)
| Industry | F500 HQs | Revenue |
|---|---|---|
| Energy | 16 | $1,198B |
|
||
| Technology | 5 | $198B |
|
||
| Engineering / Construction | 4 | $72B |
|
||
| Energy Services | 3 | $60B |
|
||
| Utilities | 3 | $41B |
|
||
| Healthcare | 2 | $330B |
|
||
Price history
+66.7% since first listed6 events — show timeline
- 2026-05-22 Listed $125,000 LERA
- 2022-11-28 Listing Removed — LERA
- 2022-11-28 Sold (Public Records) — Public Records
- 2022-11-23 Sold (MLS) — LERA
- 2022-11-13 Pending — LERA
- 2022-11-01 Listed $75,000 LERA
Property tax history
+9.8%/yrLatest (2025): $4,174 · -0.9% YoY. Source: county tax records.
Cash-flow waterfall
monthlySold comps — $/sqft
last 12 mo · ≤1 miLoading sold comps…