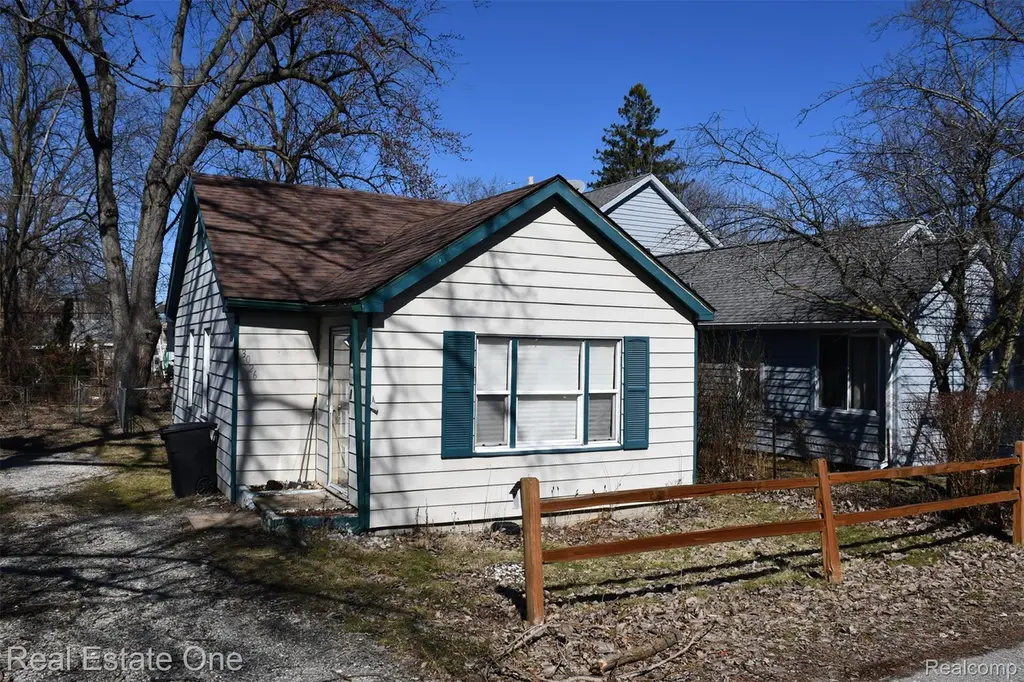
3026 Norcott Dr · Keego Harbor, MI
Flood risk 6/10 · Moderate
- FEMA flood zone
- X (unshaded)
- Chance of flooding over 30 yrs
- 0.74%
- Est. flood insurance / yr
- $473 – $860
Fire risk 1/10 · Minimal
- Est. fire insurance / yr
- $784 – $1,456
Heat risk 2/10 · Minimal
- Hot days now (above 96°F)
- 7 days/yr
- Hot days in 30 yrs
- 15 days/yr
Wind risk 2/10 · Minimal
- Chance of severe wind over 30 yrs
- —
Air-quality risk 3/10 · Minor
- Unhealthy air days now
- 2 days/yr
- Unhealthy air days in 30 yrs
- 4 days/yr
Risk factors via First Street. Map © Google.
Why this score? — see what drove the D grade
The composite is a weighted blend of 9 inputs, each scored 0–100. Each bar is that input's sub-score; the figure is the points it added to the 100-point composite (weight × sub-score).
- Cash flow +14.4/30.0
- ARV discount +6.3/15.0
- Schools +4.5/10.0
- DSCR +4.4/10.0
- Livability +3.9/5.0
- 1% rule +3.8/10.0
- Rent growth +2.5/5.0
- Condition / age +2.5/5.0
- Appreciation +0.0/10.0
$169,900
🖨 Deal sheet (PDF) 📄 Offer letter ✓ Due diligence
Listing remarks MLS
Charming 2-bedroom, 1-bath cottage with lake privileges (Cass Lake and Sylvan)—perfect for first-time homebuyers or investors. This property has consistently been used as a rental and has never been owner-occupied. Features a cozy interior with a functional layout, newer windows, and some updated flooring. Offers low-maintenance living with convenient access to the lake for boating, swimming, and outdoor enjoyment. Great option as a starter home, weekend retreat, or income-producing property. Buyer to verify all information and lake privilege details Property is being sold as is.
Key facts
- Lake privileges
- Newer windows
- Updated flooring
Tags
Neighborhood map
What this means for you Summary
Snapshot
- This is a 2-bed/1.0-bath single-family listed at $170k.
Deal economics
- At list price, monthly cash flow is $35 ($422/yr) — positive.
- The deal already cash-flows at list — no discount required.
- To meet the 1% rule (rent ≥ 1% of price), the offer needs to be $149k (12.3% below list).
- Recommended offer: $149k (12.3% below list) — sets the bar for 1% rule.
- Cap rate 6.5% vs local median 3.8% in Keego Harbor — top-decile yield for the area; either an underpriced asset or a hidden risk that comps aren't pricing in. Stress-test before assuming the spread holds.
Location & tenants
- Location reads 78/100 on livability (#110 in MI, #2,643 nationally) — a middle-class / working-renter tenant base. Strengths: crime A+, cost of living A+, housing A+; Watch: amenities D-, commute F.
- West Bloomfield School District (suburban): math 42% / reading 55% proficiency, ranked #83 of 540 in MI (top 15%) — families likely to look elsewhere, expect single-tenant / working-renter base with shorter leases.
- Zoned schools: Roosevelt Elementary School (math 48% / reading 61%, grade C, #276 of 1,397 statewide, top 22%, 356 students, 49% FRL); West Bloomfield Middle School (math 46% / reading 55%, grade C, #110 of 493 statewide, top 23%, 941 students, 42% FRL); West Bloomfield High School (math 40% / reading 61%, grade D+, #146 of 713 statewide, top 21%, 1,652 students, 34% FRL) — zoned schools average 42% FRL vs 23% district-wide (19 pts higher); higher-poverty schools than district average — tighter screening recommended.
- Market conditions: 26 active listings in the ZIP; 7 comparable units currently listed for rent nearby; rentals at typical pace (median 26d on market — plan ~3-4 weeks tenant-placement turnaround); 43% of comp listings sitting > 30 days — soft ceiling on asking rent; 2,614 units permitted in Oakland County in 2024 (721 in 5+ unit buildings).
Forward outlook
- Local home prices are declining (-3.0%/yr); year-one equity from $1k of loan paydown is wiped out by about $5k of value loss. Plan a longer hold.
- Oakland County population projected at +10% by 2050 — modest demand growth; plan on rents tracking national, not racing it.
Negotiation context
- It's been on market 93 days — a 9% lower offer ($155k) is reasonable based on typical stale-listing flexibility.
- 2 sale attempts; this cycle's ask has dropped $10k (6%) from the opening price — seller is motivated, your offer sets the floor, not the list.
Risks & watch-outs
- Watch-outs: built in 1950 — expect roof / HVAC / electrical / plumbing capex.
- Climate carrying-cost: major flood risk — expect insurance premiums to compound above CPI over the hold.
Questions for the listing agent
- It's been on market 93 days. Have you received any prior offers? Is the seller open to a 12% concession, seller financing, or rate buy-down credit?
- Built in 1950 — when were the roof, HVAC, electrical panel, plumbing, and water heater last replaced?
- Why hasn't it sold? Are there any deal-killer items the seller is aware of (foundation, flood, title, zoning, code violations)?
- Is there a deadline driving the sale (1031 exchange, divorce, estate, relocation)? That informs how much negotiation room exists.
- The area grade is low — what's the realistic commute time and amenity access for the typical tenant pool here? Any planned neighborhood developments (good or bad) we should know about?
- What's the average days-on-market for RENTAL listings here right now (not sales)? A rising rental-DOM trend means longer vacancies and softer asking-rent achievability than the comps imply.
- What's the recent tenant-quality profile in this submarket — average credit score on applications, eviction rate, late-payment / NSF rate, and stable-employment percentage? A property-management company in the area should have these aggregated.
- How much new for-sale + rental construction is in the pipeline within 1–3 miles? Heavy new supply typically softens prices + rents 12–24 months out; constrained supply supports both.
Investment metrics
- 1% rule
- 0.88% ✗
- Cap rate
- 6.54%
- Cash-on-cash
- 0.89%
- DSCR
- 1.04
- GRM
- 9.5
CMA / ARV
- ARV (median comp)
- $165,353
- List price
- $169,900
- Delta
- 2.75%
- Verdict
- FAIR
- Comps
- 20 within 1.0 mi
Show comp detail 9 sales within ~0.75 mi
| Address | Dist | Beds/Ba | Sqft | Sold | Price | $/sf | Match |
|---|---|---|---|---|---|---|---|
| 3033 Moss St | 0.07mi | 2/1.0 | 850 (-3%) | 9mo | $150,000 | $176 | 84 |
| 2960 Glenbroke St | 0.12mi | 2/1.0 | 816 (-7%) | 7mo | $80,000 | $98 | 77 |
| 1955 Maddy Ln | 0.34mi | 2/1.0 | 924 (+5%) | 4mo | $176,500 | $191 | 72 |
| 1887 Maddy Ln | 0.30mi | 2/1.0 | 870 (-1%) | 16mo | $190,000 | $218 | 71 |
| 1865 Cass Lake Front Rd | 0.08mi | 2/2.0 | 828 (-6%) | 16mo | $235,000 | $284 | 70 |
| 2305 Hester Ct | 0.61mi | 2/1.0 | 860 (-2%) | 12mo | $170,000 | $198 | 59 |
| 3087 Brock St | 0.38mi | 1/1.0 (-1) | 800 (-9%) | 7mo | $170,700 | $213 | 57 |
| 3216 Varjo Ct | 0.75mi | 2/1.0 | 800 (-9%) | 23mo | $168,400 | $211 | 31 |
| 2435 Kleist Ct | 0.70mi | 2/1.0 | 983 (+12%) | 21mo | $172,000 | $175 | 30 |
Match score weights: distance 35% · size 25% · config 20% · recency 20%. Top-matched comps best support the ARV.
Projected returns pro-forma
-3.0% appreciation · 3.0% rent growth · sell at horizon
- IRR
- -14.9%
- Equity multiple
- 0.47×
- Total profit
- $-25,289
- Equity at exit
- $25,333
- IRR
- -6.2%
- Equity multiple
- 0.60×
- Total profit
- $-19,124
- Equity at exit
- $14,690
Cash invested: $47,572 (down + closing). Projections, not guarantees.
Landlord ↔ Tenant lean methodology
- Overall (STATE)
- 62 Landlord-Friendly
- State Michigan
- 62 Landlord-Friendly · EVEN
- County
- — inherits STATE
- City
- — inherits STATE
ZIP-level market 48320
- Active inventory
- 26
- Price-to-rent
- 9.5×
Monthly cashflow live
- Estimated rent
- $1,491 high interval (Pro) →
- Mortgage (P&I)
- −$891
- Tax from tax record
- −$181 /mo · $2,170/yr
- Insurance
- −$71
- HOA
- −$0
- Vacancy / Maint / Mgmt
- −$313
- Net cashflow
- $35
Break-even live
Sensitivity live
| Price | -10% $131 | -5% $83 | +0% $35 | +5% $-13 | +10% $-61 |
|---|---|---|---|---|---|
| Rent | -10% $-83 | -5% $-24 | +0% $35 | +5% $94 | +10% $153 |
| Rate | -1.0pp $121 | -0.5pp $78 | base $35 | +0.5pp $-9 | +1.0pp $-54 |
UW: 25.0% down · 7.5% · 30yr · 1.5% tax · 5.0% vac · 8.0% maint · 8.0% mgmt
Financing live
Cash to close
- Down payment
- $42,475
- Closing costs
- $5,097
- Reserves months
- —
- Total cash needed
- —
Loan-product check · same deal, 3 products live
Conventional
25% down · 7.5% · 30yr
- Down + closing
- —
- Monthly P&I
- —
- Monthly cashflow
- —
- DSCR
- —
- Eligible?
- —
Personal DTI + credit; lowest rate.
DSCR
20% down · 8.5% · 30yr
- Down + closing
- —
- Monthly P&I
- —
- Monthly cashflow
- —
- DSCR
- —
- Eligible?
- —
No personal income docs; deal must DSCR.
Hard money
10% down · 12.0% · 12mo
- Down + closing
- —
- Monthly P&I
- —
- Monthly cashflow
- —
- DSCR
- —
- Eligible?
- —
Short-term bridge; refi at stabilization.
Rent comps 7 comps
| Address | Beds | Baths | Sqft | Rent | $/sqft | DOM | Units | Dist |
|---|---|---|---|---|---|---|---|---|
| 1671 Cass Lake Rd Keego Harbor, MI | 1.0 | 1.0 | 743 | $1,200 | $1.62 | 45d | 1 | 0.19mi |
| 3048 Andre St Keego Harbor, MI | 3.0 | 1.0 | 920 | $1,995 | $2.17 | 13d | 1 | 0.42mi |
| 2510 Woodrow Wilson Blvd West Bloomfield Township, MI | 1.0 | 1.0 | 825 | $1,046 | $1.27 | 1d | 5 | 0.75mi |
| 3530 Denise Ct Waterford Twp, MI | 1.0–2.0 | 1.0–1.5 | 890 | $1,975 | $2.22 | 0d | 15 | 0.96mi |
| 3530 Denise Ct Waterford Twp, MI | 1.0–2.0 | 1.0–1.5 | 1004 | $1,910 | $1.90 | 25d | 15 | 0.96mi |
| 311 S Telegraph Rd Pontiac, MI | 1.0–2.0 | 1.0 | 732 | $1,200 | $1.64 | 45d | 1 | 1.42mi |
| 1240 Wagner Ave Bloomfield Hills, MI | 2.0 | 1.0 | 704 | $1,550 | $2.20 | 45d | 1 | 1.42mi |
Listing history 17 events
-
2026-06-21days on market $169,900 Active 93 DOM
-
2026-06-19price $169,900 Active 90 DOM
-
2026-06-18days on market $179,900 Active 90 DOM
-
2026-06-17days on market $179,900 Active 89 DOM
-
2026-06-16days on market $179,900 Active 88 DOM
-
2026-06-15days on market $179,900 Active 87 DOM
-
2026-06-13days on market $179,900 Active 85 DOM
-
2026-06-09days on market $179,900 Active 81 DOM
-
2026-06-08days on market $179,900 Active 80 DOM
-
2026-06-07days on market $179,900 Active 79 DOM
-
2026-06-04days on market $179,900 Active 76 DOM
-
2026-06-03days on market $179,900 Active 75 DOM
-
2026-06-02days on market $179,900 Active 74 DOM
-
2026-06-01days on market $179,900 Active 73 DOM
-
2026-05-31days on market $179,900 Active 72 DOM
-
2026-03-20$179,900 Active 593-char remark
Show marketing remark (588 chars)
Charming 2-bedroom, 1-bath cottage with lake privileges (Cass Lake and Sylvan) - perfect for first-time homebuyers or investors. This property has consistently been used as a rental and has never been owner-occupied. Features a cozy interior with a functional layout, newer windows, and some updated flooring. Offers low-maintenance living with convenient access to the lake for boating, swimming, and outdoor enjoyment. Great option as a starter home, weekend retreat, or income-producing property. Buyer to verify all information and lake privilege details Property is being sold as is.
-
2026-03-20$179,900 Active 588-char remark
Show marketing remark (588 chars)
Charming 2-bedroom, 1-bath cottage with lake privileges (Cass Lake and Sylvan) - perfect for first-time homebuyers or investors. This property has consistently been used as a rental and has never been owner-occupied. Features a cozy interior with a functional layout, newer windows, and some updated flooring. Offers low-maintenance living with convenient access to the lake for boating, swimming, and outdoor enjoyment. Great option as a starter home, weekend retreat, or income-producing property. Buyer to verify all information and lake privilege details Property is being sold as is.
ⓘ Source: listings_history table (triggers on properties + properties_extension) + one-shot
backfill from property_details.listing_events for pre-trigger history.
Tax reassessment forecast MI · Partial reset (capped growth)
- Current annual tax
- $2,170 · $181/mo
- Projected year-2 tax
- $2,393 · $199/mo
- Expected delta
- +$223/yr (+$19/mo · 10.3%)
ⓘ Screening estimate from a state-policy table — verify with the county assessor before closing.
Climate risk First Street
- Flood 6/10 Major FEMA zone X (unshaded) · 74% chance over 30 yrs
- Wildfire 1/10 Low
- Heat 2/10 Low 7 d/yr ≥96°F today · 15 d/yr by 30 yrs out
- Wind 2/10 Low
- Air quality 3/10 Moderate 2 unhealthy d/yr today · 4 by 30 yrs out
Nearby sold comps map
Loading sold comps map…
Walkable amenities ~0.75 mi
Loading nearby amenities…
Taxation est. · year 1
- Rental income
- $17,890
- − Mortgage interest
- −$9,517
- − Property taxes
- −$2,170
- − Insurance
- −$850
- − Repairs & maintenance
- −$1,431
- − Management
- −$1,431
- − Depreciation
- −$4,943
- Taxable loss
- −$2,451
- Est. tax savings @ 24.0%
- +$588
- After-tax cash flow
- $1,010/yr
For passive investors: Depreciation is non-cash, so a rental often shows a tax loss while cash-flowing — sheltering income. Rental losses are passive: they offset passive income freely, and up to $25,000/yr can offset ordinary (W-2) income if you actively participate and your MAGI is under $100k (phasing out to $0 by $150k); unused losses carry forward. On sale, claimed depreciation is recaptured at up to 25%, and gains may owe capital-gains tax (a 1031 exchange can defer both). Figures are a year-1 estimate at your 24.0% rate — not tax advice; consult a CPA.
Schools (NCES district)
- District
- West Bloomfield School District
- NCES district ID
- 2635820
- Math proficiency
- 42% ▼ -6.00%
- Reading proficiency
- 55% ▼ -2.00%
- Median HH income
- $89,668
- Composite
- 45.28/100
- National rank
- #2653
- State rank
- #83 of 540 in MI
Livability — Keego Harbor
- Score
- 78/100
- State rank
- #110
- US rank
- #2643
Category grades
Schools grade is shown separately in the Schools card above.
Census & demographics
- Census place
- Keego Harbor, MI
- Population (ZIP)
- 4,257
Population outlook (Oakland County) Hauer SSP2
- Today (2025)
- 1,335,747 people
- By 2030
- 1,375,100 · +2.9%
- By 2040
- 1,435,385 · +7.5%
- By 2050
- 1,469,250 · +10.0%
- By 2075
- 1,531,946 · +14.7%
- By 2100
- 1,450,485 · +8.6%
Race, ethnicity, and origin ACS 2023
- Neighborhood character
- Predominantly White (84%)
- Race & ethnicity
- White 84% Two or more races 7% Hispanic / Latino 5% Black 5% Asian 1%
- Hispanic origin (detail)
- Mexican 3%
- Common ancestry
- Romanian 9% Scotch-Irish 3% Iranian 2%
- Foreign-born
- 9% · Canada
- Languages at home
- 89% English-only · Other Indo-European 3% Spanish 2% Arabic 2%
Political lean MEDSL · Oakland
- 2024 margin
- D (+10.6) · D 54.4% · R 43.8% · Other 1.9%
- 2008→2024 swing
- -3.9pp toward R · 2008: 14.5pp · 2024: 10.6pp
- All cycles
- 2024: D+10.6 2020: D+14.1 2016: D+8.1 2012: D+8.1 2008: D+14.5
Not yet ingested
- Civics
- —
Market trends
- HPI YoY
- ▼ -177.64%
- Current HPI
- 201.4886
- Rent YoY
- —
- Metro
- —
- State GDP YoY
- ▲ 1.37%
- F500 in state
- 28
Industry mix (Fortune 500 HQ in MI)
| Industry | F500 HQs | Revenue |
|---|---|---|
| Automotive Parts | 3 | $48B |
|
||
| Automotive | 2 | $372B |
|
||
| Chemicals | 1 | $45B |
|
||
| Automotive Retail | 1 | $29B |
|
||
| Healthcare / Medical Devices | 1 | $23B |
|
||
| Automotive Technology | 1 | $20B |
|
||
Price history
+0.0% since first listed2 events — show timeline
- 2026-03-20 Listed $179,900 MiRealSource-MiMLS
- 2026-03-20 Listed $179,900 REALCOMP
Property tax history
+2.3%/yrLatest (2025): $2,170 · +0.1% YoY. Source: county tax records.
Cash-flow waterfall
monthlySold comps — $/sqft
last 12 mo · ≤1 miLoading sold comps…