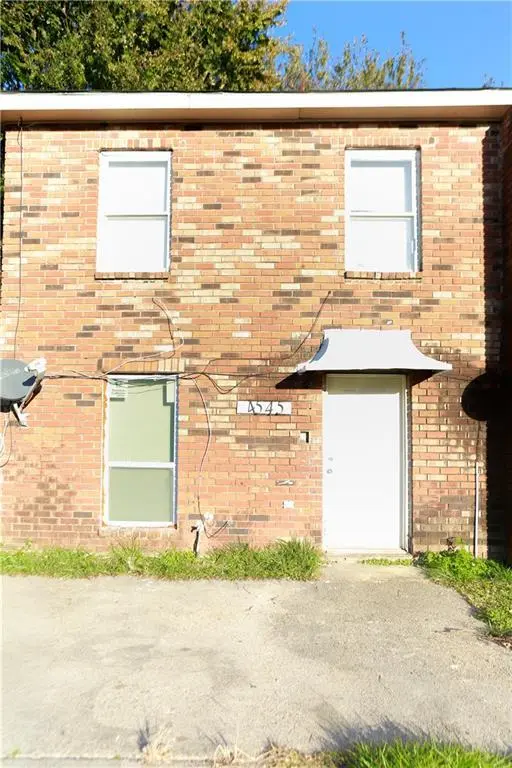
4545 Skyview Dr · New Orleans, LA
Flood risk 8/10 · Major
- FEMA flood zone
- X (shaded)
- Chance of flooding over 30 yrs
- 0.6%
- Est. flood insurance / yr
- $507 – $1,088
Fire risk 1/10 · Minimal
- Est. fire insurance / yr
- $1,269 – $2,357
Heat risk 10/10 · Severe
- Hot days now (above 107°F)
- 7 days/yr
- Hot days in 30 yrs
- 21 days/yr
Wind risk 10/10 · Severe
- Chance of severe wind over 30 yrs
- 99.0%
Air-quality risk 3/10 · Minor
- Unhealthy air days now
- 3 days/yr
- Unhealthy air days in 30 yrs
- 3 days/yr
Risk factors via First Street. Map © Google.
Why this score? — see what drove the B grade
The composite is a weighted blend of 9 inputs, each scored 0–100. Each bar is that input's sub-score; the figure is the points it added to the 100-point composite (weight × sub-score).
- Cash flow +30.0/30.0
- ARV discount +11.2/15.0
- 1% rule +10.0/10.0
- DSCR +10.0/10.0
- Livability +4.0/5.0
- Condition / age +2.5/5.0
- Rent growth +2.4/5.0
- Schools +1.6/10.0
- Appreciation +0.0/10.0
$77,000
🖨 Deal sheet 📄 Offer letter ✓ Due diligence
Listing remarks MLS
GREAT INVESTMENT OPPORTUNITY!! Check out this 4-Bedroom, 2.5 Bathroom move in ready. You can purchase, live in or rent out the option is yours. PRICED TO SELL - 4541 Skyview is for sale also...
Key facts
- 2 parking spots
- Built 1980
- Listed 211 days
Neighborhood map
What this means for you Summary
Snapshot
- This is a 3-bed/1.5-bath townhouse listed at $77k.
Deal economics
- At list price, monthly cash flow is $768 ($9k/yr) — positive.
- The deal already cash-flows at list — no discount required.
- Meets the 1% rule at list price ($2k rent vs $77k).
- Recommended offer: $68k (12.0% below list) — sets the bar for market timing.
- Cap rate 19.3% vs local median 4.4% in New Orleans — top-decile yield for the area; either an underpriced asset or a hidden risk that comps aren't pricing in. Stress-test before assuming the spread holds.
Location & tenants
- Location reads 81/100 on livability (#3 in LA, #1,383 nationally) — a professional / high-income tenant draw. Strengths: amenities A+, commute A+, health & safety A+; Watch: crime C-, employment D.
- Orleans Parish (urban): math 11% / reading 27% proficiency, ranked #69 of 98 in LA (top 70%) — low school quality limits family demand, transient renter base, plan for 1-2y turnover; 68% free/reduced lunch — lower-income household profile, screen leases tightly.
- Market conditions: Rents soft (-0.2%/yr); 224 active listings in the ZIP; 33 comparable units currently listed for rent nearby; rentals at typical pace (median 24d on market — plan ~3-4 weeks tenant-placement turnaround); lower-income renter base — watch delinquency; 710 units permitted in Orleans Parish in 2024 (244 in 5+ unit buildings).
- At $1,673/mo this rent would consume 48% of the median local household income ($42k/yr) (locally 1767% of renters already pay >50% of income on rent) — very limited rent-growth headroom before tenants either downsize or default.
Forward outlook
- Local home prices are declining (-3.0%/yr); year-one equity from $532 of loan paydown is wiped out by about $2k of value loss. Plan a longer hold.
- Orleans County population projected at +61% by 2050 — long-run rental-demand tailwind backs the buy-and-hold thesis.
- At projected returns (-3.0% appreciation + 0.0% rent growth), your $22k cash investment doubles in ~3 years — after that, you're playing with house money.
Negotiation context
- It's been on market 212 days — a 12% lower offer ($68k) is reasonable based on typical stale-listing flexibility.
- 4 sale attempts since 31y ago; this cycle's ask has dropped $8k (9%) from the opening price — seller is motivated, your offer sets the floor, not the list.
- Current owner paid $10k; list at $77k implies a 670% gain — meaningful room to come down on a strong offer.
Risks & watch-outs
- Watch-outs: flood insurance adds $66/mo.
- Climate carrying-cost: severe flood risk; severe wind risk, 99% chance of damaging wind over 30y; extreme-heat days projected 7→21/yr by 2055 (HVAC capex compounding) — expect insurance premiums to compound above CPI over the hold.
Questions for the listing agent
- It's been on market 212 days. Have you received any prior offers? Is the seller open to a 12% concession, seller financing, or rate buy-down credit?
- What's the actual annual flood-insurance premium (NFIP or private), and is the property in a SFHA with mandatory coverage?
- Why hasn't it sold? Are there any deal-killer items the seller is aware of (foundation, flood, title, zoning, code violations)?
- Is there a deadline driving the sale (1031 exchange, divorce, estate, relocation)? That informs how much negotiation room exists.
- What's the average days-on-market for RENTAL listings here right now (not sales)? A rising rental-DOM trend means longer vacancies and softer asking-rent achievability than the comps imply.
- What's the recent tenant-quality profile in this submarket — average credit score on applications, eviction rate, late-payment / NSF rate, and stable-employment percentage? A property-management company in the area should have these aggregated.
- How much new for-sale + rental construction is in the pipeline within 1–3 miles? Heavy new supply typically softens prices + rents 12–24 months out; constrained supply supports both.
Investment metrics
- 1% rule
- 2.17% ✓
- Cap rate
- 19.30%
- Cash-on-cash
- 46.47%
- DSCR
- 3.07
- GRM
- 3.8
CMA / ARV
- ARV (median comp)
- $83,964
- List price
- $77,000
- Delta
- -8.29%
- Verdict
- FAIR
- Comps
- 2 within 1.0 mi
Show comp detail 2 sales within ~0.75 mi
| Address | Dist | Beds/Ba | Sqft | Sold | Price | $/sf | Match |
|---|---|---|---|---|---|---|---|
| 5116 Lakeview Ct | 0.67mi | 3/2.0 | 1,400 (-3%) | 1mo | $112,500 | $80 | 61 |
| 6530 Coveview Ct | 0.59mi | 2/2.5 (-1) | 1,440 (-0%) | 4mo | $82,000 | $57 | 60 |
Match score weights: distance 35% · size 25% · config 20% · recency 20%. Top-matched comps best support the ARV.
Projected returns pro-forma
-3.0% appreciation · 0.0% rent growth · sell at horizon
- IRR
- 36.1%
- Equity multiple
- 2.47×
- Total profit
- $31,597
- Equity at exit
- $11,481
- IRR
- 41.2%
- Equity multiple
- 4.33×
- Total profit
- $71,740
- Equity at exit
- $6,658
Cash invested: $21,560 (down + closing). Projections, not guarantees.
Landlord ↔ Tenant lean methodology
- Overall (STATE)
- 90 Strongly Landlord-Friendly
- State Louisiana
- 90 Strongly Landlord-Friendly · R+12
- County
- — inherits STATE
- City
- — inherits STATE
ZIP-level market 70126
- Home prices YoY
- -17.0%
- Rents YoY
- -0.2%
- Active inventory
- 224
- Price-to-rent
- 3.8×
Monthly cashflow live
- Estimated rent
- $1,673 high interval (Pro) →
- Mortgage (P&I)
- −$404
- Tax from tax record
- −$51 /mo · $610/yr
- Insurance
- −$32
- Flood insurance flood zone
- −$66 /mo · $798/yr
- HOA
- −$0
- Vacancy / Maint / Mgmt
- −$351
- Net cashflow
- $768
Break-even live
UW: 25.0% down · 7.5% · 30yr · 1.5% tax · 5.0% vac · 8.0% maint · 8.0% mgmt
Financing live
Cash to close
- Down payment
- $19,250
- Closing costs
- $2,310
- Reserves months
- —
- Total cash needed
- —
Loan-product check · same deal, 3 products live
Conventional
25% down · 7.5% · 30yr
- Down + closing
- —
- Monthly P&I
- —
- Monthly cashflow
- —
- DSCR
- —
- Eligible?
- —
Personal DTI + credit; lowest rate.
DSCR
20% down · 8.5% · 30yr
- Down + closing
- —
- Monthly P&I
- —
- Monthly cashflow
- —
- DSCR
- —
- Eligible?
- —
No personal income docs; deal must DSCR.
Hard money
10% down · 12.0% · 12mo
- Down + closing
- —
- Monthly P&I
- —
- Monthly cashflow
- —
- DSCR
- —
- Eligible?
- —
Short-term bridge; refi at stabilization.
Rent comps 33 comps
| Address | Beds | Baths | Sqft | Rent | $/sqft | DOM | Units | Dist |
|---|---|---|---|---|---|---|---|---|
| 4522 Shalimar Dr New Orleans, LA | 3.0 | 2.0 | 1350 | $1,850 | $1.37 | 23d | 1 | 0.09mi |
| 5920 Boeing St New Orleans, LA | 3.0 | 1.5 | 1340 | $1,400 | $1.04 | 23d | 1 | 0.09mi |
| 4527 Shalimar Dr New Orleans, LA | 3.0 | 1.5 | 1174 | $1,550 | $1.32 | 23d | 1 | 0.11mi |
| 4441 Cessna Ct New Orleans, LA | 3.0 | 1.5 | 1400 | $1,600 | $1.14 | 23d | 1 | 0.13mi |
| 4409 Skyview Dr New Orleans, LA | 4.0 | 2.5 | 1560 | $1,700 | $1.09 | 16d | 1 | 0.14mi |
| 4722 Shalimar Dr New Orleans, LA | 3.0 | 2.0 | 1157 | $1,400 | $1.21 | 23d | 1 | 0.16mi |
| 4211 Downman Rd New Orleans, LA | 2.0 | 1.0 | 900 | $1,250 | $1.39 | 23d | 1 | 0.17mi |
| 4745 Francis Dr New Orleans, LA | 3.0 | 2.0 | 1311 | $1,550 | $1.18 | 16d | 1 | 0.35mi |
| 4819 21 Francis Dr New Orleans, LA | 3.0 | 1.0 | 1272 | $1,880 | $1.48 | 3d | 1 | 0.39mi |
| 4718 Reynes St New Orleans, LA | 2.0 | 1.5 | 890 | $1,475 | $1.66 | 23d | 1 | 0.52mi |
| 6628 Harbourview Dr New Orleans, LA | 3.0 | 2.5 | 1520 | $1,700 | $1.12 | 3d | 1 | 0.67mi |
| 7404 Sussex Pl New Orleans, LA | 2.0 | 1.5 | 1400 | $1,450 | $1.04 | 3d | 1 | 0.92mi |
| 4452 Plum Orchard Ave New Orleans, LA | 2.0 | 1.0 | 1100 | $1,250 | $1.14 | 3d | 1 | 0.94mi |
| 7225 Chef Menteur Hwy New Orleans, LA | 1.0–2.0 | 1.0–2.0 | 739 | $994 | $1.35 | 2d | 10 | 0.94mi |
| 5747 Pauline Dr New Orleans, LA | 3.0 | 1.0 | 1300 | $1,400 | $1.08 | 11d | 1 | 1.02mi |
| 4941 Pecan St Unit 1 New Orleans, LA | 2.0 | 1.0 | 1000 | $1,200 | $1.20 | 23d | 1 | 1.02mi |
| 4745 Tulip St New Orleans, LA | 3.0 | 1.0 | 1125 | $1,750 | $1.56 | 20d | 1 | 1.03mi |
| 7621 Alabama St New Orleans, LA | 2.0 | 1.0 | 1000 | $1,400 | $1.40 | 23d | 1 | 1.04mi |
| 7611 Mayfair Pl New Orleans, LA | 2.0 | 1.5 | 1440 | $1,450 | $1.01 | 3d | 1 | 1.04mi |
| 4722 Mithra St New Orleans, LA | 3.0 | 1.5 | 1295 | $1,600 | $1.24 | 23d | 1 | 1.05mi |
| 5704 Count Ln New Orleans, LA | 3.0 | 1.5 | 1572 | $1,700 | $1.08 | 23d | 1 | 1.06mi |
| 5925 Pauline Dr New Orleans, LA | 3.0 | 2.0 | 1566 | $2,325 | $1.48 | 16d | 1 | 1.10mi |
| 7702 Belcrest Pl New Orleans, LA | 3.0 | 1.5 | 1150 | $1,650 | $1.43 | 23d | 1 | 1.10mi |
| 7502 Chef Menteur Hwy New Orleans, LA | 3.0 | 1.0 | 1000 | $1,500 | $1.50 | 23d | 1 | 1.19mi |
| 6027 Wales St New Orleans, LA | 3.0 | 1.0 | 1146 | $1,550 | $1.35 | 23d | 1 | 1.21mi |
| 6025 Wales St New Orleans, LA | 3.0 | 1.0 | 1147 | $1,550 | $1.35 | 23d | 1 | 1.22mi |
| 7918 W Laverne St New Orleans, LA | 3.0 | 2.0 | 1166 | $1,750 | $1.50 | 23d | 1 | 1.23mi |
| 6030 Kuebel Dr New Orleans, LA | 3.0 | 2.0 | 1100 | $1,600 | $1.45 | 23d | 1 | 1.24mi |
| 6032 Kuebel Dr New Orleans, LA | 3.0 | 2.0 | 1100 | $1,600 | $1.45 | 23d | 1 | 1.24mi |
| 8003 W Laverne St Unit 8003 New Orleans, LA | 2.0 | 1.5 | 1000 | $1,275 | $1.27 | 23d | 1 | 1.26mi |
| 4808 Viola St New Orleans, LA | 3.0 | 2.0 | 1130 | $1,500 | $1.33 | 23d | 1 | 1.40mi |
| 4880 Viola St New Orleans, LA | 3.0 | 2.0 | 1150 | $1,595 | $1.39 | 23d | 1 | 1.42mi |
| 5550 Press Dr New Orleans, LA | 3.0 | 2.0 | 1640 | $2,000 | $1.22 | 16d | 1 | 1.43mi |
Listing history 25 events
-
2026-06-18days on market $77,000 Active 212 DOM
-
2026-06-17days on market $77,000 Active 211 DOM
-
2026-06-16days on market $77,000 Active 210 DOM
-
2026-06-15days on market $77,000 Active 209 DOM
-
2026-06-13days on market $77,000 Active 207 DOM
-
2026-06-10days on market $77,000 Active 204 DOM
-
2026-06-09days on market $77,000 Active 203 DOM
-
2026-06-08days on market $77,000 Active 202 DOM
-
2026-06-07days on market $77,000 Active 201 DOM
-
2026-06-05days on market $77,000 Active 198 DOM
-
2026-06-03days on market $77,000 Active 197 DOM
-
2026-06-02days on market $77,000 Active 196 DOM
-
2026-06-01days on market $77,000 Active 195 DOM
-
2026-05-31days on market $77,000 Active 194 DOM
-
2026-04-30price $77,000 193-char remark
Show marketing remark (195 chars)
GREAT INVESTMENT OPPORTUNITY!! Check out this 4-Bedroom, 2.5 Bathroom move in ready. You can purchase, live in or rent out the option is yours. PRICED TO SELL - 4541 Skyview is for sale also. ..
-
2026-04-30price $77,000 195-char remark
Show marketing remark (195 chars)
GREAT INVESTMENT OPPORTUNITY!! Check out this 4-Bedroom, 2.5 Bathroom move in ready. You can purchase, live in or rent out the option is yours. PRICED TO SELL - 4541 Skyview is for sale also. ..
-
2026-01-24price $79,000 193-char remark
Show marketing remark (195 chars)
GREAT INVESTMENT OPPORTUNITY!! Check out this 4-Bedroom, 2.5 Bathroom move in ready. You can purchase, live in or rent out the option is yours. PRICED TO SELL - 4541 Skyview is for sale also. ..
-
2026-01-24price $79,000 195-char remark
Show marketing remark (195 chars)
GREAT INVESTMENT OPPORTUNITY!! Check out this 4-Bedroom, 2.5 Bathroom move in ready. You can purchase, live in or rent out the option is yours. PRICED TO SELL - 4541 Skyview is for sale also. ..
-
2025-11-18$85,000 Active 193-char remark
Show marketing remark (195 chars)
GREAT INVESTMENT OPPORTUNITY!! Check out this 4-Bedroom, 2.5 Bathroom move in ready. You can purchase, live in or rent out the option is yours. PRICED TO SELL - 4541 Skyview is for sale also. ..
-
2025-11-18$85,000 Active 195-char remark
Show marketing remark (195 chars)
GREAT INVESTMENT OPPORTUNITY!! Check out this 4-Bedroom, 2.5 Bathroom move in ready. You can purchase, live in or rent out the option is yours. PRICED TO SELL - 4541 Skyview is for sale also. ..
-
1995-05-31soldstatus $10,000
-
1995-05-31soldstatus $10,000
-
1995-03-29$12,000
-
1995-03-29$12,000
-
1991-04-26soldstatus $29,600
ⓘ Source: listings_history table (triggers on properties + properties_extension) + one-shot
backfill from property_details.listing_events for pre-trigger history.
Tax reassessment forecast LA · Resets to sale price
- Current annual tax
- $610 · $51/mo
- Projected year-2 tax
- $610 · $51/mo
- Expected delta
- $0/yr ($0/mo · 0.0%)
ⓘ Screening estimate from a state-policy table — verify with the county assessor before closing.
Climate risk First Street
- Flood 8/10 Severe FEMA zone X (shaded) · 60% chance over 30 yrs
- Wildfire 1/10 Low
- Heat 10/10 Extreme 7 d/yr ≥107°F today · 21 d/yr by 30 yrs out
- Wind 10/10 Extreme 99% chance of damaging wind over 30 yrs
- Air quality 3/10 Moderate 3 unhealthy d/yr today · 3 by 30 yrs out
Nearby sold comps map
Loading sold comps map…
Walkable amenities ~0.75 mi
Loading nearby amenities…
Taxation est. · year 1
- Rental income
- $20,074
- − Mortgage interest
- −$4,313
- − Property taxes
- −$610
- − Insurance
- −$1,182
- − Repairs & maintenance
- −$1,606
- − Management
- −$1,606
- − Depreciation
- −$2,240
- Taxable income
- $8,517
- Est. tax owed @ 24.0%
- −$2,044
- After-tax cash flow
- $7,177/yr
For passive investors: Depreciation is non-cash, so a rental often shows a tax loss while cash-flowing — sheltering income. Rental losses are passive: they offset passive income freely, and up to $25,000/yr can offset ordinary (W-2) income if you actively participate and your MAGI is under $100k (phasing out to $0 by $150k); unused losses carry forward. On sale, claimed depreciation is recaptured at up to 25%, and gains may owe capital-gains tax (a 1031 exchange can defer both). Figures are a year-1 estimate at your 24.0% rate — not tax advice; consult a CPA.
Schools (NCES district)
- District
- Orleans Parish
- NCES district ID
- 2201170
- Math proficiency
- 11% ▼ -52.00%
- Reading proficiency
- 27% ▼ -46.00%
- Median HH income
- $37,011
- Composite
- 15.78/100
- National rank
- #9271
- State rank
- #69 of 98 in LA
Livability — New Orleans
- Score
- 81/100
- State rank
- #3
- US rank
- #1383
Category grades
Schools grade is shown separately in the Schools card above.
Census & demographics
- Census place
- New Orleans, LA
- County
- Orleans Parish · 338,817 people
- City population
- 338,817
- Metro
- New Orleans-Metairie, LA
- Population (ZIP)
- 27,047
- Household income
- $41,709
- Rent vs Own
- Severe rent burden
- 1767.0
Population outlook (Orleans County) Hauer SSP2
- Today (2025)
- 513,025 people
- By 2030
- 575,781 · +12.2%
- By 2040
- 700,174 · +36.5%
- By 2050
- 826,541 · +61.1%
- By 2075
- 1,123,374 · +119.0%
- By 2100
- 1,355,609 · +164.2%
Race, ethnicity, and origin ACS 2023
- Neighborhood character
- Predominantly Black (85%)
- Race & ethnicity
- Black 85% Hispanic / Latino 6% Two or more races 5% White 5%
- Hispanic origin (detail)
- Common ancestry
- Lithuanian 1% Italian 1%
- Foreign-born
- 4% · Canada, Vietnam
- Languages at home
- 94% English-only · Spanish 5% Other Indo-European 1%
Political lean MEDSL · Orleans
- 2024 margin
- Solid D (+67.0) · D 82.2% · R 15.2% · Other 2.7%
- 2008→2024 swing
- +6.7pp toward D · 2008: 60.3pp · 2024: 67.0pp
- All cycles
- 2024: D+67.0 2020: D+68.2 2016: D+66.2 2012: D+62.5 2008: D+60.3
Not yet ingested
- Civics
- —
Market trends
- HPI YoY
- ▼ -36.35%
- Current HPI
- 177.355
- Rent YoY
- ▼ -0.24%
- Metro
- New Orleans-Metairie, LA
- State GDP YoY
- ▲ 3.29%
- F500 in state
- 10
Industry mix (Fortune 500 HQ in LA)
| Industry | F500 HQs | Revenue |
|---|---|---|
| Telecommunications | 2 | $23B |
|
||
| Utilities | 1 | $12B |
|
||
| Wholesale / Distribution | 1 | $5B |
|
||
| Advertising | 1 | $2B |
|
||
Price history
+160.1% since first listed11 events — show timeline
- 2026-04-30 Price Changed $77,000 AcadianaMLS
- 2026-04-30 Price Changed $77,000 GSREIN
- 2026-01-24 Price Changed $79,000 AcadianaMLS
- 2026-01-24 Price Changed $79,000 GSREIN
- 2025-11-18 Listed $85,000 GSREIN
- 2025-11-18 Listed $85,000 AcadianaMLS
- 1995-05-31 Sold (Public Records) $10,000 Public Records
- 1995-05-31 Sold (MLS) $10,000 GSREIN
- 1995-03-29 Listed $12,000 GSREIN
- 1995-03-29 Listed $12,000 AcadianaMLS
- 1991-04-26 Sold (Public Records) $29,600 Public Records
Property tax history
+0.6%/yrLatest (2026): $610 · +1.1% YoY. Source: county tax records.
Cash-flow waterfall
monthlySold comps — $/sqft
last 12 mo · ≤1 miLoading sold comps…