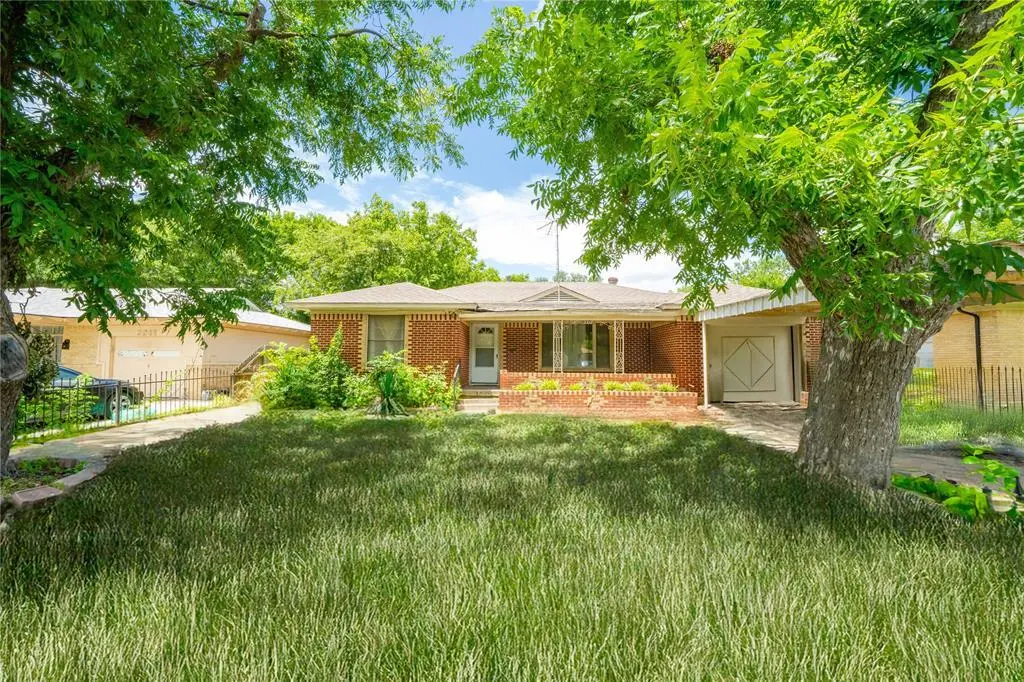
2217 Gaylord Dr · Dallas, TX
Flood risk 1/10 · Minimal
- FEMA flood zone
- X (unshaded)
- Chance of flooding over 30 yrs
- 0.0%
- Est. flood insurance / yr
- $507 – $1,088
Fire risk 3/10 · Minor
- Est. fire insurance / yr
- $1,222 – $2,270
Heat risk 7/10 · Major
- Hot days now (above 109°F)
- 7 days/yr
- Hot days in 30 yrs
- 25 days/yr
Wind risk 6/10 · Moderate
- Chance of severe wind over 30 yrs
- 27.0%
Air-quality risk 2/10 · Minimal
- Unhealthy air days now
- 2 days/yr
- Unhealthy air days in 30 yrs
- 2 days/yr
Risk factors via First Street. Map © Google.
Why this score? — see what drove the C- grade
The composite is a weighted blend of 9 inputs, each scored 0–100. Each bar is that input's sub-score; the figure is the points it added to the 100-point composite (weight × sub-score).
- Cash flow +15.6/30.0
- ARV discount +15.0/15.0
- 1% rule +6.4/10.0
- DSCR +4.8/10.0
- Livability +4.0/5.0
- Schools +2.8/10.0
- Condition / age +2.5/5.0
- Rent growth +2.4/5.0
- Appreciation +0.0/10.0
$160,000
🖨 Deal sheet 📄 Offer letter ✓ Due diligence
Listing remarks MLS
Cozy, 3 bedroom, 1 bath brick home, located in the community of Piedmont, approximately 8 miles southeast of Downtown Dallas. Some property features include laminate & ceramic tile flooring, chair rails, tile countertops, iron & wood fencing, eat-in kitchen, and a storage building in the backyard. Property to be repaired by seller. All information is approximate and needs to be verified. No seller's disclosure available.
Key facts
- Recent updates
- Updated trim
- New garage windows
Tags
Property features AI
Finance
- Other: No special taxing entities; No easements listed; No accessory unit; Restrictions: None
- Financial info: Listing terms: Cash or Conventional; Treat as clear loan type; No second mortgage
- HOA & community: No homeowners association
Exterior
- Parking: Attached carport; Attached 2-car garage (14 ft. wide x 20 ft. deep); 1 carport space covered (plus 2 covered spaces listed)
- Security: Carbon monoxide detector(s); Fire alarm
- Utilities: City water; City sewer; Electricity connected; Cable available
- Home design: Single family residence; Residential property; One story; Entry faces front (garage faces front)
- Construction: Brick construction; Shingle roof; Pillar/post/pier foundation; Built in 1953
- Exterior features: Covered front porch; Covered porch(es); Gutters; Storage/other structures; Gate fencing; Large backyard with grass; Few trees
Interior
- Kitchen: Kitchen (15 x 10)
- Bedrooms: 3 bedrooms (primary bedroom on level 1)
- Flooring: Hardwood; Laminate; Tile
- Bathrooms: 1 full bathroom
- Heating & cooling: Central heating (natural gas); Central air; Ceiling fans
- Interior features: Cable TV available; High-speed internet available; One living area; One dining area; One level (single story)
- Laundry & utility: Full-size washer/dryer area; Washer hookup; Electric dryer hookup; Laundry area in garage
Neighborhood map
What this means for you Summary
Snapshot
- This is a 3-bed/1.0-bath single-family listed at $160k.
Deal economics
- At list price, monthly cash flow is $66 ($797/yr) — positive.
- The deal already cash-flows at list — no discount required.
- Meets the 1% rule at list price ($2k rent vs $160k).
- Recommended offer: $155k (3.0% below list) — sets the bar for market timing.
- Cap rate 6.8% vs local median 2.3% in Dallas — top-decile yield for the area; either an underpriced asset or a hidden risk that comps aren't pricing in. Stress-test before assuming the spread holds.
Location & tenants
- Location reads 81/100 on livability (#24 in TX, #1,380 nationally) — a professional / high-income tenant draw. Strengths: amenities A+, commute A+, housing A+; Watch: crime F.
- Dallas ISD (urban): math 31% / reading 36% proficiency, ranked #559 of 826 in TX (top 68%) — families likely to look elsewhere, expect single-tenant / working-renter base with shorter leases; 83% free/reduced lunch — lower-income household profile, screen leases tightly.
- Zoned schools: Thelma Elizabeth Page Richardson El (math 34% / reading 38%, grade F, #1,921 of 4,322 statewide, top 45%, 506 students, 92% FRL).
- Market conditions: Rents soft (-0.4%/yr); 179 active listings in the ZIP; 20 comparable units currently listed for rent nearby; rentals at typical pace (median 24d on market — plan ~3-4 weeks tenant-placement turnaround); 40% of comp listings sitting > 30 days — soft ceiling on asking rent; 12,577 units permitted in Dallas County in 2024 (6,829 in 5+ unit buildings).
- This rent runs 34% of the median local income ($64k/yr) — at the standard rent-burdened threshold; future hikes will face affordability resistance.
Forward outlook
- Local home prices are declining (-3.0%/yr); year-one equity from $1k of loan paydown is wiped out by about $5k of value loss. Plan a longer hold.
- Dallas County population projected at +35% by 2050 — long-run rental-demand tailwind backs the buy-and-hold thesis.
Negotiation context
- It's been on market 32 days — a 3% lower offer ($155k) is reasonable based on typical stale-listing flexibility.
- 4 sale attempts since 19y ago with the ask held roughly flat each time — persistent listings suggest the price (not the market) is what's stuck; bring a comps-based counter.
Risks & watch-outs
- Watch-outs: property tax is 3.5% of price; built in 1953 — expect roof / HVAC / electrical / plumbing capex.
- Climate carrying-cost: major wind risk, 27% chance of damaging wind over 30y; extreme-heat days projected 7→25/yr by 2055 (HVAC capex compounding) — expect insurance premiums to compound above CPI over the hold.
Questions for the listing agent
- It's been on market 32 days. Have you received any prior offers? Is the seller open to a 3% concession, seller financing, or rate buy-down credit?
- Built in 1953 — when were the roof, HVAC, electrical panel, plumbing, and water heater last replaced?
- Property tax is high relative to price — has the assessment been appealed recently, and will the sale trigger a re-assessment?
- Is there a deadline driving the sale (1031 exchange, divorce, estate, relocation)? That informs how much negotiation room exists.
- Crime grade is F in this area — have there been break-ins, vandalism, or insurance claims at this property in the last 3 years? What carrier currently insures it and at what premium?
- What's the average days-on-market for RENTAL listings here right now (not sales)? A rising rental-DOM trend means longer vacancies and softer asking-rent achievability than the comps imply.
- What's the recent tenant-quality profile in this submarket — average credit score on applications, eviction rate, late-payment / NSF rate, and stable-employment percentage? A property-management company in the area should have these aggregated.
- How much new for-sale + rental construction is in the pipeline within 1–3 miles? Heavy new supply typically softens prices + rents 12–24 months out; constrained supply supports both.
Investment metrics
- 1% rule
- 1.14% ✓
- Cap rate
- 6.79%
- Cash-on-cash
- 1.78%
- DSCR
- 1.08
- GRM
- 7.3
CMA / ARV
- ARV (median comp)
- $245,778
- List price
- $160,000
- Delta
- -34.90%
- Verdict
- UNDERPRICED
- Comps
- 20 within 1.0 mi
Show comp detail 12 sales within ~0.75 mi
| Address | Dist | Beds/Ba | Sqft | Sold | Price | $/sf | Match |
|---|---|---|---|---|---|---|---|
| 2210 Gaylord Dr | 0.03mi | 4/3.0 (+1) | 1,221 (-3%) | 3mo | $285,000 | $233 | 78 |
| 7341 Ravehill Ln | 0.35mi | 3/2.0 | 1,276 (+2%) | 5mo | $225,000 | $176 | 73 |
| 1905 Houghton Rd | 0.51mi | 3/2.0 | 1,322 (+5%) | 0mo | $249,000 | $188 | 63 |
| 1928 Las Cruces Ln | 0.43mi | 3/1.0 | 1,324 (+5%) | 10mo | $199,900 | $151 | 63 |
| 7810 Dugan St | 0.35mi | 2/2.0 (-1) | 1,308 (+4%) | 6mo | $199,990 | $153 | 63 |
| 2211 San Pablo Dr | 0.06mi | 4/2.0 (+1) | 1,435 (+14%) | 5mo | $269,000 | $187 | 61 |
| 8017 Huttig Ave | 0.54mi | 2/1.5 (-1) | 1,272 (+1%) | 7mo | $210,000 | $165 | 60 |
| 2105 Major Dr | 0.24mi | 3/2.0 | 1,412 (+12%) | 11mo | $197,777 | $140 | 55 |
| 7328 Ravehill Ln | 0.38mi | 2/1.5 (-1) | 1,432 (+14%) | 2mo | $159,000 | $111 | 50 |
| 2407 Santa Cruz Dr | 0.56mi | 3/1.5 | 1,416 (+13%) | 11mo | $249,000 | $176 | 42 |
| 1811 Alhambra St | 0.62mi | 3/1.0 | 1,088 (-13%) | 9mo | $239,995 | $221 | 41 |
| 1715 Alhambra St | 0.71mi | 3/2.0 | 1,412 (+12%) | 13mo | $275,000 | $195 | 32 |
Match score weights: distance 35% · size 25% · config 20% · recency 20%. Top-matched comps best support the ARV.
Projected returns pro-forma
-3.0% appreciation · 0.0% rent growth · sell at horizon
- IRR
- -17.6%
- Equity multiple
- 0.40×
- Total profit
- $-26,858
- Equity at exit
- $23,857
- IRR
- -18.9%
- Equity multiple
- 0.16×
- Total profit
- $-37,843
- Equity at exit
- $13,834
Cash invested: $44,800 (down + closing). Projections, not guarantees.
Landlord ↔ Tenant lean methodology
- Overall (STATE)
- 87 Strongly Landlord-Friendly
- State Texas
- 87 Strongly Landlord-Friendly · R+5
- County
- — inherits STATE
- City
- — inherits STATE
ZIP-level market 75227
- Home prices YoY
- -30.9%
- Rents YoY
- -0.4%
- Active inventory
- 179
- Price-to-rent
- 7.3×
Monthly cashflow live
- Estimated rent
- $1,827 high interval (Pro) →
- Mortgage (P&I)
- −$839
- Tax from tax record
- −$471 /mo · $5,652/yr
- Insurance
- −$67
- HOA
- −$0
- Vacancy / Maint / Mgmt
- −$384
- Net cashflow
- $66
Break-even live
UW: 25.0% down · 7.5% · 30yr · 1.5% tax · 5.0% vac · 8.0% maint · 8.0% mgmt
Financing live
Cash to close
- Down payment
- $40,000
- Closing costs
- $4,800
- Reserves months
- —
- Total cash needed
- —
Loan-product check · same deal, 3 products live
Conventional
25% down · 7.5% · 30yr
- Down + closing
- —
- Monthly P&I
- —
- Monthly cashflow
- —
- DSCR
- —
- Eligible?
- —
Personal DTI + credit; lowest rate.
DSCR
20% down · 8.5% · 30yr
- Down + closing
- —
- Monthly P&I
- —
- Monthly cashflow
- —
- DSCR
- —
- Eligible?
- —
No personal income docs; deal must DSCR.
Hard money
10% down · 12.0% · 12mo
- Down + closing
- —
- Monthly P&I
- —
- Monthly cashflow
- —
- DSCR
- —
- Eligible?
- —
Short-term bridge; refi at stabilization.
Rent comps 20 comps
| Address | Beds | Baths | Sqft | Rent | $/sqft | DOM | Units | Dist |
|---|---|---|---|---|---|---|---|---|
| 2104 Hillburn Dr Dallas, TX | 3.0 | 1.5 | 1324 | $1,850 | $1.40 | 15d | 1 | 0.20mi |
| 7632 Livvie Meador Ln Dallas, TX | 4.0 | 2.0 | 1719 | $2,300 | $1.34 | 43d | 1 | 0.20mi |
| 1959 Hillburn Dr Dallas, TX | 3.0 | 1.0 | 912 | $1,700 | $1.86 | 6d | 1 | 0.38mi |
| 2423 Lolita Dr Dallas, TX | 3.0 | 2.0 | 1040 | $1,650 | $1.59 | 3d | 1 | 0.65mi |
| 8127 Stonehurst St #5 Dallas, TX | 2.0 | 1.0 | 1050 | $1,250 | $1.19 | 43d | 1 | 0.89mi |
| 8323 Lapanto Ln Unit B Dallas, TX | 3.0 | 1.5 | 968 | $1,375 | $1.42 | 43d | 1 | 0.93mi |
| 3205 Elva Ave Dallas, TX | 2.0 | 1.0 | 950 | $1,500 | $1.58 | 43d | 1 | 0.97mi |
| 3331 Urban Ave Dallas, TX | 4.0 | 2.0 | 1827 | $2,950 | $1.61 | 43d | 1 | 1.03mi |
| 8534 Bearden Ln Dallas, TX | 3.0 | 2.0 | 1332 | $1,600 | $1.20 | 24d | 1 | 1.04mi |
| 8609 Jennie Lee Ln Dallas, TX | 3.0 | 2.0 | 1863 | $2,300 | $1.23 | 5d | 1 | 1.06mi |
| 1315 Whitley Dr Unit 1 Dallas, TX | 2.0 | 1.0 | 1050 | $1,600 | $1.52 | 43d | 1 | 1.17mi |
| 8840 Milverton Dr Dallas, TX | 3.0 | 1.5 | 1016 | $1,599 | $1.57 | 43d | 1 | 1.26mi |
| 1355 N Jim Miller Rd Unit 23 Dallas, TX | 2.0 | 1.5 | 953 | $1,100 | $1.15 | 3d | 1 | 1.29mi |
| 1355 N Jim Miller Rd Unit 121 Dallas, TX | 3.0 | 1.5 | 1169 | $1,250 | $1.07 | 3d | 1 | 1.29mi |
| 1201 Rose Garden Ave Dallas, TX | 3.0 | 2.0 | 1472 | $1,750 | $1.19 | 43d | 1 | 1.36mi |
| 6540 Hollis Ave Dallas, TX | 2.0 | 1.0 | 1612 | $1,195 | $0.74 | 3d | 1 | 1.40mi |
| 6442 Latta St Dallas, TX | 3.0 | 3.0 | 1354 | $1,795 | $1.33 | 24d | 1 | 1.47mi |
| 6442 Latta St Dallas, TX | 3.0 | 3.0 | 1354 | $1,795 | $1.33 | 15d | 1 | 1.47mi |
| 1246 Lonsdale Ave Dallas, TX | 3.0 | 2.5 | 1501 | $2,050 | $1.37 | 20d | 1 | 1.50mi |
| 1244 Lonsdale Ave Dallas, TX | 3.0 | 2.5 | 1501 | $2,120 | $1.41 | 20d | 1 | 1.50mi |
Listing history 19 events
-
2026-06-10status $160,000 Pending 32 DOM
-
2026-06-09days on market $160,000 Active Option Contract 32 DOM
-
2026-06-08days on market $160,000 Active Option Contract 31 DOM
-
2026-06-07days on market $160,000 Active Option Contract 30 DOM
-
2026-06-04days on market $160,000 Active Option Contract 27 DOM
-
2026-06-03statusdays on market $160,000 Active Option Contract 26 DOM
-
2026-06-02days on market $160,000 Active 25 DOM
-
2026-06-01days on market $160,000 Active 24 DOM
-
2026-05-31days on market $160,000 Active 23 DOM
-
2026-05-18historical Active Option Contract 1010-char remark
-
2026-05-08$160,000 Active 1010-char remark
-
2025-12-31historical
-
2025-10-30price $190,000
-
2025-07-26price $195,000
-
2025-07-03$200,000 Active
-
2007-08-31soldstatus
Show marketing remark (436 chars)
Cozy, 3 bedroom, 1 bath brick home, located in the community of Piedmont, approximately 8 miles southeast of Downtown Dallas. Some property features include laminate & ceramic tile flooring, chair rails, tile countertops, iron & wood fencing, eat-in kitchen, and a storage building in the backyard. Property to be repaired by seller. All information is approximate and needs to be verified. No seller's disclosure available.
-
2007-07-03historical
Show marketing remark (436 chars)
Cozy, 3 bedroom, 1 bath brick home, located in the community of Piedmont, approximately 8 miles southeast of Downtown Dallas. Some property features include laminate & ceramic tile flooring, chair rails, tile countertops, iron & wood fencing, eat-in kitchen, and a storage building in the backyard. Property to be repaired by seller. All information is approximate and needs to be verified. No seller's disclosure available.
-
2007-02-21$74,900
Show marketing remark (436 chars)
Cozy, 3 bedroom, 1 bath brick home, located in the community of Piedmont, approximately 8 miles southeast of Downtown Dallas. Some property features include laminate & ceramic tile flooring, chair rails, tile countertops, iron & wood fencing, eat-in kitchen, and a storage building in the backyard. Property to be repaired by seller. All information is approximate and needs to be verified. No seller's disclosure available.
-
1999-04-07soldstatus
ⓘ Source: listings_history table (triggers on properties + properties_extension) + one-shot
backfill from property_details.listing_events for pre-trigger history.
Tax reassessment forecast TX · Resets to sale price
- Current annual tax
- $5,652 · $471/mo
- Projected year-2 tax
- $5,652 · $471/mo
- Expected delta
- $0/yr ($0/mo · -0.0%)
ⓘ Screening estimate from a state-policy table — verify with the county assessor before closing.
Climate risk First Street
- Flood 1/10 Low FEMA zone X (unshaded) · 0% chance over 30 yrs
- Wildfire 3/10 Moderate
- Heat 7/10 Severe 7 d/yr ≥109°F today · 25 d/yr by 30 yrs out
- Wind 6/10 Major 27% chance of damaging wind over 30 yrs
- Air quality 2/10 Low 2 unhealthy d/yr today · 2 by 30 yrs out
Nearby sold comps map
Loading sold comps map…
Walkable amenities ~0.75 mi
Loading nearby amenities…
Taxation est. · year 1
- Rental income
- $21,921
- − Mortgage interest
- −$8,962
- − Property taxes
- −$5,652
- − Insurance
- −$800
- − Repairs & maintenance
- −$1,754
- − Management
- −$1,754
- − Depreciation
- −$4,655
- Taxable loss
- −$1,656
- Est. tax savings @ 24.0%
- +$397
- After-tax cash flow
- $1,194/yr
For passive investors: Depreciation is non-cash, so a rental often shows a tax loss while cash-flowing — sheltering income. Rental losses are passive: they offset passive income freely, and up to $25,000/yr can offset ordinary (W-2) income if you actively participate and your MAGI is under $100k (phasing out to $0 by $150k); unused losses carry forward. On sale, claimed depreciation is recaptured at up to 25%, and gains may owe capital-gains tax (a 1031 exchange can defer both). Figures are a year-1 estimate at your 24.0% rate — not tax advice; consult a CPA.
Schools (NCES district)
- District
- Dallas ISD
- NCES district ID
- 4816230
- Math proficiency
- 31% ▼ -16.00%
- Reading proficiency
- 36% ▼ -4.00%
- Median HH income
- $42,881
- Composite
- 28.41/100
- National rank
- #6763
- State rank
- #559 of 826 in TX
Livability — Dallas
- Score
- 81/100
- State rank
- #24
- US rank
- #1380
Category grades
Schools grade is shown separately in the Schools card above.
Census & demographics
- Census place
- Dallas, TX
- County
- Dallas County · 2,612,404 people
- City population
- 1,168,437
- Metro
- Dallas-Fort Worth-Arlington, TX
- Population (ZIP)
- 58,319
- Household income
- $64,008
- Rent vs Own
- Severe rent burden
- 1679.0
Population outlook (Dallas County) Hauer SSP2
- Today (2025)
- 2,979,839 people
- By 2030
- 3,191,823 · +7.1%
- By 2040
- 3,619,611 · +21.5%
- By 2050
- 4,026,915 · +35.1%
- By 2075
- 4,957,073 · +66.4%
- By 2100
- 5,508,725 · +84.9%
Race, ethnicity, and origin ACS 2023
- Neighborhood character
- Majority Hispanic (62%)
- Race & ethnicity
- Hispanic / Latino 62% Two or more races 35% Black 28% White 8%
- Hispanic origin (detail)
- Mexican 56%
- Foreign-born
- 27% · Canada, Vietnam
- Languages at home
- 44% English-only · Spanish 55%
Political lean MEDSL · Dallas
- 2024 margin
- Strong D (+22.2) · D 60.2% · R 38.0% · Other 1.8%
- 2008→2024 swing
- +6.9pp toward D · 2008: 15.3pp · 2024: 22.2pp
- All cycles
- 2024: D+22.2 2020: D+31.6 2016: D+26.2 2012: D+15.4 2008: D+15.3
Not yet ingested
- Civics
- —
Market trends
- HPI YoY
- ▼ -148.56%
- Current HPI
- 332.3303
- Rent YoY
- ▼ -0.36%
- Metro
- Dallas-Fort Worth-Arlington, TX
- State GDP YoY
- ▲ 3.95%
- F500 in state
- 110
Industry mix (Fortune 500 HQ in TX)
| Industry | F500 HQs | Revenue |
|---|---|---|
| Energy | 16 | $1,198B |
|
||
| Technology | 5 | $198B |
|
||
| Engineering / Construction | 4 | $72B |
|
||
| Energy Services | 3 | $60B |
|
||
| Utilities | 3 | $41B |
|
||
| Healthcare | 2 | $330B |
|
||
Price history
+113.6% since first listed13 events — show timeline
- 2026-06-09 Pending — NTREIS
- 2026-06-03 Contingent — NTREIS
- 2026-05-26 Relisted — NTREIS
- 2026-05-18 Contingent — NTREIS
- 2026-05-08 Listed $160,000 NTREIS
- 2025-12-31 Listing Removed — NTREIS
- 2025-10-30 Price Changed $190,000 NTREIS
- 2025-07-26 Price Changed $195,000 NTREIS
- 2025-07-03 Listed $200,000 NTREIS
- 2007-08-31 Sold (MLS) — NTREIS
- 2007-07-03 Listing Removed — NTREIS
- 2007-02-21 Listed $74,900 NTREIS
- 1999-04-07 Sold (Public Records) — Public Records
Property tax history
+8.2%/yrLatest (2025): $5,652 · -0.4% YoY. Source: county tax records.
Cash-flow waterfall
monthlySold comps — $/sqft
last 12 mo · ≤1 miLoading sold comps…