 🏗️ New Construction
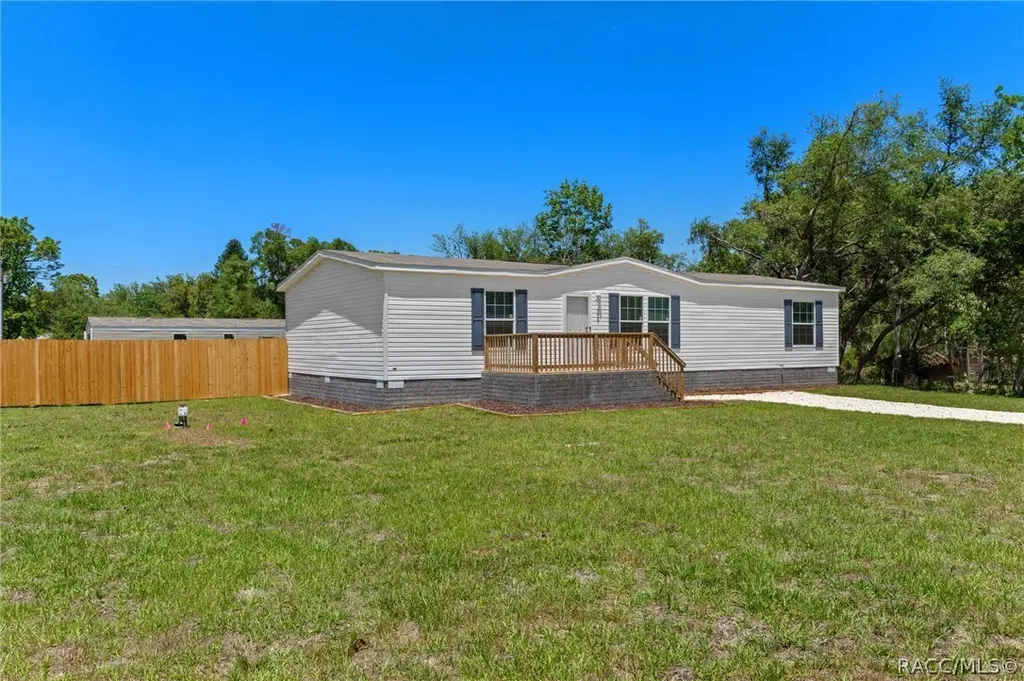
6487 W Erlen Ln · Homosassa Springs, FL
Flood risk 4/10 · Minor
- FEMA flood zone
- X (unshaded)
- Chance of flooding over 30 yrs
- 0.13%
- Est. flood insurance / yr
- $507 – $1,088
Fire risk 3/10 · Minor
- Est. fire insurance / yr
- $947 – $1,759
Heat risk 10/10 · Severe
- Hot days now (above 108°F)
- 7 days/yr
- Hot days in 30 yrs
- 25 days/yr
Wind risk 9/10 · Severe
- Chance of severe wind over 30 yrs
- 99.0%
Air-quality risk 1/10 · Minimal
- Unhealthy air days now
- 0 days/yr
- Unhealthy air days in 30 yrs
- 0 days/yr
Risk factors via First Street. Map © Google.
Why this score? — see what drove the D grade
The composite is a weighted blend of 9 inputs, each scored 0–100. Each bar is that input's sub-score; the figure is the points it added to the 100-point composite (weight × sub-score).
- Cash flow +13.1/30.0
- ARV discount +7.5/15.0
- Schools +4.1/10.0
- Condition / age +4.0/5.0
- DSCR +3.9/10.0
- 1% rule +3.7/10.0
- Livability +3.6/5.0
- Rent growth +2.5/5.0
- Appreciation +0.0/10.0
$204,900
🖨 Deal sheet 📄 Offer letter ✓ Due diligence
Listing remarks
Why rent when you can own a brand-new, move-in ready home and start building equity in a place of your own? This affordable new construction offers the comfort of no shared walls, no HOA fees, and the added bonus of a fully privacy-fenced backyard for enjoying outdoor living, pets, gardening, or simply relaxing in your own space. Situated on a ¼-acre (mol) lot, this spacious 3-bedroom, 2-bath manufactured home offers privacy, flexibility, and easy upkeep — excellent for buyers who want land without the maintenance of a large acreage. The open floor plan features a separate dining area, a spacious primary suite with en-suite bath, and two additional bedrooms with walk-in closet
Key facts
- No shared walls
- No hoa fees
- 0.26 acre lot
Tags
Property features AI
Exterior
- Parking: Gravel parking; Driveway; Boat parking; RV access/parking
- Utilities: Private well water; Septic tank
- Home design: Manufactured home (double wide); One story; New construction; Residential property
- Construction: Vinyl siding; Built as new construction
- Exterior features: Sliding doors; Privacy wood fencing; Asphalt shingle roof; Irregular lot; Paved road access; Approximately 0.26 acres
Interior
- Kitchen: Dishwasher; Electric oven; Electric range; Refrigerator
- Bathrooms: 2 full bathrooms
- Heating & cooling: Central heating (electric); Central air conditioning
- Interior features: Breakfast bar; Open floorplan; Walk-in closet(s)
- Laundry & utility: Water heater
Neighborhood map
What this means for you Summary
Snapshot
- This is a 3-bed/2.0-bath manufactured listed at $205k. Condition is rated good.
Deal economics
- At list price, monthly cash flow is $-8 ($-99/yr) — negative.
- The deal already cash-flows at list — no discount required.
- To meet the 1% rule (rent ≥ 1% of price), the offer needs to be $203k (1.1% below list).
- Recommended offer: $202k (1.5% below list) — sets the bar for market timing.
Location & tenants
- Location reads 71/100 on livability (#391 in FL) — a middle-class / working-renter tenant base. Strengths: cost of living A+, housing A+, health & safety A+; Watch: crime C-, amenities F, commute F.
- Citrus (rural): math 49% / reading 50% proficiency, ranked #44 of 73 in FL (top 60%) — families likely to look elsewhere, expect single-tenant / working-renter base with shorter leases.
- Zoned schools: Homosassa Elementary School (math 62% / reading 47%, grade C, #892 of 2,144 statewide, top 44%, 411 students, 78% FRL); Lecanto Middle School (math 49% / reading 49%, grade C-, #265 of 571 statewide, top 48%, 809 students, 55% FRL); Lecanto High School (math 46% / reading 53%, grade D, #179 of 667 statewide, top 29%, 1,630 students, 46% FRL) — zoned schools at 60% FRL track the district average.
- Market conditions: 582 active listings in the ZIP; 1 comparable units currently listed for rent nearby; 2,443 units permitted in Citrus County in 2024 (0 in 5+ unit buildings).
- This rent runs 41% of the median local income ($59k/yr) — at the standard rent-burdened threshold; future hikes will face affordability resistance.
Forward outlook
- Local home prices are declining (-3.0%/yr); year-one equity from $2k of loan paydown is wiped out by about $7k of value loss. Plan a longer hold.
- Citrus County population projected to shrink 10% by 2050 — rents likely to lag national; underwrite the cash flow, not the appreciation.
Negotiation context
- It's been on market 26 days — a 2% lower offer ($202k) is reasonable based on typical stale-listing flexibility.
Risks & watch-outs
- Climate carrying-cost: severe wind risk, 99% chance of damaging wind over 30y; extreme-heat days projected 7→25/yr by 2055 (HVAC capex compounding) — expect insurance premiums to compound above CPI over the hold.
Questions for the listing agent
- What do current leases actually rent for vs. the listed asking? Can we see a recent rent roll and the last 12 months of T-12 income?
- Is there a deadline driving the sale (1031 exchange, divorce, estate, relocation)? That informs how much negotiation room exists.
- Schools are F-rated, which usually means shorter tenancies and higher turnover. Who's the typical renter profile here, and what's been the actual vacancy rate?
- The area grade is low — what's the realistic commute time and amenity access for the typical tenant pool here? Any planned neighborhood developments (good or bad) we should know about?
- What's the average days-on-market for RENTAL listings here right now (not sales)? A rising rental-DOM trend means longer vacancies and softer asking-rent achievability than the comps imply.
- What's the recent tenant-quality profile in this submarket — average credit score on applications, eviction rate, late-payment / NSF rate, and stable-employment percentage? A property-management company in the area should have these aggregated.
- How much new for-sale + rental construction is in the pipeline within 1–3 miles? Heavy new supply typically softens prices + rents 12–24 months out; constrained supply supports both.
Investment metrics
- 1% rule
- 0.87% ✗
- Cap rate
- 6.25%
- Cash-on-cash
- -0.15%
- DSCR
- 0.99
- GRM
- 9.6
CMA / ARV
- ARV (on-the-fly)
- $232,908
- Comps found
- 12
Show comp detail 12 sales within ~0.75 mi
| Address | Dist | Beds/Ba | Sqft | Sold | Price | $/sf | Match |
|---|---|---|---|---|---|---|---|
| 6506 W Akazian Ln | 0.03mi | 3/2.0 | 1,568 (+5%) | 4mo | $209,000 | $133 | 87 |
| 6237 S Gross Ave | 0.41mi | 3/2.0 | 1,488 (-0%) | 7mo | $245,000 | $165 | 74 |
| 6705 W Park Dr | 0.24mi | 3/2.0 | 1,600 (+7%) | 4mo | $165,000 | $103 | 74 |
| 6542 W Akazian Ln | 0.06mi | 3/2.0 | 1,296 (-13%) | 7mo | $176,500 | $136 | 70 |
| 6171 W Ansel Ct | 0.32mi | 3/2.0 | 1,612 (+8%) | 13mo | $292,000 | $181 | 61 |
| 6891 S Spartan Ave | 0.46mi | 3/2.0 | 1,344 (-10%) | 4mo | $210,000 | $156 | 59 |
| 6292 W Cardinal St | 0.36mi | 3/2.0 | 1,344 (-10%) | 10mo | $219,200 | $163 | 59 |
| 6722 S Frankfurter Way | 0.33mi | 3/2.0 | 1,345 (-10%) | 14mo | $235,000 | $175 | 56 |
| 6919 S Sorrell Ave | 0.45mi | 3/2.0 | 1,680 (+12%) | 4mo | $220,000 | $131 | 55 |
| 7049 S Sonata Ave | 0.59mi | 2/3.0 (-1) | 1,396 (-6%) | 7mo | $221,000 | $158 | 47 |
| 5729 S Leopard Pt | 0.72mi | 3/2.0 | 1,296 (-13%) | 1mo | $150,000 | $116 | 43 |
| 6965 S Sorrell Ave | 0.50mi | 2/2.0 (-1) | 1,344 (-10%) | 15mo | $80,000 | $60 | 43 |
Match score weights: distance 35% · size 25% · config 20% · recency 20%. Top-matched comps best support the ARV.
Projected returns pro-forma
-3.0% appreciation · 3.0% rent growth · sell at horizon
- IRR
- -16.5%
- Equity multiple
- 0.41×
- Total profit
- $-38,238
- Equity at exit
- $34,727
- IRR
- -8.3%
- Equity multiple
- 0.48×
- Total profit
- $-33,851
- Equity at exit
- $20,138
Cash invested: $65,214 (down + closing). Projections, not guarantees.
Landlord ↔ Tenant lean methodology
- Overall (STATE)
- 87 Strongly Landlord-Friendly
- State Florida
- 87 Strongly Landlord-Friendly · R+3
- County
- — inherits STATE
- City
- — inherits STATE
ZIP-level market 34446
- Home prices YoY
- -10.4%
- Active inventory
- 582
- Price-to-rent
- 8.4×
Monthly cashflow live
- Estimated rent
- $2,027 medium interval (Pro) →
- Mortgage (P&I)
- −$1,221
- Tax est. 1.5%
- −$291 /mo · $3,494/yr
- Insurance
- −$97
- HOA
- −$0
- Vacancy / Maint / Mgmt
- −$426
- Net cashflow
- $-8
Break-even live
UW: 25.0% down · 7.5% · 30yr · 1.5% tax · 5.0% vac · 8.0% maint · 8.0% mgmt
Financing live
Cash to close
- Down payment
- $58,227
- Closing costs
- $6,987
- Reserves months
- —
- Total cash needed
- —
Loan-product check · same deal, 3 products live
Conventional
25% down · 7.5% · 30yr
- Down + closing
- —
- Monthly P&I
- —
- Monthly cashflow
- —
- DSCR
- —
- Eligible?
- —
Personal DTI + credit; lowest rate.
DSCR
20% down · 8.5% · 30yr
- Down + closing
- —
- Monthly P&I
- —
- Monthly cashflow
- —
- DSCR
- —
- Eligible?
- —
No personal income docs; deal must DSCR.
Hard money
10% down · 12.0% · 12mo
- Down + closing
- —
- Monthly P&I
- —
- Monthly cashflow
- —
- DSCR
- —
- Eligible?
- —
Short-term bridge; refi at stabilization.
Rent comps 1 comps
| Address | Beds | Baths | Sqft | Rent | $/sqft | DOM | Units | Dist |
|---|---|---|---|---|---|---|---|---|
| 117 Golfview Dr Homosassa, FL | 2.0 | 2.0 | 1507 | $2,000 | $1.33 | 21d | 1 | 1.41mi |
Listing history 8 events
-
2026-06-07status $204,900 Pending 26 DOM
-
2026-06-03days on market $204,900 Active 26 DOM
-
2026-06-02days on market $204,900 Active 25 DOM
-
2026-06-01days on market $204,900 Active 24 DOM
-
2026-05-31days on market $204,900 Active 23 DOM
-
2026-05-30days on market $204,900 Active 22 DOM
-
2026-05-08$210,000 Active
-
2026-03-11price $199,899
ⓘ Source: listings_history table (triggers on properties + properties_extension) + one-shot
backfill from property_details.listing_events for pre-trigger history.
Climate risk First Street
- Flood 4/10 Moderate FEMA zone X (unshaded) · 13% chance over 30 yrs
- Wildfire 3/10 Moderate
- Heat 10/10 Extreme 7 d/yr ≥108°F today · 25 d/yr by 30 yrs out
- Wind 9/10 Extreme 99% chance of damaging wind over 30 yrs
- Air quality 1/10 Low 0 unhealthy d/yr today · 0 by 30 yrs out
Nearby sold comps map
Loading sold comps map…
Walkable amenities ~0.75 mi
Loading nearby amenities…
Taxation est. · year 1
- Rental income
- $24,324
- − Mortgage interest
- −$13,046
- − Property taxes
- −$3,494
- − Insurance
- −$1,165
- − Repairs & maintenance
- −$1,946
- − Management
- −$1,946
- − Depreciation
- −$6,776
- Taxable loss
- −$4,048
- Est. tax savings @ 24.0%
- +$972
- After-tax cash flow
- $872/yr
For passive investors: Depreciation is non-cash, so a rental often shows a tax loss while cash-flowing — sheltering income. Rental losses are passive: they offset passive income freely, and up to $25,000/yr can offset ordinary (W-2) income if you actively participate and your MAGI is under $100k (phasing out to $0 by $150k); unused losses carry forward. On sale, claimed depreciation is recaptured at up to 25%, and gains may owe capital-gains tax (a 1031 exchange can defer both). Figures are a year-1 estimate at your 24.0% rate — not tax advice; consult a CPA.
Condition & rehab AI · 12 photos
This move-in ready manufactured home offers a good condition with modern updates and a spacious floor plan. It is well-suited for buyers seeking a low-maintenance living space with privacy and flexibility.
Value-add opportunities
- Resale Paint exterior siding — Enhances curb appeal and can increase home value
- Resale Install new front door — Improves entryway and can increase home value
- Resale Add landscaping around the house — Enhances curb appeal and can increase home value
- Resale Install new window treatments — Enhances curb appeal and can increase home value
Renovation cost estimate screening
Value-add ROI direction
- Resale Paint exterior siding — Enhances curb appeal and can increase home value ↑
- Resale Install new front door — Improves entryway and can increase home value ↑
- Resale Add landscaping around the house — Enhances curb appeal and can increase home value ↑
- Resale Install new window treatments — Enhances curb appeal and can increase home value ↑
ⓘ Cost ranges are severity-bucket heuristics (US national rule-of-thumb). Get contractor quotes + a written scope before underwriting a rehab budget.
Schools (NCES district)
- District
- Citrus
- NCES district ID
- 1200270
- Math proficiency
- 49% ▼ -10.00%
- Reading proficiency
- 50% ▼ -6.00%
- Median HH income
- $38,618
- Composite
- 41.28/100
- National rank
- #3519
- State rank
- #44 of 73 in FL
Livability — Homosassa Springs
- Score
- 71/100
- State rank
- #391
- US rank
- #6877
Category grades
Schools grade is shown separately in the Schools card above.
Census & demographics
- Census place
- Homosassa Springs, FL
- County
- Citrus County · 111,314 people
- Metro
- Homosassa Springs, FL
- Population (ZIP)
- 19,102
- Household income
- $58,802
- Rent vs Own
- Severe rent burden
- 121.0
Population outlook (Citrus County) Hauer SSP2
- Today (2025)
- 138,622 people
- By 2030
- 136,886 · -1.3%
- By 2040
- 132,009 · -4.8%
- By 2050
- 125,196 · -9.7%
- By 2075
- 108,570 · -21.7%
- By 2100
- 84,454 · -39.1%
Race, ethnicity, and origin ACS 2023
- Neighborhood character
- Predominantly White (87%)
- Race & ethnicity
- White 87% Two or more races 8% Hispanic / Latino 6%
- Hispanic origin (detail)
- Mexican 2% Puerto Rican 3%
- Common ancestry
- Romanian 4% Lithuanian 4% Slovak 3%
- Foreign-born
- 5% · Canada
- Languages at home
- 95% English-only · Spanish 4%
Political lean MEDSL · Citrus
- 2024 margin
- Solid R (+45.9) · D 26.8% · R 72.6%
- 2008→2024 swing
- -29.8pp toward R · 2008: -16.1pp · 2024: -45.9pp
- All cycles
- 2024: R+45.9 2020: R+41.0 2016: R+39.7 2012: R+21.9 2008: R+16.1
Not yet ingested
- Civics
- —
Market trends
- HPI YoY
- ▼ -32.11%
- Current HPI
- 277.2576
- Rent YoY
- —
- Metro
- Homosassa Springs, FL
- State GDP YoY
- ▲ 3.28%
- F500 in state
- 36
Industry mix (Fortune 500 HQ in FL)
| Industry | F500 HQs | Revenue |
|---|---|---|
| Industrial Technology | 2 | $29B |
|
||
| Insurance | 2 | $17B |
|
||
| Retail | 1 | $60B |
|
||
| Technology Distribution | 1 | $58B |
|
||
| Homebuilding | 1 | $35B |
|
||
| Technology Manufacturing | 1 | $35B |
|
||
Price history
+5.1% since first listed2 events — show timeline
- 2026-05-08 Listed $210,000 RACC
- 2026-03-11 Price Changed $199,899 RACC
Cash-flow waterfall
monthlySold comps — $/sqft
last 12 mo · ≤1 miLoading sold comps…