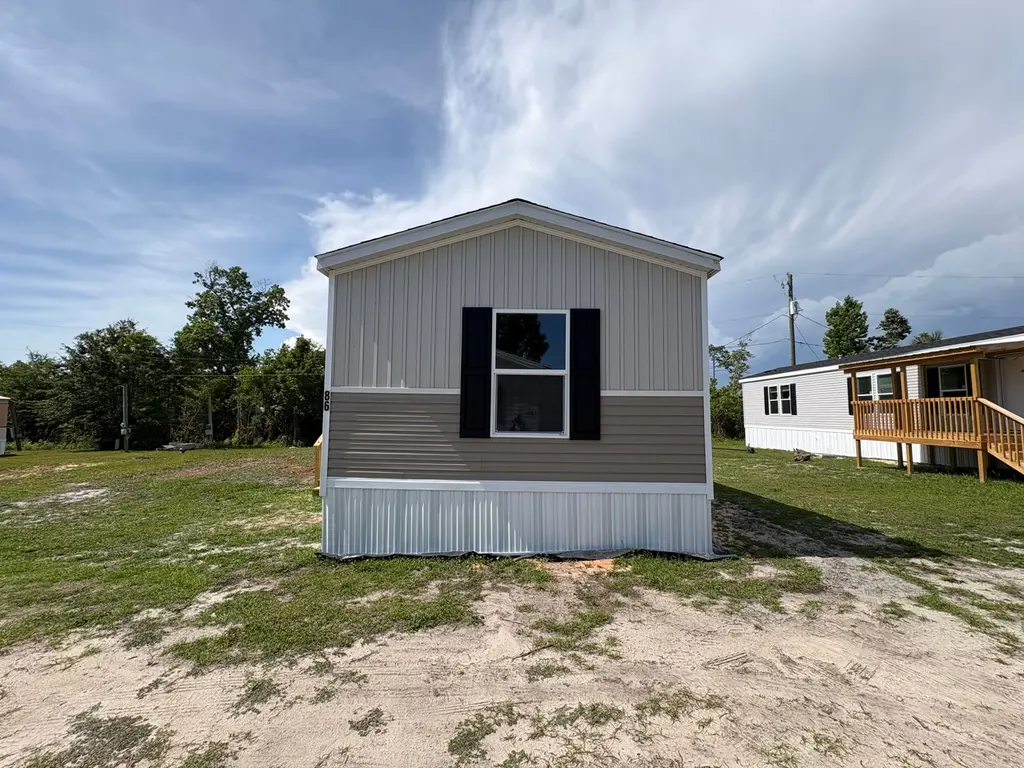
1128 S Gay Ave #86 · Callaway, FL
Flood risk 2/10 · Minimal
- FEMA flood zone
- X (unshaded)
- Chance of flooding over 30 yrs
- 0.05%
- Est. flood insurance / yr
- $507 – $1,088
Fire risk 1/10 · Minimal
- Est. fire insurance / yr
- $947 – $1,759
Heat risk 10/10 · Severe
- Hot days now (above 104°F)
- 7 days/yr
- Hot days in 30 yrs
- 21 days/yr
Wind risk 9/10 · Severe
- Chance of severe wind over 30 yrs
- 99.0%
Air-quality risk 1/10 · Minimal
- Unhealthy air days now
- 0 days/yr
- Unhealthy air days in 30 yrs
- 0 days/yr
Risk factors via First Street. Map © Google.
Why this score? — see what drove the C grade
The composite is a weighted blend of 9 inputs, each scored 0–100. Each bar is that input's sub-score; the figure is the points it added to the 100-point composite (weight × sub-score).
- Cash flow +17.4/30.0
- 1% rule +10.0/10.0
- ARV discount +7.5/15.0
- DSCR +5.4/10.0
- Condition / age +5.0/5.0
- Schools +4.3/10.0
- Livability +3.2/5.0
- Rent growth +2.8/5.0
- Appreciation +0.0/10.0
$94,995
🖨 Deal sheet 📄 Offer letter ✓ Due diligence
Listing remarks
Be the very first to call this stunning, brand new 2026 Clayton Mariner home yours! Offering 1,216 square feet of beautifully designed living space, this 3-bedroom, 2-bathroom home is the perfect blend of modern style and everyday comfort, located in the pet-friendly Countryside Estates community in Panama City, FL (breed restrictions apply). The kitchen is truly the heart of this home, featuring a huge island that's perfect for meal prep, entertaining, or casual family gatherings, along with sleek stainless steel appliances that bring a fresh, contemporary feel. The spacious master suite includes a roomy walk-in closet, while a stylish accent wall in the living room adds the perfect design
Key facts
- Walk-in closet
- Huge island
- Built 2026
Tags
Property features AI
Finance
- Other: Address: 1128 S Gay Ave #86, Panama City, FL 32404; Status: Active
- Financial info: List price $94,995
- HOA & community: Association fee $616
Exterior
- Utilities: Electric heating (heat pump); Central air conditioning
- Home design: Spec new construction (Clayton Mariner plan)
- Construction: Living area 1216
- Exterior features: Shake roof
Interior
- Kitchen: Dishwasher; Refrigerator
- Bedrooms: 3 bedrooms
- Bathrooms: 2 bathrooms
- Heating & cooling: Electric heating with heat pump; Central air conditioning
- Interior features: Dishwasher; Refrigerator
Neighborhood map
What this means for you Summary
Snapshot
- This is a 3-bed/2.0-bath single-family listed at $95k. Condition is rated excellent.
Deal economics
- At list price, monthly cash flow is $71 ($852/yr) — positive.
- The deal already cash-flows at list — no discount required.
- Meets the 1% rule at list price ($2k rent vs $95k).
- Cap rate 7.2% vs local median 5.1% in Callaway — top-decile yield for the area; either an underpriced asset or a hidden risk that comps aren't pricing in. Stress-test before assuming the spread holds.
Location & tenants
- Location reads 64/100 on livability (#690 in FL) — a middle-class / working-renter tenant base. Strengths: cost of living A+, housing A+; Watch: employment D+, schools F, amenities F.
- Bay (suburban): math 51% / reading 51% proficiency, ranked #29 of 73 in FL (top 40%) — acceptable for families but not a draw, mixed tenant base, ~2y average lease.
- Market conditions: Rents rising (+1.1%/yr); 969 active listings in the ZIP; 17 comparable units currently listed for rent nearby; rentals at typical pace (median 21d on market — plan ~3-4 weeks tenant-placement turnaround); 2,473 units permitted in Bay County in 2024 (559 in 5+ unit buildings).
Forward outlook
- Local home prices are declining (-3.0%/yr); year-one equity from $657 of loan paydown is wiped out by about $3k of value loss. Plan a longer hold.
- Bay County population projected at +24% by 2050 — long-run rental-demand tailwind backs the buy-and-hold thesis.
Negotiation context
- Only 14 days on market — expect competitive offers; lowballing is unlikely to land.
Risks & watch-outs
- Watch-outs: HOA is 36% of rent.
- Climate carrying-cost: severe wind risk, 99% chance of damaging wind over 30y; extreme-heat days projected 7→21/yr by 2055 (HVAC capex compounding) — expect insurance premiums to compound above CPI over the hold.
Questions for the listing agent
- What does the HOA fee cover, when was the last increase, and are there any pending special assessments or reserve-fund shortfalls?
- Is there a deadline driving the sale (1031 exchange, divorce, estate, relocation)? That informs how much negotiation room exists.
- Schools are F-rated, which usually means shorter tenancies and higher turnover. Who's the typical renter profile here, and what's been the actual vacancy rate?
- What's the average days-on-market for RENTAL listings here right now (not sales)? A rising rental-DOM trend means longer vacancies and softer asking-rent achievability than the comps imply.
- What's the recent tenant-quality profile in this submarket — average credit score on applications, eviction rate, late-payment / NSF rate, and stable-employment percentage? A property-management company in the area should have these aggregated.
- How much new for-sale + rental construction is in the pipeline within 1–3 miles? Heavy new supply typically softens prices + rents 12–24 months out; constrained supply supports both.
Investment metrics
- 1% rule
- 1.79% ✓
- Cap rate
- 7.19%
- Cash-on-cash
- 3.20%
- DSCR
- 1.14
- GRM
- 4.7
CMA / ARV
- ARV (on-the-fly)
- $238,336
- Comps found
- 6
Show comp detail 6 sales within ~0.75 mi
| Address | Dist | Beds/Ba | Sqft | Sold | Price | $/sf | Match |
|---|---|---|---|---|---|---|---|
| 1215 Tammy Ln | 0.52mi | 3/2.0 | 1,278 (+5%) | 9mo | $249,900 | $196 | 60 |
| 5318 Lake Dr | 0.74mi | 3/2.0 | 1,253 (+3%) | 17mo | $290,500 | $232 | 47 |
| 6224 Lance St | 0.67mi | 3/2.0 | 1,308 (+8%) | 12mo | $235,000 | $180 | 46 |
| 5316 Lake Dr | 0.74mi | 3/2.0 | 1,253 (+3%) | 17mo | $290,000 | $231 | 46 |
| 1201 S Kimbrel | 0.32mi | 3/2.0 | 1,396 (+15%) | 23mo | $265,000 | $190 | 41 |
| 705 S Camellia Ave | 0.70mi | 3/2.0 | 1,278 (+5%) | 24mo | $190,000 | $149 | 39 |
Match score weights: distance 35% · size 25% · config 20% · recency 20%. Top-matched comps best support the ARV.
Projected returns pro-forma
-3.0% appreciation · 1.12% rent growth · sell at horizon
- IRR
- -14.8%
- Equity multiple
- 0.49×
- Total profit
- $-13,626
- Equity at exit
- $14,164
- IRR
- -12.6%
- Equity multiple
- 0.37×
- Total profit
- $-16,880
- Equity at exit
- $8,213
Cash invested: $26,599 (down + closing). Projections, not guarantees.
Landlord ↔ Tenant lean methodology
- Overall (STATE)
- 87 Strongly Landlord-Friendly
- State Florida
- 87 Strongly Landlord-Friendly · R+3
- County
- — inherits STATE
- City
- — inherits STATE
ZIP-level market 32404
- Home prices YoY
- -16.1%
- Rents YoY
- 1.1%
- Active inventory
- 969
- Price-to-rent
- 4.7×
Monthly cashflow live
- Estimated rent
- $1,701 high interval (Pro) →
- Mortgage (P&I)
- −$498
- Tax est. 1.5%
- −$119 /mo · $1,425/yr
- Insurance
- −$40
- HOA
- −$616
- Vacancy / Maint / Mgmt
- −$357
- Net cashflow
- $71
Break-even live
UW: 25.0% down · 7.5% · 30yr · 1.5% tax · 5.0% vac · 8.0% maint · 8.0% mgmt
Financing live
Cash to close
- Down payment
- $23,749
- Closing costs
- $2,850
- Reserves months
- —
- Total cash needed
- —
Loan-product check · same deal, 3 products live
Conventional
25% down · 7.5% · 30yr
- Down + closing
- —
- Monthly P&I
- —
- Monthly cashflow
- —
- DSCR
- —
- Eligible?
- —
Personal DTI + credit; lowest rate.
DSCR
20% down · 8.5% · 30yr
- Down + closing
- —
- Monthly P&I
- —
- Monthly cashflow
- —
- DSCR
- —
- Eligible?
- —
No personal income docs; deal must DSCR.
Hard money
10% down · 12.0% · 12mo
- Down + closing
- —
- Monthly P&I
- —
- Monthly cashflow
- —
- DSCR
- —
- Eligible?
- —
Short-term bridge; refi at stabilization.
Rent comps 17 comps
| Address | Beds | Baths | Sqft | Rent | $/sqft | DOM | Units | Dist |
|---|---|---|---|---|---|---|---|---|
| 1128 S Gay Ave Lot 56 Panama City, FL | 3.0 | 1.5 | 1216 | $35,000 | $28.78 | 21d | 1 | 0.03mi |
| 1128 S Gay Ave Lot V Panama City, FL | 3.0 | 2.0 | 1152 | $30,000 | $26.04 | 21d | 1 | 0.03mi |
| 1128 S Gay Ave Lot 86 Panama City, FL | 3.0 | 2.0 | 1216 | $94,995 | $78.12 | 21d | 1 | 0.03mi |
| 1128 S Gay Ave Lot N Panama City, FL | 3.0 | 2.0 | 924 | $40,000 | $43.29 | 21d | 1 | 0.03mi |
| 5813 Hickory St Panama City, FL | 3.0 | 2.0 | 1200 | $1,950 | $1.62 | 21d | 1 | 0.93mi |
| 509 Phillips Ct Panama City, FL | 3.0 | 2.0 | 1411 | $1,700 | $1.20 | 13d | 1 | 0.94mi |
| 719 S Berthe Ave Unit 8 Panama City, FL | 2.0 | 1.0 | 910 | $1,000 | $1.10 | 21d | 1 | 1.03mi |
| 322 S Burkett Dr Panama City, FL | 1.0–2.0 | 1.0–2.0 | 600 | $1,519 | $2.53 | 13d | 13 | 1.11mi |
| 543 N 9th St Unit 543 Panama City, FL | 2.0 | 1.0 | 850 | $1,195 | $1.41 | 13d | 1 | 1.15mi |
| 4828 Grimes St #3 Panama City, FL | 2.0 | 1.0 | 850 | $1,150 | $1.35 | 21d | 1 | 1.17mi |
| 6600 Oakshore Dr Panama City, FL | 1.0–3.0 | 1.0–2.0 | 1002 | $2,325 | $2.32 | 13d | 57 | 1.28mi |
| 6328 Olokee St Panama City, FL | 3.0 | 2.0 | 1131 | $1,850 | $1.64 | 13d | 1 | 1.29mi |
| 4837 S Lakewood Dr Panama City, FL | 2.0 | 1.5 | 1116 | $1,500 | $1.34 | 21d | 1 | 1.31mi |
| 114 S Kimbrel Ave Panama City, FL | 3.0 | 2.0 | 1400 | $1,850 | $1.32 | 21d | 1 | 1.33mi |
| 4480 E Highway 98 Panama City, FL | 2.0 | 1.0 | 972 | $1,250 | $1.29 | 21d | 1 | 1.43mi |
| 4480 East Highway 98 Unit 1 Panama City, FL | 2.0 | 1.5 | 972 | $1,250 | $1.29 | 21d | 1 | 1.43mi |
| 5805 Cherry St Panama City, FL | 2.0 | 1.0 | 1025 | $1,200 | $1.17 | 13d | 1 | 1.45mi |
HOA detail
- Monthly dues
- $616 · $7,392/yr
Listing history 12 events
-
2026-06-19days on market $94,995 Active 14 DOM
-
2026-06-18days on market $94,995 Active 13 DOM
-
2026-06-17days on market $94,995 Active 12 DOM
-
2026-06-16days on market $94,995 Active 11 DOM
-
2026-06-15days on market $94,995 Active 10 DOM
-
2026-06-14days on market $94,995 Active 8 DOM
-
2026-06-13days on market $94,995 Active 7 DOM
-
2026-06-10days on market $94,995 Active 5 DOM
-
2026-06-09days on market $94,995 Active 4 DOM
-
2026-06-08days on market $94,995 Active 3 DOM
-
2026-06-07remarks 699-char remark
-
2026-06-07$94,995 Active 2 DOM
ⓘ Source: listings_history table (triggers on properties + properties_extension) + one-shot
backfill from property_details.listing_events for pre-trigger history.
Climate risk First Street
- Flood 2/10 Low FEMA zone X (unshaded) · 5% chance over 30 yrs
- Wildfire 1/10 Low
- Heat 10/10 Extreme 7 d/yr ≥104°F today · 21 d/yr by 30 yrs out
- Wind 9/10 Extreme 99% chance of damaging wind over 30 yrs
- Air quality 1/10 Low 0 unhealthy d/yr today · 0 by 30 yrs out
Nearby sold comps map
Loading sold comps map…
Walkable amenities ~0.75 mi
Loading nearby amenities…
Taxation est. · year 1
- Rental income
- $20,407
- − Mortgage interest
- −$5,321
- − Property taxes
- −$1,425
- − Insurance
- −$475
- − Repairs & maintenance
- −$1,633
- − Management
- −$1,633
- − HOA
- −$7,392
- − Depreciation
- −$2,763
- Taxable loss
- −$235
- Est. tax savings @ 24.0%
- +$56
- After-tax cash flow
- $908/yr
For passive investors: Depreciation is non-cash, so a rental often shows a tax loss while cash-flowing — sheltering income. Rental losses are passive: they offset passive income freely, and up to $25,000/yr can offset ordinary (W-2) income if you actively participate and your MAGI is under $100k (phasing out to $0 by $150k); unused losses carry forward. On sale, claimed depreciation is recaptured at up to 25%, and gains may owe capital-gains tax (a 1031 exchange can defer both). Figures are a year-1 estimate at your 24.0% rate — not tax advice; consult a CPA.
Condition & rehab AI · 13 photos
This brand-new 2026 Clayton Mariner home is in excellent condition with no visible repairs or maintenance needed. It offers a stunning blend of modern style and everyday comfort, making it an ideal investment property.
Value-add opportunities
- Both Painting the exterior and interior walls — Fresh paint can enhance the curb appeal and interior aesthetics, making the home more attractive to potential buyers and renters.
- Both Landscaping improvements — Enhancing the landscaping can improve the overall curb appeal and make the home more inviting.
Renovation cost estimate screening
Value-add ROI direction
- Both Painting the exterior and interior walls — Fresh paint can enhance the curb appeal and interior aesthetics, making the home more attractive to potential buyers and renters. ↑
- Both Landscaping improvements — Enhancing the landscaping can improve the overall curb appeal and make the home more inviting. ↑
ⓘ Cost ranges are severity-bucket heuristics (US national rule-of-thumb). Get contractor quotes + a written scope before underwriting a rehab budget.
Schools (NCES district)
- District
- Bay
- NCES district ID
- 1200090
- Math proficiency
- 51% ▼ -8.00%
- Reading proficiency
- 51% ▼ -7.00%
- Median HH income
- $47,740
- Composite
- 43.41/100
- National rank
- #3014
- State rank
- #29 of 73 in FL
Livability — Callaway
- Score
- 64/100
- State rank
- #690
- US rank
- #14384
Category grades
Schools grade is shown separately in the Schools card above.
Census & demographics
- Census place
- Callaway, FL
- County
- Bay County · 163,593 people
- City population
- 91,445
- Metro
- Panama City, FL
- Population (ZIP)
- 42,514
- Household income
- $74,708
- Rent vs Own
- Severe rent burden
- 1218.0
Population outlook (Bay County) Hauer SSP2
- Today (2025)
- 206,264 people
- By 2030
- 217,740 · +5.6%
- By 2040
- 238,738 · +15.7%
- By 2050
- 255,545 · +23.9%
- By 2075
- 288,295 · +39.8%
- By 2100
- 288,638 · +39.9%
Race, ethnicity, and origin ACS 2023
- Neighborhood character
- Predominantly White (69%)
- Race & ethnicity
- White 69% Black 12% Two or more races 10% Hispanic / Latino 9% Asian 3%
- Hispanic origin (detail)
- Mexican 2% Puerto Rican 3%
- Common ancestry
- Lithuanian 3% Slovak 2% Italian 2%
- Foreign-born
- 7% · Canada, Vietnam, Mexico
- Languages at home
- 90% English-only · Spanish 6% Vietnamese 1% Other Asian/Pacific 1%
Political lean MEDSL · Bay
- 2024 margin
- Solid R (+47.4) · D 25.8% · R 73.1% · Other 1.1%
- 2008→2024 swing
- -6.6pp toward R · 2008: -40.7pp · 2024: -47.4pp
- All cycles
- 2024: R+47.4 2020: R+43.5 2016: R+46.3 2012: R+43.6 2008: R+40.7
Not yet ingested
- Civics
- —
Market trends
- HPI YoY
- ▼ -50.59%
- Current HPI
- 263.7178
- Rent YoY
- ▲ 1.12%
- Metro
- Panama City, FL
- State GDP YoY
- ▲ 3.28%
- F500 in state
- 36
Industry mix (Fortune 500 HQ in FL)
| Industry | F500 HQs | Revenue |
|---|---|---|
| Industrial Technology | 2 | $29B |
|
||
| Insurance | 2 | $17B |
|
||
| Retail | 1 | $60B |
|
||
| Technology Distribution | 1 | $58B |
|
||
| Homebuilding | 1 | $35B |
|
||
| Technology Manufacturing | 1 | $35B |
|
||
Cash-flow waterfall
monthlySold comps — $/sqft
last 12 mo · ≤1 miLoading sold comps…