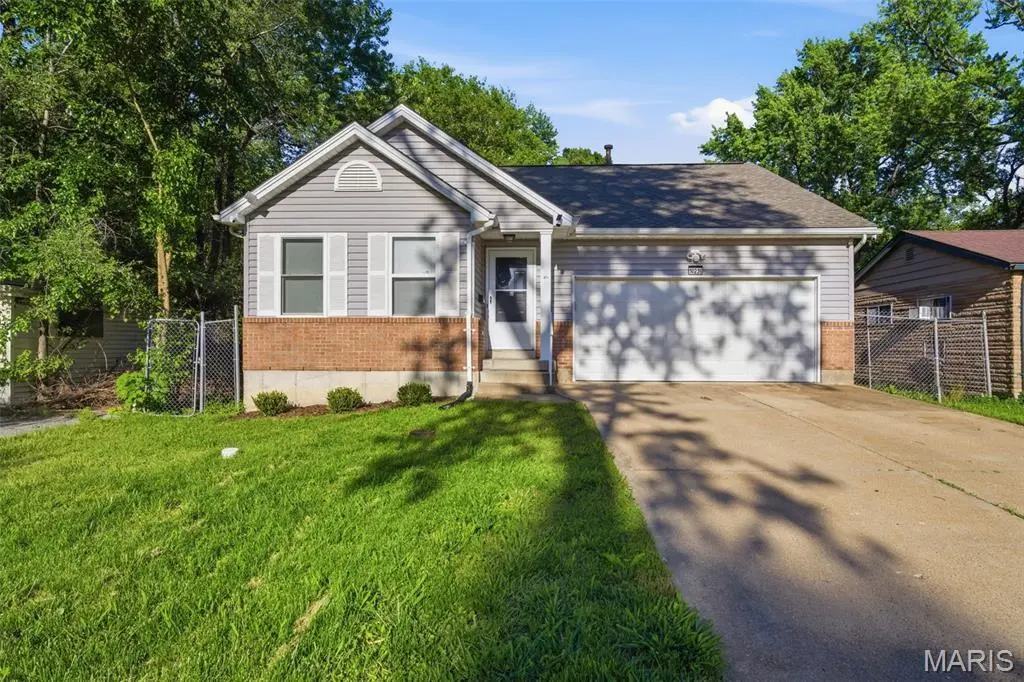
10236 Earl Dr · Castle Point, MO
Flood risk 1/10 · Minimal
- FEMA flood zone
- X (unshaded)
- Chance of flooding over 30 yrs
- 0.0%
- Est. flood insurance / yr
- $473 – $860
Fire risk 1/10 · Minimal
- Est. fire insurance / yr
- $1,054 – $1,958
Heat risk 5/10 · Moderate
- Hot days now (above 107°F)
- 7 days/yr
- Hot days in 30 yrs
- 21 days/yr
Wind risk 2/10 · Minimal
- Chance of severe wind over 30 yrs
- 1.0%
Air-quality risk 4/10 · Minor
- Unhealthy air days now
- 4 days/yr
- Unhealthy air days in 30 yrs
- 5 days/yr
Risk factors via First Street. Map © Google.
Why this score? — see what drove the D- grade
The composite is a weighted blend of 9 inputs, each scored 0–100. Each bar is that input's sub-score; the figure is the points it added to the 100-point composite (weight × sub-score).
- Cash flow +11.4/30.0
- Appreciation +6.9/10.0
- Rent growth +3.7/5.0
- DSCR +3.3/10.0
- Livability +3.2/5.0
- 1% rule +2.7/10.0
- Condition / age +2.5/5.0
- ARV discount +1.9/15.0
- Schools +0.4/10.0
$170,000
🖨 Deal sheet (PDF) 📄 Offer letter ✓ Due diligence
Listing remarks MLS
Investor / Sweat-Equity Opportunity – 10236 Earl Dr, St. Louis, MO 63136. Great opportunity for rehabbers, buy-and-hold investors, or owner-occupants ready to earn sweat equity. This 3-bedroom, 2.5-bath newer build for the area, features a two-car garage and a partially finished basement, offering plenty of space and upside potential. Estimated rent is around $1,300/month once improved. This is a light rehab project — most of the work is cosmetic and cleaning, not a full gut renovation. Property is being sold strictly AS-IS – seller will make no repairs or offer any warranties. Buyer should verify all systems and plan for updates as needed. Perfect for investors seeking a quick-turn rental with strong cash flow or a simple flip, as well as owner-occupants looking to build equity fast. Opportunities like this — newer construction, garage, space, and minimal repairs — don’t come along often. Schedule your showing today!
Key facts
- 6,499 sq ft lot
- 2 garage spots
- Built 2001
Property features AI
Finance
- Other: Residential property type; Above-grade finished area verified by public records; Below-grade finished area reported by appraiser
- Financial info: Lease not considered
Exterior
- Parking: 2-car garage
- Utilities: Public water; Ameren electric; Public sewer; Electricity connected; Natural gas connected; Sewer connected
- Home design: Single-family residence; One level
- Construction: Vinyl siding; Shingle roof; Partially finished basement (has basement)
- Exterior features: Back yard fencing; Front yard; Landscaped yard; Near public transit
Interior
- Kitchen: Stainless steel appliances; Microwave; Exhaust fan
- Bedrooms: 3 bedrooms on the main level
- Flooring: Vinyl flooring
- Bathrooms: 3 full bathrooms (2 on main level, 1 on lower level)
- Heating & cooling: Natural gas heating; Central air conditioning
- Interior features: Stainless steel appliances; Exhaust fan; Microwave
Neighborhood map
What this means for you Summary
Snapshot
- This is a 3-bed/2.0-bath single-family listed at $170k.
Deal economics
- At list price, monthly cash flow is $-59 ($-708/yr) — negative.
- To cash-flow at today's rent, offer at most $160k (6.1% below list).
- To meet the 1% rule (rent ≥ 1% of price), the offer needs to be $130k (23.5% below list).
- Recommended offer: $130k (23.5% below list) — sets the bar for 1% rule.
- Cap rate 5.9% vs local median 12.9% in Castle Point — below-typical yield; the buyer is paying a premium for something (appreciation thesis, condition, location) that the cap rate doesn't capture.
Location & tenants
- Location reads 64/100 on livability (#313 in MO) — a middle-class / working-renter tenant base. Strengths: cost of living A+, crime B; Watch: amenities F, commute F, employment F.
- Riverview Gardens (suburban): math 2% / reading 9% proficiency, ranked #324 of 324 in MO (top 100%) — low school quality limits family demand, transient renter base, plan for 1-2y turnover; 90% free/reduced lunch — lower-income household profile, screen leases tightly.
- Zoned schools: Lewis And Clark Elem. (math 2% / reading 2%, grade F, #1,099 of 1,115 statewide, top 100%, 145 students, 98% FRL); Riverview Gardens Sr. High (math 2% / reading 18%, grade F, #501 of 521 statewide, top 97%, 1,331 students, 100% FRL).
- Market conditions: Rents rising fast (+5.0%/yr); 376 active listings in the ZIP; 40 comparable units currently listed for rent nearby; rentals at typical pace (median 24d on market — plan ~3-4 weeks tenant-placement turnaround); lower-income renter base — watch delinquency; 920 units permitted in St. Louis County in 2024 (250 in 5+ unit buildings).
- This rent runs 38% of the median local income ($41k/yr) — at the standard rent-burdened threshold; future hikes will face affordability resistance.
Forward outlook
- In year one you build about $8k of equity ($1k loan paydown + $6k appreciation (3.8% local appreciation)).
- At projected returns (3.8% appreciation + 5.0% rent growth), your $48k cash investment doubles in ~6 years — after that, you're playing with house money.
- By year 5, paydown + projected appreciation supports a ~$33k cash-out refi (75% LTV) — recoverable capital for the next deal without selling this one.
Negotiation context
- It's been on market 30 days — a 2% lower offer ($167k) is reasonable based on typical stale-listing flexibility.
- 3 sale attempts since 4y ago with the ask held roughly flat each time — persistent listings suggest the price (not the market) is what's stuck; bring a comps-based counter.
- Current owner paid $95k; list at $170k implies a 79% gain — meaningful room to come down on a strong offer.
Risks & watch-outs
- Climate carrying-cost: extreme-heat days projected 7→21/yr by 2055 (HVAC capex compounding) — expect insurance premiums to compound above CPI over the hold.
Questions for the listing agent
- What do current leases actually rent for vs. the listed asking? Can we see a recent rent roll and the last 12 months of T-12 income?
- Is there a deadline driving the sale (1031 exchange, divorce, estate, relocation)? That informs how much negotiation room exists.
- Schools are F-rated, which usually means shorter tenancies and higher turnover. Who's the typical renter profile here, and what's been the actual vacancy rate?
- The area grade is low — what's the realistic commute time and amenity access for the typical tenant pool here? Any planned neighborhood developments (good or bad) we should know about?
- What's the average days-on-market for RENTAL listings here right now (not sales)? A rising rental-DOM trend means longer vacancies and softer asking-rent achievability than the comps imply.
- What's the recent tenant-quality profile in this submarket — average credit score on applications, eviction rate, late-payment / NSF rate, and stable-employment percentage? A property-management company in the area should have these aggregated.
- How much new for-sale + rental construction is in the pipeline within 1–3 miles? Heavy new supply typically softens prices + rents 12–24 months out; constrained supply supports both.
Investment metrics
- 1% rule
- 0.77% ✗
- Cap rate
- 5.88%
- Cash-on-cash
- -1.49%
- DSCR
- 0.93
- GRM
- 10.9
CMA / ARV
- ARV (on-the-fly)
- $151,167
- Comps found
- 12
Show comp detail 12 sales within ~0.75 mi
| Address | Dist | Beds/Ba | Sqft | Sold | Price | $/sf | Match |
|---|---|---|---|---|---|---|---|
| 10217 Viscount Dr | 0.35mi | 3/2.0 | 1,205 (-2%) | 2mo | $149,000 | $124 | 79 |
| 10139 Edgefield Dr | 0.32mi | 3/2.0 | 1,140 (-7%) | 0mo | $119,900 | $105 | 73 |
| 10006 Castle Dr | 0.41mi | 3/1.0 | 1,178 (-4%) | 5mo | $35,900 | $30 | 66 |
| 10231 Monarch Dr | 0.26mi | 3/2.0 | 1,073 (-13%) | 1mo | $189,999 | $177 | 66 |
| 2360 Chambers Rd | 0.40mi | 2/1.0 (-1) | 1,168 (-5%) | 1mo | $44,900 | $38 | 63 |
| 1443 Attica Dr | 0.58mi | 3/1.0 | 1,302 (+6%) | 3mo | $159,600 | $123 | 57 |
| 9922 Lanier Dr | 0.59mi | 3/1.0 | 1,159 (-6%) | 5mo | $85,000 | $73 | 55 |
| 2442 Gardner Dr | 0.55mi | 3/2.0 | 1,054 (-14%) | 2mo | $59,900 | $57 | 49 |
| 10421 Canfield Dr | 0.52mi | 3/1.5 | 1,073 (-13%) | 5mo | $154,900 | $144 | 49 |
| 10539 Monarch Dr | 0.54mi | 4/2.5 (+1) | 1,073 (-13%) | 3mo | $135,000 | $126 | 44 |
| 2414 Castle Dr | 0.60mi | 3/1.5 | 1,054 (-14%) | 4mo | $130,000 | $123 | 43 |
| 10201 Surf Dr | 0.70mi | 3/2.0 | 1,074 (-13%) | 5mo | $114,900 | $107 | 42 |
Match score weights: distance 35% · size 25% · config 20% · recency 20%. Top-matched comps best support the ARV.
Projected returns pro-forma
3.79% appreciation · 4.97% rent growth · sell at horizon
- IRR
- 9.2%
- Equity multiple
- 1.56×
- Total profit
- $26,532
- Equity at exit
- $84,114
- IRR
- 12.0%
- Equity multiple
- 3.00×
- Total profit
- $95,225
- Equity at exit
- $135,943
Cash invested: $47,600 (down + closing). Projections, not guarantees.
Landlord ↔ Tenant lean methodology
- Overall (STATE)
- 81 Strongly Landlord-Friendly
- State Missouri
- 81 Strongly Landlord-Friendly · R+10
- County
- — inherits STATE
- City
- — inherits STATE
ZIP-level market 63136
- Home prices YoY
- 0.9%
- Rents YoY
- 5.0%
- Active inventory
- 376
- Price-to-rent
- 10.9×
Monthly cashflow live
- Estimated rent
- $1,301 high interval (Pro) →
- Mortgage (P&I)
- −$891
- Tax from tax record
- −$124 /mo · $1,490/yr
- Insurance
- −$71
- HOA
- −$0
- Vacancy / Maint / Mgmt
- −$273
- Net cashflow
- $-59
Break-even live
Sensitivity live
| Price | -10% $37 | -5% $-11 | +0% $-59 | +5% $-107 | +10% $-155 |
|---|---|---|---|---|---|
| Rent | -10% $-162 | -5% $-110 | +0% $-59 | +5% $-8 | +10% $44 |
| Rate | -1.0pp $27 | -0.5pp $-16 | base $-59 | +0.5pp $-103 | +1.0pp $-148 |
UW: 25.0% down · 7.5% · 30yr · 1.5% tax · 5.0% vac · 8.0% maint · 8.0% mgmt
Financing live
Cash to close
- Down payment
- $42,500
- Closing costs
- $5,100
- Reserves months
- —
- Total cash needed
- —
Loan-product check · same deal, 3 products live
Conventional
25% down · 7.5% · 30yr
- Down + closing
- —
- Monthly P&I
- —
- Monthly cashflow
- —
- DSCR
- —
- Eligible?
- —
Personal DTI + credit; lowest rate.
DSCR
20% down · 8.5% · 30yr
- Down + closing
- —
- Monthly P&I
- —
- Monthly cashflow
- —
- DSCR
- —
- Eligible?
- —
No personal income docs; deal must DSCR.
Hard money
10% down · 12.0% · 12mo
- Down + closing
- —
- Monthly P&I
- —
- Monthly cashflow
- —
- DSCR
- —
- Eligible?
- —
Short-term bridge; refi at stabilization.
Rent comps 40 comps
| Address | Beds | Baths | Sqft | Rent | $/sqft | DOM | Units | Dist |
|---|---|---|---|---|---|---|---|---|
| 10348 Earl Dr Saint Louis, MO | 3.0 | 1.0 | 770 | $1,325 | $1.72 | 0d | 1 | 0.15mi |
| 10404 Earl Dr Saint Louis, MO | 2.0 | 1.0 | 770 | $1,100 | $1.43 | 5d | 1 | 0.19mi |
| 10365 Lord Dr Saint Louis, MO | 3.0 | 1.0 | 864 | $1,075 | $1.24 | 3d | 1 | 0.19mi |
| 10139 Royal Dr Saint Louis, MO | 2.0 | 1.0 | 1016 | $900 | $0.89 | 45d | 1 | 0.19mi |
| 10113 Duke Dr Saint Louis, MO | 3.0 | 1.0 | 770 | $1,325 | $1.72 | 45d | 1 | 0.22mi |
| 10409 Count Dr Saint Louis, MO | 3.0 | 1.0 | 912 | $1,100 | $1.21 | 23d | 1 | 0.25mi |
| 10421 Prince Dr Saint Louis, MO | 3.0 | 2.0 | 1023 | $1,275 | $1.25 | 25d | 1 | 0.26mi |
| 10112 Count Dr Saint Louis, MO | 2.0 | 1.0 | 792 | $1,000 | $1.26 | 9d | 1 | 0.26mi |
| 10322 Monarch Dr Saint Louis, MO | 3.0 | 2.0 | 1073 | $1,728 | $1.61 | 25d | 1 | 0.27mi |
| 10113 Count Dr Saint Louis, MO | 2.0 | 1.0 | 882 | $775 | $0.88 | 45d | 1 | 0.27mi |
| 10441 Prince Dr Saint Louis, MO | 4.0 | 1.5 | 1380 | $1,380 | $1.00 | 45d | 1 | 0.30mi |
| 10501 Duke Dr Saint Louis, MO | 2.0 | 1.0 | 1140 | $1,090 | $0.96 | 45d | 1 | 0.32mi |
| 10512 Count Dr Saint Louis, MO | 3.0 | 1.0 | 888 | $1,195 | $1.35 | 16d | 1 | 0.37mi |
| 10504 Baron Dr Saint Louis, MO | 3.0 | 1.0 | 1000 | $1,300 | $1.30 | 9d | 1 | 0.38mi |
| 2326 Chambers Rd Saint Louis, MO | 2.0 | 1.0 | 1056 | $1,050 | $0.99 | 25d | 1 | 0.45mi |
| 13061 Lord Dr St. Louis, MO | 2.0 | 1.0 | 900 | $1,040 | $1.16 | 23d | 1 | 0.46mi |
| 10557 Castle Dr Saint Louis, MO | 3.0 | 2.0 | 1023 | $1,300 | $1.27 | 16d | 1 | 0.48mi |
| 1520 Attica Dr Saint Louis, MO | 2.0 | 1.0 | 1062 | $1,200 | $1.13 | 25d | 1 | 0.50mi |
| 2257 Chambers Rd Saint Louis, MO | 3.0 | 1.0 | 1200 | $1,400 | $1.17 | 25d | 1 | 0.54mi |
| 2321 Noll Dr Saint Louis, MO | 3.0 | 1.0 | 975 | $1,320 | $1.35 | 25d | 1 | 0.56mi |
| 10129 Cavalier Ct Saint Louis, MO | 3.0 | 1.5 | 912 | $1,250 | $1.37 | 25d | 1 | 0.75mi |
| 9908 Norbridge Ln Saint Louis, MO | 2.0 | 2.0 | 1240 | $1,650 | $1.33 | 21d | 1 | 0.77mi |
| 9744 Lanier Dr Saint Louis, MO | 3.0 | 1.0 | 1014 | $1,345 | $1.33 | 45d | 1 | 0.79mi |
| 1253 Avant Dr Saint Louis, MO | 2.0 | 1.0 | 795 | $1,295 | $1.63 | 16d | 1 | 0.83mi |
| 1253 Avant Dr Saint Louis, MO | 2.0 | 1.0 | 795 | $1,295 | $1.63 | 19d | 1 | 0.83mi |
| 2155 Hecht Ave St. Louis, MO | 1.0–2.0 | 1.0 | 673 | $1,162 | $1.73 | 0d | 23 | 0.83mi |
| 2259 Ainsworth Dr Saint Louis, MO | 4.0 | 2.0 | 1500 | $1,776 | $1.18 | 45d | 1 | 0.83mi |
| 1255 Bosworth Dr Saint Louis, MO | 3.0 | 1.0 | 1071 | $1,575 | $1.47 | 12d | 1 | 0.88mi |
| 9723 Portage Dr Saint Louis, MO | 3.0 | 1.0 | 1014 | $1,450 | $1.43 | 9d | 1 | 0.88mi |
| 10128 Cloverdale Dr Saint Louis, MO | 2.0 | 1.0 | 792 | $1,000 | $1.26 | 0d | 1 | 0.88mi |
| 10128 Cloverdale Dr Saint Louis, MO | 2.0 | 1.0 | 792 | $1,000 | $1.26 | 45d | 1 | 0.88mi |
| 10128 Cloverdale Dr Saint Louis, MO | 2.0 | 1.0 | 792 | $1,000 | $1.26 | 25d | 1 | 0.88mi |
| 1230 Roxton Dr Saint Louis, MO | 3.0 | 1.0 | 912 | $1,400 | $1.54 | 23d | 1 | 0.94mi |
| 62 Capitol Hill Dr Saint Louis, MO | 3.0 | 2.0 | 1239 | $1,250 | $1.01 | 45d | 1 | 0.96mi |
| 10078 Green Valley Dr Saint Louis, MO | 3.0 | 1.0 | 900 | $1,325 | $1.47 | 9d | 1 | 0.96mi |
| 10239 Green Valley Dr Saint Louis, MO | 3.0 | 1.0 | 1014 | $1,395 | $1.38 | 25d | 1 | 0.99mi |
| 1238 Hoyt Dr Saint Louis, MO | 3.0 | 1.0 | 1176 | $1,400 | $1.19 | 23d | 1 | 0.99mi |
| 10124 Winkler Dr Saint Louis, MO | 2.0 | 1.0 | 792 | $1,400 | $1.77 | 4d | 1 | 1.00mi |
| 2257 Luxmore Dr Saint Louis, MO | 3.0 | 3.0 | 1073 | $1,495 | $1.39 | 25d | 1 | 1.01mi |
| 10200 Tappan Dr Saint Louis, MO | 3.0 | 1.0 | 912 | $1,450 | $1.59 | 18d | 1 | 1.02mi |
Listing history 37 events
-
2026-06-21days on market $170,000 Active 30 DOM
-
2026-06-18days on market $170,000 Active 27 DOM
-
2026-06-17days on market $170,000 Active 26 DOM
-
2026-06-16days on market $170,000 Active 25 DOM
-
2026-06-15days on market $170,000 Active 24 DOM
-
2026-06-13days on market $170,000 Active 22 DOM
-
2026-06-13days on market $170,000 Active 21 DOM
-
2026-06-09days on market $170,000 Active 18 DOM
-
2026-06-08days on market $170,000 Active 17 DOM
-
2026-06-07days on market $170,000 Active 16 DOM
-
2026-06-05days on market $170,000 Active 13 DOM
-
2026-06-03days on market $170,000 Active 12 DOM
-
2026-06-02days on market $170,000 Active 11 DOM
-
2026-06-01days on market $170,000 Active 10 DOM
-
2026-05-31days on market $170,000 Active 9 DOM
-
2026-05-23$170,000 Active
-
2026-05-21historical $170,000
-
2025-10-08soldstatus Closed 971-char remark
Show marketing remark (971 chars)
Investor / Sweat-Equity Opportunity – 10236 Earl Dr, St. Louis, MO 63136. Great opportunity for rehabbers, buy-and-hold investors, or owner-occupants ready to earn sweat equity. This 3-bedroom, 2.5-bath newer build for the area, features a two-car garage and a partially finished basement, offering plenty of space and upside potential. Estimated rent is around $1,300/month once improved. This is a light rehab project — most of the work is cosmetic and cleaning, not a full gut renovation. Property is being sold strictly AS-IS – seller will make no repairs or offer any warranties. Buyer should verify all systems and plan for updates as needed. Perfect for investors seeking a quick-turn rental with strong cash flow or a simple flip, as well as owner-occupants looking to build equity fast. Opportunities like this — newer construction, garage, space, and minimal repairs — don’t come along often. Schedule your showing today!
-
2025-09-19status Pending 971-char remark
Show marketing remark (971 chars)
Investor / Sweat-Equity Opportunity – 10236 Earl Dr, St. Louis, MO 63136. Great opportunity for rehabbers, buy-and-hold investors, or owner-occupants ready to earn sweat equity. This 3-bedroom, 2.5-bath newer build for the area, features a two-car garage and a partially finished basement, offering plenty of space and upside potential. Estimated rent is around $1,300/month once improved. This is a light rehab project — most of the work is cosmetic and cleaning, not a full gut renovation. Property is being sold strictly AS-IS – seller will make no repairs or offer any warranties. Buyer should verify all systems and plan for updates as needed. Perfect for investors seeking a quick-turn rental with strong cash flow or a simple flip, as well as owner-occupants looking to build equity fast. Opportunities like this — newer construction, garage, space, and minimal repairs — don’t come along often. Schedule your showing today!
-
2025-09-16$79,900 Active 971-char remark
Show marketing remark (971 chars)
Investor / Sweat-Equity Opportunity – 10236 Earl Dr, St. Louis, MO 63136. Great opportunity for rehabbers, buy-and-hold investors, or owner-occupants ready to earn sweat equity. This 3-bedroom, 2.5-bath newer build for the area, features a two-car garage and a partially finished basement, offering plenty of space and upside potential. Estimated rent is around $1,300/month once improved. This is a light rehab project — most of the work is cosmetic and cleaning, not a full gut renovation. Property is being sold strictly AS-IS – seller will make no repairs or offer any warranties. Buyer should verify all systems and plan for updates as needed. Perfect for investors seeking a quick-turn rental with strong cash flow or a simple flip, as well as owner-occupants looking to build equity fast. Opportunities like this — newer construction, garage, space, and minimal repairs — don’t come along often. Schedule your showing today!
-
2025-09-16historical $79,900 971-char remark
Show marketing remark (971 chars)
Investor / Sweat-Equity Opportunity – 10236 Earl Dr, St. Louis, MO 63136. Great opportunity for rehabbers, buy-and-hold investors, or owner-occupants ready to earn sweat equity. This 3-bedroom, 2.5-bath newer build for the area, features a two-car garage and a partially finished basement, offering plenty of space and upside potential. Estimated rent is around $1,300/month once improved. This is a light rehab project — most of the work is cosmetic and cleaning, not a full gut renovation. Property is being sold strictly AS-IS – seller will make no repairs or offer any warranties. Buyer should verify all systems and plan for updates as needed. Perfect for investors seeking a quick-turn rental with strong cash flow or a simple flip, as well as owner-occupants looking to build equity fast. Opportunities like this — newer construction, garage, space, and minimal repairs — don’t come along often. Schedule your showing today!
-
2022-12-15soldstatus Closed 539-char remark
Show marketing remark (539 chars)
Built in 2001, this adorable home with an attached garage and over 1200 sq ft is ready for a new owner. It is currently rented to a Sec 8 tenant at $982/month. The inside of the home boasts 3 good-sized bedrooms plus 2.5 bathrooms and a finished lower level. The neighbor's home at 10308 Earl Dr sold for $80,000 on 9/9/22 - so don't wait to add this to your portfolio. Property to be sold as is, with the seller to do no inspections or repairs. The tenant is not aware of the sale so please do not walk the property or disturb the tenant.
-
2022-11-22status Pending 539-char remark
Show marketing remark (539 chars)
Built in 2001, this adorable home with an attached garage and over 1200 sq ft is ready for a new owner. It is currently rented to a Sec 8 tenant at $982/month. The inside of the home boasts 3 good-sized bedrooms plus 2.5 bathrooms and a finished lower level. The neighbor's home at 10308 Earl Dr sold for $80,000 on 9/9/22 - so don't wait to add this to your portfolio. Property to be sold as is, with the seller to do no inspections or repairs. The tenant is not aware of the sale so please do not walk the property or disturb the tenant.
-
2022-11-21historical 539-char remark
Show marketing remark (539 chars)
Built in 2001, this adorable home with an attached garage and over 1200 sq ft is ready for a new owner. It is currently rented to a Sec 8 tenant at $982/month. The inside of the home boasts 3 good-sized bedrooms plus 2.5 bathrooms and a finished lower level. The neighbor's home at 10308 Earl Dr sold for $80,000 on 9/9/22 - so don't wait to add this to your portfolio. Property to be sold as is, with the seller to do no inspections or repairs. The tenant is not aware of the sale so please do not walk the property or disturb the tenant.
-
2022-10-25$75,000 Active 539-char remark
Show marketing remark (539 chars)
Built in 2001, this adorable home with an attached garage and over 1200 sq ft is ready for a new owner. It is currently rented to a Sec 8 tenant at $982/month. The inside of the home boasts 3 good-sized bedrooms plus 2.5 bathrooms and a finished lower level. The neighbor's home at 10308 Earl Dr sold for $80,000 on 9/9/22 - so don't wait to add this to your portfolio. Property to be sold as is, with the seller to do no inspections or repairs. The tenant is not aware of the sale so please do not walk the property or disturb the tenant.
-
2016-12-23price $59,500
-
2016-11-16price $66,000
-
2016-10-24price $71,000
-
2013-01-31soldstatus $95,000
-
2012-05-15soldstatus $557,000
-
2012-04-23soldstatus $45,000
-
2008-10-21soldstatus $30,000
-
1999-05-28soldstatus $17,600
-
1991-09-24soldstatus $23,500
-
1991-01-01soldstatus $23,000
-
1991-01-01soldstatus
-
1988-12-01soldstatus $24,600
ⓘ Source: listings_history table (triggers on properties + properties_extension) + one-shot
backfill from property_details.listing_events for pre-trigger history.
Tax reassessment forecast MO · Resets to sale price
- Current annual tax
- $1,490 · $124/mo
- Projected year-2 tax
- $1,649 · $137/mo
- Expected delta
- +$159/yr (+$13/mo · 10.6%)
ⓘ Screening estimate from a state-policy table — verify with the county assessor before closing.
Climate risk First Street
- Flood 1/10 Low FEMA zone X (unshaded) · 0% chance over 30 yrs
- Wildfire 1/10 Low
- Heat 5/10 Major 7 d/yr ≥107°F today · 21 d/yr by 30 yrs out
- Wind 2/10 Low 100% chance of damaging wind over 30 yrs
- Air quality 4/10 Moderate 4 unhealthy d/yr today · 5 by 30 yrs out
Nearby sold comps map
Loading sold comps map…
Walkable amenities ~0.75 mi
Loading nearby amenities…
Taxation est. · year 1
- Rental income
- $15,609
- − Mortgage interest
- −$9,523
- − Property taxes
- −$1,490
- − Insurance
- −$850
- − Repairs & maintenance
- −$1,249
- − Management
- −$1,249
- − Depreciation
- −$4,945
- Taxable loss
- −$3,697
- Est. tax savings @ 24.0%
- +$887
- After-tax cash flow
- $180/yr
For passive investors: Depreciation is non-cash, so a rental often shows a tax loss while cash-flowing — sheltering income. Rental losses are passive: they offset passive income freely, and up to $25,000/yr can offset ordinary (W-2) income if you actively participate and your MAGI is under $100k (phasing out to $0 by $150k); unused losses carry forward. On sale, claimed depreciation is recaptured at up to 25%, and gains may owe capital-gains tax (a 1031 exchange can defer both). Figures are a year-1 estimate at your 24.0% rate — not tax advice; consult a CPA.
Schools (NCES district)
- District
- Riverview Gardens
- NCES district ID
- 2926670
- Math proficiency
- 2% ▼ -6.00%
- Reading proficiency
- 9% ▼ -6.00%
- Median HH income
- $32,759
- Composite
- 4.22/100
- National rank
- #10058
- State rank
- #324 of 324 in MO
Livability — Castle Point
- Score
- 64/100
- State rank
- #313
- US rank
- #14373
Category grades
Schools grade is shown separately in the Schools card above.
Census & demographics
- Census place
- Castle Point, MO
- County
- Saint Louis County · 888,823 people
- Metro
- St. Louis, MO-IL
- Population (ZIP)
- 40,929
- Household income
- $41,154
- Rent vs Own
- Severe rent burden
- 3085.0
Population outlook (St. Louis County) Hauer SSP2
- Today (2025)
- 1,025,227 people
- By 2030
- 1,028,023 · +0.3%
- By 2040
- 1,020,940 · -0.4%
- By 2050
- 1,007,280 · -1.8%
- By 2075
- 987,277 · -3.7%
- By 2100
- 921,984 · -10.1%
Race, ethnicity, and origin ACS 2023
- Neighborhood character
- Predominantly Black (90%)
- Race & ethnicity
- Black 90% White 5% Two or more races 3%
- Foreign-born
- 1% · Canada
Political lean MEDSL · St. Louis
- 2024 margin
- Strong D (+23.4) · D 60.8% · R 37.4% · Other 1.7%
- 2008→2024 swing
- +3.5pp toward D · 2008: 19.9pp · 2024: 23.4pp
- All cycles
- 2024: D+23.4 2020: D+24.0 2016: D+16.2 2012: D+13.7 2008: D+19.9
Not yet ingested
- Civics
- —
Market trends
- HPI YoY
- ▲ 3.79%
- Current HPI
- 420.28
- Rent YoY
- ▲ 4.97%
- Metro
- St. Louis, MO-IL
- State GDP YoY
- ▲ 1.84%
- F500 in state
- 20
Industry mix (Fortune 500 HQ in MO)
| Industry | F500 HQs | Revenue |
|---|---|---|
| Healthcare | 1 | $163B |
|
||
| Insurance | 1 | $21B |
|
||
| Industrial Technology | 1 | $17B |
|
||
| Retail | 1 | $16B |
|
||
| Industrial Distribution | 1 | $10B |
|
||
| Utilities | 1 | $9B |
|
||
Price history
+591.1% since first listed22 events — show timeline
- 2026-05-23 Listed $170,000 MARIS as Distributed by MLS Grid
- 2026-05-21 Coming Soon $170,000 MARIS as Distributed by MLS Grid
- 2025-10-08 Sold (MLS) — MARIS as Distributed by MLS Grid
- 2025-09-19 Pending — MARIS as Distributed by MLS Grid
- 2025-09-16 Listed $79,900 MARIS as Distributed by MLS Grid
- 2025-09-16 Coming Soon $79,900 MARIS as Distributed by MLS Grid
- 2022-12-15 Sold (MLS) — MARIS as Distributed by MLS Grid
- 2022-11-22 Pending — MARIS as Distributed by MLS Grid
- 2022-11-21 Delisted — MARIS as Distributed by MLS Grid
- 2022-10-25 Listed $75,000 MARIS as Distributed by MLS Grid
- 2016-12-23 Price Changed $59,500 MARIS as Distributed by MLS Grid
- 2016-11-16 Price Changed $66,000 MARIS as Distributed by MLS Grid
- 2016-10-24 Price Changed $71,000 MARIS as Distributed by MLS Grid
- 2013-01-31 Sold (Public Records) $95,000 Public Records
- 2012-05-15 Sold (Public Records) $557,000 Public Records
- 2012-04-23 Sold (Public Records) $45,000 Public Records
- 2008-10-21 Sold (Public Records) $30,000 Public Records
- 1999-05-28 Sold (Public Records) $17,600 Public Records
- 1991-09-24 Sold (Public Records) $23,500 Public Records
- 1991-01-01 Sold (Public Records) — Public Records
- 1991-01-01 Sold (Public Records) $23,000 Public Records
- 1988-12-01 Sold (Public Records) $24,600 Public Records
Property tax history
+1.8%/yrLatest (2022): $1,490 · +0.4% YoY. Source: county tax records.
Cash-flow waterfall
monthlySold comps — $/sqft
last 12 mo · ≤1 miLoading sold comps…