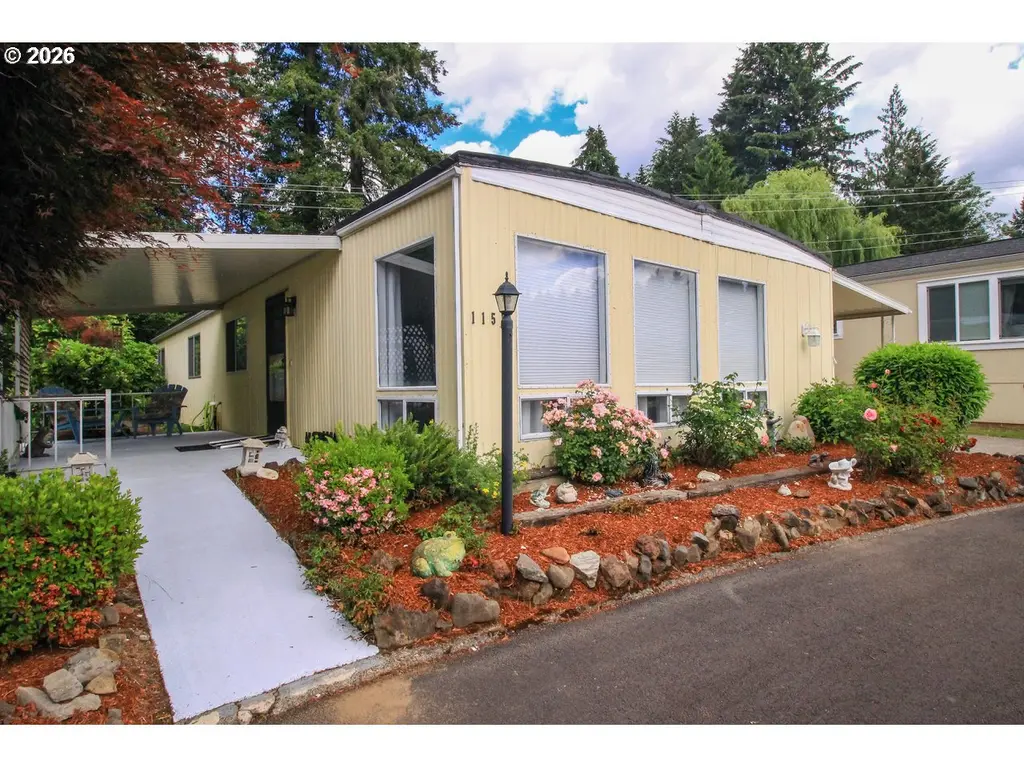
11513 SW Royal Villa Dr · Tigard, OR
Flood risk 1/10 · Minimal
- FEMA flood zone
- X (unshaded)
- Chance of flooding over 30 yrs
- 0.0%
- Est. flood insurance / yr
- $507 – $1,088
Fire risk 1/10 · Minimal
- Est. fire insurance / yr
- $498 – $926
Heat risk 3/10 · Minor
- Hot days now (above 92°F)
- 7 days/yr
- Hot days in 30 yrs
- 14 days/yr
Wind risk 1/10 · Minimal
- Chance of severe wind over 30 yrs
- —
Air-quality risk 9/10 · Severe
- Unhealthy air days now
- 12 days/yr
- Unhealthy air days in 30 yrs
- 13 days/yr
Risk factors via First Street. Map © Google.
Why this score? — see what drove the B grade
The composite is a weighted blend of 9 inputs, each scored 0–100. Each bar is that input's sub-score; the figure is the points it added to the 100-point composite (weight × sub-score).
- Cash flow +30.0/30.0
- 1% rule +10.0/10.0
- DSCR +10.0/10.0
- ARV discount +7.5/15.0
- Schools +4.9/10.0
- Livability +4.4/5.0
- Rent growth +2.4/5.0
- Condition / age +2.2/5.0
- Appreciation +0.0/10.0
$109,900
🖨 Deal sheet 📄 Offer letter ✓ Due diligence
Listing remarks MLS
SPACIOUS, WELL KEPT HOME ON ONE OF THE BEST LOTS IN PARK FOR 55 AND OVER. GREAT KITCHEN, FAMILY ROOM W/WOOD STOVE. TWO CAR, COVERED PARKING. EASY CARE INSIDE AND OUTSIDE. HOME WARRANTY.
Key facts
- Golf putting course
- Open floor plan
- Tennis court
Tags
Property features AI
Finance
- Other: Lot is level and on a bus line; Paved road access
- Financial info: Land lease in place (land lease expires July 31, 2026); monthly lot rent
- HOA & community: Community amenities include pool, tennis courts, recreation facilities, meeting room, commons, management, and all landscaping; Senior community
Exterior
- Parking: Carport and driveway
- Utilities: Public water; Public sewer; Electric service
- Home design: Manufactured home in a park (residential); Single-story (main level only); Built in 1971; No notable view
- Construction: Metal roof
- Exterior features: Covered patio, patio and porch; Tool shed; Metal siding
Interior
- Kitchen: Island / cook island; Eat bar and eating area; Dishwasher; Microwave; Free-standing range; Free-standing refrigerator
- Bedrooms: Primary bedroom on main with attached bath and closet; Second bedroom on main with closet
- Flooring: Laminate flooring in dining/kitchen areas; Wall-to-wall carpet in living room and other areas
- Bathrooms: Two full bathrooms, both on the main level
- Heating & cooling: Heat pump for heating and cooling; Electric hot water
- Interior features: One-level layout with minimal steps and accessible approach; Accessible entrance and main floor bedroom with bath; Utility room on main; Laundry area with washer/dryer; Laminate flooring and wall-to-wall carpet
- Laundry & utility: Washer and dryer located in main-level utility room
Neighborhood map
What this means for you Summary
Snapshot
- This is a 2-bed/2.0-bath manufactured listed at $110k. Condition is rated fair.
Deal economics
- At list price, monthly cash flow is $726 ($9k/yr) — positive.
- The deal already cash-flows at list — no discount required.
- Meets the 1% rule at list price ($2k rent vs $110k).
- Recommended offer: $108k (1.5% below list) — sets the bar for market timing.
- Cap rate 14.2% vs local median 2.5% in Tigard — top-decile yield for the area; either an underpriced asset or a hidden risk that comps aren't pricing in. Stress-test before assuming the spread holds.
Location & tenants
- Location reads 87/100 on livability (#14 in OR, #311 nationally) — a professional / high-income tenant draw. Strengths: amenities A+, commute A+, employment A+; Watch: crime D-, cost of living F.
- Tigard-Tualatin SD 23J (suburban): math 47% / reading 65% proficiency, ranked #6 of 58 in OR (top 10%) — acceptable for families but not a draw, mixed tenant base, ~2y average lease.
- Zoned schools: James Templeton Elementary School (reading 24%, 514 students, 47% FRL); Twality Middle School (math 54% / reading 64%, grade B, #17 of 128 statewide, top 14%, 918 students, 31% FRL); Tigard High School (math 24% / reading 75%, grade D+, #32 of 143 statewide, top 34%, 1,799 students, 31% FRL).
- Market conditions: Rents soft (-0.4%/yr); 412 active listings in the ZIP; 34 comparable units currently listed for rent nearby; rentals at typical pace (median 15d on market — plan ~3-4 weeks tenant-placement turnaround); solid renter incomes; 2,224 units permitted in Washington County in 2024 (242 in 5+ unit buildings).
Forward outlook
- Local home prices are declining (-3.0%/yr); year-one equity from $760 of loan paydown is wiped out by about $3k of value loss. Plan a longer hold.
- Washington County population projected at +33% by 2050 — long-run rental-demand tailwind backs the buy-and-hold thesis.
- At projected returns (-3.0% appreciation + 0.0% rent growth), your $31k cash investment doubles in ~5 years — after that, you're playing with house money.
Negotiation context
- It's been on market 19 days — a 2% lower offer ($108k) is reasonable based on typical stale-listing flexibility.
- 2 sale attempts since 28y ago with the ask held roughly flat each time — persistent listings suggest the price (not the market) is what's stuck; bring a comps-based counter.
- Current owner paid $32k; list at $110k implies a 249% gain — meaningful room to come down on a strong offer.
Questions for the listing agent
- Have any recent inspections been done? Can we get a copy of the seller's disclosures and any deferred-maintenance estimates?
- Built in 1971 — when were the roof, HVAC, electrical panel, plumbing, and water heater last replaced?
- Is there a deadline driving the sale (1031 exchange, divorce, estate, relocation)? That informs how much negotiation room exists.
- Schools are B-rated — typically a magnet for longer-tenancy family renters. What's the average tenant stay here, and is there a school-zone premium baked into asking?
- Crime grade is D in this area — have there been break-ins, vandalism, or insurance claims at this property in the last 3 years? What carrier currently insures it and at what premium?
- What's the average days-on-market for RENTAL listings here right now (not sales)? A rising rental-DOM trend means longer vacancies and softer asking-rent achievability than the comps imply.
- What's the recent tenant-quality profile in this submarket — average credit score on applications, eviction rate, late-payment / NSF rate, and stable-employment percentage? A property-management company in the area should have these aggregated.
- How much new for-sale + rental construction is in the pipeline within 1–3 miles? Heavy new supply typically softens prices + rents 12–24 months out; constrained supply supports both.
Investment metrics
- 1% rule
- 1.71% ✓
- Cap rate
- 14.22%
- Cash-on-cash
- 28.32%
- DSCR
- 2.26
- GRM
- 4.9
CMA / ARV
- ARV (on-the-fly)
- $67,680
- Comps found
- 12
Show comp detail 12 sales within ~0.75 mi
| Address | Dist | Beds/Ba | Sqft | Sold | Price | $/sf | Match |
|---|---|---|---|---|---|---|---|
| 11668 SW Royal Villa Dr #77 | 0.02mi | 2/2.0 | 1,440 (0%) | 3mo | $67,000 | $47 | 97 |
| 11444 SW Royal Villa Dr #165 | 0.22mi | 2/2.0 | 1,440 (0%) | 7mo | $60,000 | $42 | 84 |
| 11656 SW Royal Villa Dr #71 | 0.03mi | 3/2.0 (+1) | 1,344 (-7%) | 6mo | $42,500 | $32 | 78 |
| 11560 SW Royal Villa Dr | 0.18mi | 2/2.0 | 1,334 (-7%) | 5mo | $35,000 | $26 | 75 |
| 11680 SW Royal Villa Dr | 0.06mi | 3/2.0 (+1) | 1,344 (-7%) | 10mo | $127,500 | $95 | 73 |
| 11768 SW Royal Villa Dr #124 | 0.13mi | 2/2.0 | 1,248 (-13%) | 2mo | $28,000 | $22 | 70 |
| 17088 SW Eldorado Dr | 0.68mi | 2/2.0 | 1,440 (0%) | 2mo | $23,000 | $16 | 67 |
| 11460 SW Royal Villa Dr | 0.08mi | 2/2.0 | 1,248 (-13%) | 9mo | $72,500 | $58 | 66 |
| 12450 SW Fischer Rd #277 | 0.56mi | 2/2.0 | 1,344 (-7%) | 7mo | $55,000 | $41 | 57 |
| 17103 SW Eldorado Dr | 0.63mi | 2/2.0 | 1,335 (-7%) | 12mo | $91,000 | $68 | 49 |
| 17254 SW Eldorado Dr | 0.75mi | 3/2.0 (+1) | 1,488 (+3%) | 11mo | $88,000 | $59 | 46 |
| 17123 SW Eldorado Dr | 0.75mi | 3/2.0 (+1) | 1,568 (+9%) | 2mo | $129,985 | $83 | 44 |
Match score weights: distance 35% · size 25% · config 20% · recency 20%. Top-matched comps best support the ARV.
Projected returns pro-forma
-3.0% appreciation · 0.0% rent growth · sell at horizon
- IRR
- 19.1%
- Equity multiple
- 1.75×
- Total profit
- $22,956
- Equity at exit
- $16,386
- IRR
- 25.3%
- Equity multiple
- 2.90×
- Total profit
- $58,357
- Equity at exit
- $9,502
Cash invested: $30,772 (down + closing). Projections, not guarantees.
Landlord ↔ Tenant lean methodology
- Overall (STATE)
- 28 Tenant-Leaning
- State Oregon
- 28 Tenant-Leaning · D+6
- County
- — inherits STATE
- City
- — inherits STATE
ZIP-level market 97224
- Rents YoY
- -0.4%
- Active inventory
- 412
- Price-to-rent
- 4.9×
Monthly cashflow live
- Estimated rent
- $1,881 high interval (Pro) →
- Mortgage (P&I)
- −$576
- Tax est. 1.5%
- −$137 /mo · $1,648/yr
- Insurance
- −$46
- HOA
- −$0
- Vacancy / Maint / Mgmt
- −$395
- Net cashflow
- $726
Break-even live
UW: 25.0% down · 7.5% · 30yr · 1.5% tax · 5.0% vac · 8.0% maint · 8.0% mgmt
Financing live
Cash to close
- Down payment
- $27,475
- Closing costs
- $3,297
- Reserves months
- —
- Total cash needed
- —
Loan-product check · same deal, 3 products live
Conventional
25% down · 7.5% · 30yr
- Down + closing
- —
- Monthly P&I
- —
- Monthly cashflow
- —
- DSCR
- —
- Eligible?
- —
Personal DTI + credit; lowest rate.
DSCR
20% down · 8.5% · 30yr
- Down + closing
- —
- Monthly P&I
- —
- Monthly cashflow
- —
- DSCR
- —
- Eligible?
- —
No personal income docs; deal must DSCR.
Hard money
10% down · 12.0% · 12mo
- Down + closing
- —
- Monthly P&I
- —
- Monthly cashflow
- —
- DSCR
- —
- Eligible?
- —
Short-term bridge; refi at stabilization.
Rent comps 34 comps
| Address | Beds | Baths | Sqft | Rent | $/sqft | DOM | Units | Dist |
|---|---|---|---|---|---|---|---|---|
| 12070 SW Fischer Rd Portland, OR | 1.0–3.0 | 1.0–2.0 | 925 | $1,812 | $1.96 | 1d | 9 | 0.32mi |
| 16055 SW 108th Ave Tigard, OR | 1.0–2.0 | 1.0–2.0 | 852 | $1,940 | $2.28 | 7d | 9 | 0.49mi |
| 10900 SW Gaarde St Portland, OR | 2.0 | 1.0 | 825 | $1,525 | $1.85 | 7d | 4 | 0.59mi |
| 10900 SW Gaarde St Unit 273-16 Tigard, OR | 2.0 | 1.0 | 900 | $1,575 | $1.75 | 23d | 1 | 0.59mi |
| 11773 SW King George Dr King City, OR | 1.0–2.0 | 1.0–2.0 | 826 | $2,500 | $3.03 | 11d | 7 | 0.62mi |
| 11865 SW Tualatin Rd Tualatin, OR | 2.0–3.0 | 2.0–2.5 | 1154 | $1,697 | $1.47 | 1d | 19 | 0.63mi |
| 15205 SW 119th Ave Portland, OR | 2.0 | 2.0 | 1650 | $2,150 | $1.30 | 20d | 1 | 0.64mi |
| 16444 SW 130th Ter King City, OR | 2.0 | 2.0 | 1002 | $1,695 | $1.69 | 43d | 1 | 0.65mi |
| 13060 SW Dickson St Portland, OR | 2.0 | 2.0 | 1108 | $1,850 | $1.67 | 43d | 1 | 0.71mi |
| 11390 SW Naeve St Tigard, OR | 1.0–2.0 | 1.0–2.0 | 893 | $2,119 | $2.37 | 3d | 5 | 0.72mi |
| 17979 SW 115th Ave Unit 6 Tualatin, OR | 2.0 | 1.5 | 1064 | $1,625 | $1.53 | 23d | 1 | 0.74mi |
| 15199 SW Royalty Pkwy Portland, OR | 1.0–3.0 | 1.0–2.0 | 884 | $1,805 | $2.04 | 1d | 12 | 0.75mi |
| 17987 SW 115th Ave Unit 1 Tualatin, OR | 2.0 | 1.0 | 900 | $1,475 | $1.64 | 23d | 1 | 0.75mi |
| 17989 SW 115th Ave Tualatin, OR | 2.0 | 1.0–1.5 | 982 | $1,550 | $1.58 | 23d | 2 | 0.76mi |
| 17865 SW Pacific Hwy Tualatin, OR | 1.0–3.0 | 1.0–2.0 | 970 | $1,970 | $2.03 | 1d | 13 | 0.76mi |
| 11545 SW Beef Bend Rd Portland, OR | 2.0 | 2.0 | 935 | $1,514 | $1.62 | 2d | 1 | 0.77mi |
| 16849 SW 131st Ave Portland, OR | 2.0 | 2.0 | 1029 | $1,950 | $1.90 | 14d | 1 | 0.78mi |
| 16903 SW 133rd Ter Portland, OR | 3.0 | 2.5 | 1665 | $2,845 | $1.71 | 10d | 1 | 0.87mi |
| 11430 SW Bull Mountain Rd Tigard, OR | 2.0 | 2.0 | 986 | $1,970 | $2.00 | 3d | 6 | 0.90mi |
| 14844 SW 109th Ave Portland, OR | 2.0 | 1.5 | 1024 | $1,950 | $1.90 | 43d | 1 | 0.91mi |
| 14799 SW 109th Ave Unit 2502 Tigard, OR | 2.0 | 2.0 | 986 | $1,645 | $1.67 | 43d | 1 | 0.91mi |
| 14799 SW 109th Ave Unit 7504 Tigard, OR | 2.0 | 2.0 | 986 | $1,575 | $1.60 | 23d | 1 | 0.91mi |
| 14799 SW 109th Ave Unit 5702 Tigard, OR | 2.0 | 2.0 | 986 | $1,745 | $1.77 | 21d | 1 | 0.91mi |
| 14799 SW 109th Ave Unit 3102 Tigard, OR | 2.0 | 2.0 | 986 | $1,695 | $1.72 | 7d | 1 | 0.91mi |
| 10695 SW Murdock St Tigard, OR | 2.0 | 1.0 | 793 | $1,806 | $2.28 | 1d | 13 | 0.97mi |
| 17335 SW Montague Way Portland, OR | 3.0 | 2.5 | 1687 | $3,175 | $1.88 | 1d | 1 | 1.10mi |
| 10779 SW Canterbury Ln Tigard, OR | 3.0 | 2.5 | 1350 | $2,275 | $1.69 | 14d | 1 | 1.14mi |
| 10775 SW Canterbury Ln #102 Portland, OR | 3.0 | 3.0 | 1373 | $2,495 | $1.82 | 23d | 1 | 1.16mi |
| 13830 SW Chinn Ln Portland, OR | 1.0–3.0 | 1.0–2.0 | 839 | $1,724 | $2.05 | 3d | 11 | 1.16mi |
| 14100 SW 112th Ave Unit I08 Portland, OR | 2.0 | 1.0 | 1084 | $1,614 | $1.49 | 12d | 1 | 1.16mi |
| 14130 SW 105th Ave Portland, OR | 2.0 | 1.0 | 900 | $1,495 | $1.66 | 23d | 1 | 1.27mi |
| 9720 SW Tualatin Rd Tualatin, OR | 2.0 | 2.0 | 1100 | $1,750 | $1.59 | 43d | 1 | 1.27mi |
| 14495 SW Beef Bend Rd Portland, OR | 1.0–2.0 | 1.0–2.0 | 845 | $1,925 | $2.28 | 4d | 12 | 1.34mi |
| 15870 SW 88th Ave Unit A Tigard, OR | 2.0 | 1.0 | 1013 | $1,745 | $1.72 | 43d | 1 | 1.45mi |
Listing history 14 events
-
2026-06-18days on market $109,900 Active 19 DOM
-
2026-06-17days on market $109,900 Active 18 DOM
-
2026-06-16days on market $109,900 Active 17 DOM
-
2026-06-15days on market $109,900 Active 16 DOM
-
2026-06-13days on market $109,900 Active 14 DOM
-
2026-06-09days on market $109,900 Active 10 DOM
-
2026-06-08days on market $109,900 Active 9 DOM
-
2026-06-07days on market $109,900 Active 8 DOM
-
2026-06-05days on market $109,900 Active 5 DOM
-
2026-06-03days on market $109,900 Active 4 DOM
-
2026-06-02days on market $109,900 Active 3 DOM
-
2026-06-01days on market $109,900 Active 2 DOM
-
2026-05-31remarks 530-char remark
-
2026-05-31$109,900 Active 1 DOM
ⓘ Source: listings_history table (triggers on properties + properties_extension) + one-shot
backfill from property_details.listing_events for pre-trigger history.
Climate risk First Street
- Flood 1/10 Low FEMA zone X (unshaded) · 0% chance over 30 yrs
- Wildfire 1/10 Low
- Heat 3/10 Moderate 7 d/yr ≥92°F today · 14 d/yr by 30 yrs out
- Wind 1/10 Low
- Air quality 9/10 Extreme 12 unhealthy d/yr today · 13 by 30 yrs out
Nearby sold comps map
Loading sold comps map…
Walkable amenities ~0.75 mi
Loading nearby amenities…
Taxation est. · year 1
- Rental income
- $22,566
- − Mortgage interest
- −$6,156
- − Property taxes
- −$1,648
- − Insurance
- −$550
- − Repairs & maintenance
- −$1,805
- − Management
- −$1,805
- − Depreciation
- −$3,197
- Taxable income
- $7,405
- Est. tax owed @ 24.0%
- −$1,777
- After-tax cash flow
- $6,936/yr
For passive investors: Depreciation is non-cash, so a rental often shows a tax loss while cash-flowing — sheltering income. Rental losses are passive: they offset passive income freely, and up to $25,000/yr can offset ordinary (W-2) income if you actively participate and your MAGI is under $100k (phasing out to $0 by $150k); unused losses carry forward. On sale, claimed depreciation is recaptured at up to 25%, and gains may owe capital-gains tax (a 1031 exchange can defer both). Figures are a year-1 estimate at your 24.0% rate — not tax advice; consult a CPA.
Condition & rehab AI · 12 photos
This manufactured home requires moderate repairs and maintenance, with potential for significant value increase through updates.
Repairs flagged
- Minor kitchen cabinets — slight wear
- Minor bathroom vanity — slight wear
- Minor landscaping — some overgrown areas
Value-add opportunities
- Resale paint interior walls — enhances curb appeal
- Resale replace kitchen cabinets — modernizes kitchen
- Both landscaping — enhances curb appeal and adds value
Renovation cost estimate screening
| Repair item | Severity | Est. cost |
|---|---|---|
| kitchen cabinets · slight wear | Minor | $500–3,000 |
| bathroom vanity · slight wear | Minor | $500–3,000 |
| landscaping · some overgrown areas | Minor | $500–3,000 |
| Total estimated repair cost · 3 items | $1,500–9,000 |
Value-add ROI direction
- Resale paint interior walls — enhances curb appeal ↑
- Resale replace kitchen cabinets — modernizes kitchen ↑
- Both landscaping — enhances curb appeal and adds value ↑
ⓘ Cost ranges are severity-bucket heuristics (US national rule-of-thumb). Get contractor quotes + a written scope before underwriting a rehab budget.
Schools (NCES district)
- District
- Tigard-Tualatin SD 23J
- NCES district ID
- 4112240
- Math proficiency
- 47% ▼ -3.00%
- Reading proficiency
- 65% ▲ 3.00%
- Median HH income
- $60,739
- Composite
- 48.72/100
- National rank
- #2100
- State rank
- #6 of 58 in OR
Livability — Tigard
- Score
- 87/100
- State rank
- #14
- US rank
- #311
Category grades
Schools grade is shown separately in the Schools card above.
Census & demographics
- County
- Washington County · 583,254 people
- City population
- 87,096
- Metro
- Portland-Vancouver-Hillsboro, OR-WA
- Population (ZIP)
- 36,569
- Household income
- $98,125
- Rent vs Own
- Severe rent burden
- 1468.0
Population outlook (Washington County) Hauer SSP2
- Today (2025)
- 674,042 people
- By 2030
- 721,804 · +7.1%
- By 2040
- 812,732 · +20.6%
- By 2050
- 895,143 · +32.8%
- By 2075
- 1,058,806 · +57.1%
- By 2100
- 1,131,692 · +67.9%
Race, ethnicity, and origin ACS 2023
- Neighborhood character
- Predominantly White (73%)
- Race & ethnicity
- White 73% Hispanic / Latino 10% Two or more races 8% Asian 8% Black 3%
- Hispanic origin (detail)
- Mexican 7%
- Common ancestry
- Italian 4% Lithuanian 4% Slovak 3%
- Foreign-born
- 13% · Canada, Vietnam, China
- Languages at home
- 83% English-only · Spanish 7% Other Indo-European 3% Vietnamese 2%
Political lean MEDSL · Washington
- 2024 margin
- Solid D (+34.0) · D 65.3% · R 31.3% · Other 3.4%
- 2008→2024 swing
- +11.8pp toward D · 2008: 22.1pp · 2024: 34.0pp
- All cycles
- 2024: D+34.0 2020: D+34.6 2016: D+26.7 2012: D+17.5 2008: D+22.1
Not yet ingested
- Civics
- —
Market trends
- HPI YoY
- ▼ -287.40%
- Current HPI
- 277.57
- Rent YoY
- ▼ -0.38%
- Metro
- Portland-Vancouver-Hillsboro, OR-WA
- State GDP YoY
- ▲ 2.05%
- F500 in state
- 2
Industry mix (Fortune 500 HQ in OR)
| Industry | F500 HQs | Revenue |
|---|---|---|
| Consumer Goods | 1 | $51B |
|
||
Price history
+201.1% since first listed3 events — show timeline
- 2026-05-30 Listed $109,900 RMLS
- 1998-07-06 Sold (MLS) $31,500 RMLS
- 1998-04-22 Listed $36,500 RMLS
Cash-flow waterfall
monthlySold comps — $/sqft
last 12 mo · ≤1 miLoading sold comps…