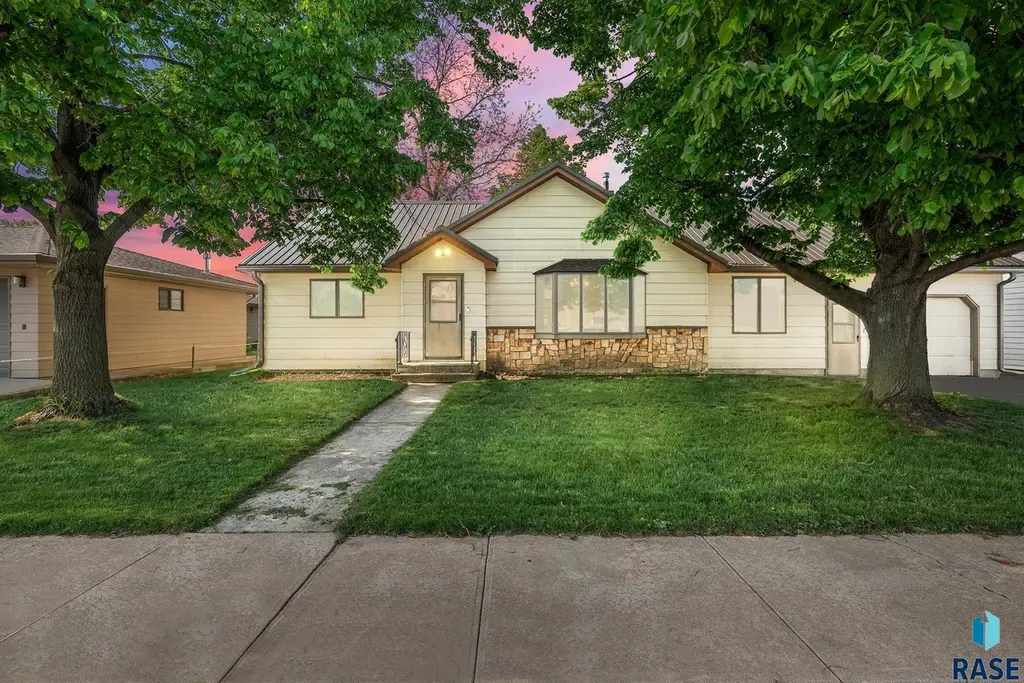
221 Essex Ave E Ave E · Salem, SD
Flood risk 1/10 · Minimal
- FEMA flood zone
- A
- Chance of flooding over 30 yrs
- 0.0%
- Est. flood insurance / yr
- $946 – $6,584
Fire risk 4/10 · Minor
- Est. fire insurance / yr
- $1,342 – $2,492
Heat risk 2/10 · Minimal
- Hot days now (above 101°F)
- 7 days/yr
- Hot days in 30 yrs
- 14 days/yr
Wind risk 2/10 · Minimal
- Chance of severe wind over 30 yrs
- —
Air-quality risk 2/10 · Minimal
- Unhealthy air days now
- 1 days/yr
- Unhealthy air days in 30 yrs
- 1 days/yr
Risk factors via First Street. Map © Google.
Why this score? — see what drove the B+ grade
The composite is a weighted blend of 9 inputs, each scored 0–100. Each bar is that input's sub-score; the figure is the points it added to the 100-point composite (weight × sub-score).
- Cash flow +25.6/30.0
- ARV discount +15.0/15.0
- Appreciation +10.0/10.0
- DSCR +8.5/10.0
- 1% rule +5.4/10.0
- Schools +4.2/10.0
- Livability +3.6/5.0
- Rent growth +2.5/5.0
- Condition / age +2.5/5.0
$100,000
🖨 Deal sheet (PDF) 📄 Offer letter ✓ Due diligence
Key facts
- 7,425 sq ft lot
- 2 garage spots
- Built 1938
Property features AI
Exterior
- Parking: Attached 2-car garage; Concrete parking; Heated garage with separate workshop
- Utilities: Public water; Public sewer
- Home design: Single-family ranch home; Owned land
- Construction: Wood siding; Poured foundation; Metal roof; Below-grade finished and unfinished space
- Exterior features: Front porch; 3-season porch; Irregular lot
Interior
- Kitchen: Electric range; Stove hood; Garbage disposal
- Bedrooms: 3+ bedrooms on main level
- Flooring: Wood flooring
- Bathrooms: 2 full bathrooms
- Heating & cooling: Electric heating; Central air; Electric water heater
- Interior features: Formal dining room; Main floor laundry; Three or more bedrooms on the same level; Full basement
- Laundry & utility: Washer; Dryer; No water softener
Neighborhood map
What this means for you Summary
Snapshot
- This is a 3-bed/2.0-bath single-family listed at $100k.
Deal economics
- At list price, monthly cash flow is $-77 ($-923/yr) — negative.
- To cash-flow at today's rent, offer at most $86k (13.6% below list).
- Meets the 1% rule at list price ($1k rent vs $100k).
- Recommended offer: $86k (13.6% below list) — sets the bar for cash-flow.
Location & tenants
- Location reads 72/100 on livability (#45 in SD) — a middle-class / working-renter tenant base. Strengths: crime A+, cost of living A+, housing A+; Watch: amenities F, commute F, health & safety D-.
- Mccook Central School District 43-7 (rural): math 44% / reading 50% proficiency, ranked #87 of 148 in SD (top 59%) — families likely to look elsewhere, expect single-tenant / working-renter base with shorter leases.
- Zoned schools: Mccook Central Elementary - 02 (math 24% / reading 24%, grade F, #219 of 253 statewide, top 89%, 184 students, 21% FRL); Mccook Central Middle School - 03 (math 47% / reading 57%, grade C+, #46 of 143 statewide, top 37%, 96 students, 18% FRL); Mccook Central High School - 01 (math 30% / reading 50%, grade F, #114 of 151 statewide, top 81%, 128 students, 16% FRL).
- Market conditions: 33 active listings in the ZIP; 22 units permitted in McCook County in 2024 (0 in 5+ unit buildings).
Forward outlook
- In year one you build about $11k of equity ($691 loan paydown + $10k appreciation (10.0% local appreciation)).
- McCook County population projected at +7% by 2050 — modest demand growth; plan on rents tracking national, not racing it.
- At projected returns (10.0% appreciation + 3.0% rent growth), your $28k cash investment doubles in ~3 years — after that, you're playing with house money.
- By year 4, paydown + projected appreciation supports a ~$38k cash-out refi (75% LTV) — recoverable capital for the next deal without selling this one.
Negotiation context
- Only 11 days on market — expect competitive offers; lowballing is unlikely to land.
Risks & watch-outs
- Watch-outs: flood insurance adds $314/mo; built in 1938 — expect roof / HVAC / electrical / plumbing capex.
- Climate carrying-cost: in FEMA flood zone A (mandatory federal flood insurance) — expect insurance premiums to compound above CPI over the hold.
Questions for the listing agent
- What do current leases actually rent for vs. the listed asking? Can we see a recent rent roll and the last 12 months of T-12 income?
- Built in 1938 — when were the roof, HVAC, electrical panel, plumbing, and water heater last replaced?
- What's the actual annual flood-insurance premium (NFIP or private), and is the property in a SFHA with mandatory coverage?
- Is there a deadline driving the sale (1031 exchange, divorce, estate, relocation)? That informs how much negotiation room exists.
- What's the average days-on-market for RENTAL listings here right now (not sales)? A rising rental-DOM trend means longer vacancies and softer asking-rent achievability than the comps imply.
- What's the recent tenant-quality profile in this submarket — average credit score on applications, eviction rate, late-payment / NSF rate, and stable-employment percentage? A property-management company in the area should have these aggregated.
- How much new for-sale + rental construction is in the pipeline within 1–3 miles? Heavy new supply typically softens prices + rents 12–24 months out; constrained supply supports both.
Investment metrics
- 1% rule
- 1.04% ✓
- Cap rate
- 9.13%
- Cash-on-cash
- 10.15%
- DSCR
- 1.45
- GRM
- 8.0
CMA / ARV
- ARV (on-the-fly)
- $198,789
- Comps found
- 3
Show comp detail 3 sales within ~0.75 mi
| Address | Dist | Beds/Ba | Sqft | Sold | Price | $/sf | Match |
|---|---|---|---|---|---|---|---|
| 330 E Vermont Ave | 0.09mi | 3/1.0 | 1,370 (-11%) | 15mo | $137,750 | $101 | 61 |
| 331 W Franklin Ave Ave | 0.41mi | 2/2.0 (-1) | 1,448 (-6%) | 6mo | $215,000 | $148 | 61 |
| 310 W Washington Ave Ave | 0.32mi | 3/2.0 | 1,320 (-14%) | 8mo | $170,000 | $129 | 54 |
Match score weights: distance 35% · size 25% · config 20% · recency 20%. Top-matched comps best support the ARV.
Projected returns pro-forma
10.0% appreciation · 3.0% rent growth · sell at horizon
- IRR
- 22.0%
- Equity multiple
- 2.78×
- Total profit
- $49,708
- Equity at exit
- $90,088
- IRR
- 19.8%
- Equity multiple
- 6.38×
- Total profit
- $150,522
- Equity at exit
- $194,278
Cash invested: $28,000 (down + closing). Projections, not guarantees.
Landlord ↔ Tenant lean methodology
- Overall (STATE)
- 83 Strongly Landlord-Friendly
- State South Dakota
- 83 Strongly Landlord-Friendly · R+16
- County
- — inherits STATE
- City
- — inherits STATE
ZIP-level market 57058
- Home prices YoY
- 3.4%
- Active inventory
- 33
- Price-to-rent
- 8.0×
Monthly cashflow live
- Estimated rent
- $1,043 medium interval (Pro) →
- Mortgage (P&I)
- −$524
- Tax from tax record
- −$21 /mo · $253/yr
- Insurance
- −$42
- Flood insurance flood zone
- −$314 /mo · $3,765/yr
- HOA
- −$0
- Vacancy / Maint / Mgmt
- −$219
- Net cashflow
- $-77
Break-even live
Sensitivity live
| Price | -10% $-20 | -5% $-49 | +0% $-77 | +5% $-105 | +10% $-134 |
|---|---|---|---|---|---|
| Rent | -10% $-159 | -5% $-118 | +0% $-77 | +5% $-36 | +10% $5 |
| Rate | -1.0pp $-27 | -0.5pp $-51 | base $-77 | +0.5pp $-103 | +1.0pp $-129 |
UW: 25.0% down · 7.5% · 30yr · 1.5% tax · 5.0% vac · 8.0% maint · 8.0% mgmt
Financing live
Cash to close
- Down payment
- $25,000
- Closing costs
- $3,000
- Reserves months
- —
- Total cash needed
- —
Loan-product check · same deal, 3 products live
Conventional
25% down · 7.5% · 30yr
- Down + closing
- —
- Monthly P&I
- —
- Monthly cashflow
- —
- DSCR
- —
- Eligible?
- —
Personal DTI + credit; lowest rate.
DSCR
20% down · 8.5% · 30yr
- Down + closing
- —
- Monthly P&I
- —
- Monthly cashflow
- —
- DSCR
- —
- Eligible?
- —
No personal income docs; deal must DSCR.
Hard money
10% down · 12.0% · 12mo
- Down + closing
- —
- Monthly P&I
- —
- Monthly cashflow
- —
- DSCR
- —
- Eligible?
- —
Short-term bridge; refi at stabilization.
Listing history 3 events
-
2026-06-01days on market $100,000 Active 11 DOM
-
2026-05-31days on market $100,000 Active 10 DOM
-
2026-05-21$100,000 Active
ⓘ Source: listings_history table (triggers on properties + properties_extension) + one-shot
backfill from property_details.listing_events for pre-trigger history.
Tax reassessment forecast SD · Resets to sale price
- Current annual tax
- $253 · $21/mo
- Projected year-2 tax
- $1,310 · $109/mo
- Expected delta
- +$1,057/yr (+$88/mo · 417.6%)
ⓘ Screening estimate from a state-policy table — verify with the county assessor before closing.
Climate risk First Street
- Flood 1/10 Low FEMA zone A · 0% chance over 30 yrs
- Wildfire 4/10 Moderate
- Heat 2/10 Low 7 d/yr ≥101°F today · 14 d/yr by 30 yrs out
- Wind 2/10 Low
- Air quality 2/10 Low 1 unhealthy d/yr today · 1 by 30 yrs out
Nearby sold comps map
Loading sold comps map…
Walkable amenities ~0.75 mi
Loading nearby amenities…
Taxation est. · year 1
- Rental income
- $12,516
- − Mortgage interest
- −$5,602
- − Property taxes
- −$253
- − Insurance
- −$4,265
- − Repairs & maintenance
- −$1,001
- − Management
- −$1,001
- − Depreciation
- −$2,909
- Taxable loss
- −$2,515
- Est. tax savings @ 24.0%
- +$604
- After-tax cash flow
- $-319/yr
For passive investors: Depreciation is non-cash, so a rental often shows a tax loss while cash-flowing — sheltering income. Rental losses are passive: they offset passive income freely, and up to $25,000/yr can offset ordinary (W-2) income if you actively participate and your MAGI is under $100k (phasing out to $0 by $150k); unused losses carry forward. On sale, claimed depreciation is recaptured at up to 25%, and gains may owe capital-gains tax (a 1031 exchange can defer both). Figures are a year-1 estimate at your 24.0% rate — not tax advice; consult a CPA.
Schools (NCES district)
- District
- Mccook Central School District 43-7
- NCES district ID
- 4601026
- Math proficiency
- 44% ▲ 9.00%
- Reading proficiency
- 50% ▬ 0.00%
- Median HH income
- $50,476
- Composite
- 42.47/100
- National rank
- #6885
- State rank
- #87 of 148 in SD
Livability — Salem
- Score
- 72/100
- State rank
- #45
- US rank
- #6367
Category grades
Schools grade is shown separately in the Schools card above.
Census & demographics
- Census place
- Salem, SD
- Population (ZIP)
- 1,792
Population outlook (McCook County) Hauer SSP2
- Today (2025)
- 5,591 people
- By 2030
- 5,617 · +0.5%
- By 2040
- 5,771 · +3.2%
- By 2050
- 5,996 · +7.2%
- By 2075
- 7,870 · +40.8%
- By 2100
- 11,517 · +106.0%
Race, ethnicity, and origin ACS 2023
- Neighborhood character
- Predominantly White (93%)
- Race & ethnicity
- White 93% Hispanic / Latino 4% Native American 3% Two or more races 3%
- Common ancestry
- Iranian 10% Portuguese 6% Danish 1%
- Foreign-born
- 0%
- Languages at home
- 97% English-only · German/W. Germanic 2% Spanish 1%
Political lean MEDSL · McCook
- 2024 margin
- Solid R (+49.3) · D 24.2% · R 73.5% · Other 2.3%
- 2008→2024 swing
- -34.8pp toward R · 2008: -14.5pp · 2024: -49.3pp
- All cycles
- 2024: R+49.3 2020: R+44.8 2016: R+45.3 2012: R+28.7 2008: R+14.5
Not yet ingested
- Civics
- —
Market trends
- HPI YoY
- ▲ 10.27%
- Current HPI
- 310.2326
- Rent YoY
- —
- Metro
- —
- State GDP YoY
- ▲ 0.70%
- F500 in state
- 2
Industry mix (Fortune 500 HQ in SD)
| Industry | F500 HQs | Revenue |
|---|---|---|
| Utilities | 1 | $1B |
|
||
Price history
1 event — show timeline
- 2026-05-21 Listed $100,000 REALTOR® Association of the Sioux Empire
Property tax history
-13.9%/yrLatest (2025): $253 · -85.9% YoY. Source: county tax records.
Cash-flow waterfall
monthlySold comps — $/sqft
last 12 mo · ≤1 miLoading sold comps…