59 Downing Dr · Fruit Cove, FL
Flood risk No data
- FEMA flood zone
- —
- Chance of flooding over 30 yrs
- —
- Est. flood insurance / yr
- —
Fire risk No data
- Est. fire insurance / yr
- —
Heat risk No data
- Hot days now (above threshold)
- —
- Hot days in 30 yrs
- —
Wind risk No data
- Chance of severe wind over 30 yrs
- —
Air-quality risk No data
- Unhealthy air days now
- —
- Unhealthy air days in 30 yrs
- —
Risk factors via First Street. Map © Google.
Why this score? — see what drove the D+ grade
The composite is a weighted blend of 9 inputs, each scored 0–100. Each bar is that input's sub-score; the figure is the points it added to the 100-point composite (weight × sub-score).
- Cash flow +15.0/30.0
- ARV discount +7.5/15.0
- Schools +6.4/10.0
- DSCR +4.6/10.0
- 1% rule +4.4/10.0
- Livability +3.5/5.0
- Rent growth +2.5/5.0
- Condition / age +2.5/5.0
- Appreciation +0.0/10.0
$270,500
🖨 Deal sheet (PDF) 📄 Offer letter ✓ Due diligence
Listing remarks
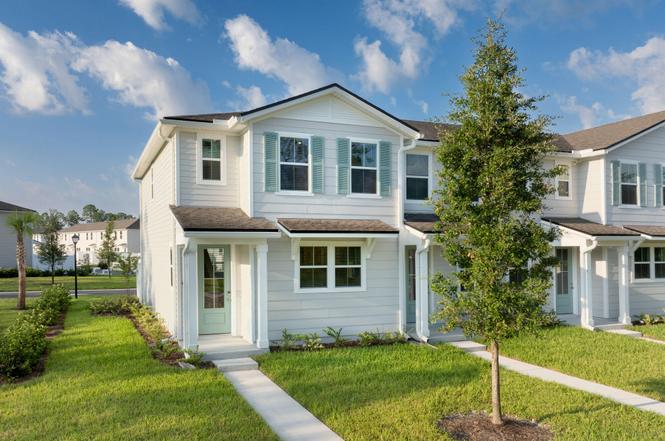
LOT 114 -The Davy kitchen takes center stage in the sleek, modern floorplan, opening directly into the home with an island and breakfast bar that overlooks the dining and living areas. This open-concept design creates a spacious, connected area ideal for family gatherings or entertaining guests. Thoughtfully designed for convenience, the first floor includes both laundry and powder rooms. Upstairs, the bedrooms offer privacy, with the owner's suite featuring an ensuite bath and located across from two additional bedrooms. These extra rooms are perfect for growing families, hosting guests, or welcoming back college students. Located in the master-planned RiverTown community along the scenic
Key facts
- Open-concept design
- First floor laundry
- Owner's suite
Tags
Neighborhood map
What this means for you Summary
Snapshot
- This is a 3-bed/2.5-bath land listed at $270k.
Deal economics
- At list price, monthly cash flow is $84 ($1k/yr) — positive.
- The deal already cash-flows at list — no discount required.
- To meet the 1% rule (rent ≥ 1% of price), the offer needs to be $255k (5.8% below list).
- Recommended offer: $254k (6.0% below list) — sets the bar for market timing.
- Cap rate 6.7% vs local median 2.9% in Fruit Cove — top-decile yield for the area; either an underpriced asset or a hidden risk that comps aren't pricing in. Stress-test before assuming the spread holds.
Location & tenants
- Location reads 69/100 on livability (#469 in FL) — a middle-class / working-renter tenant base. Strengths: crime A+, employment A+, housing A+; Watch: amenities F, commute F, cost of living F.
- St. Johns (rural): math 75% / reading 73% proficiency, ranked #2 of 73 in FL (top 3%) — strong family-tenant draw, lease renewals of 3-5y typical; only 20% free/reduced lunch — higher-income household profile.
- Zoned schools: Hickory Creek Elementary School (math 84% / reading 80%, grade A+, #79 of 2,144 statewide, top 4%, 793 students, 11% FRL); Switzerland Point Middle School (math 80% / reading 72%, grade A, #34 of 571 statewide, top 6%, 1,430 students, 5% FRL); Bartram Trail High School (math 68% / reading 75%, grade B+, #49 of 667 statewide, top 8%, 2,493 students, 4% FRL).
- Market conditions: Rents flat; 766 active listings in the ZIP; 2 comparable units currently listed for rent nearby; high-income renter base; 5,575 units permitted in St. Johns County in 2024 (584 in 5+ unit buildings).
Forward outlook
- Local home prices are declining (-3.0%/yr); year-one equity from $2k of loan paydown is wiped out by about $8k of value loss. Plan a longer hold.
- St. Johns County population projected at +60% by 2050 — long-run rental-demand tailwind backs the buy-and-hold thesis.
Negotiation context
- It's been on market 62 days — a 6% lower offer ($254k) is reasonable based on typical stale-listing flexibility.
Questions for the listing agent
- It's been on market 62 days. Have you received any prior offers? Is the seller open to a 6% concession, seller financing, or rate buy-down credit?
- What does the HOA fee cover, when was the last increase, and are there any pending special assessments or reserve-fund shortfalls?
- Why hasn't it sold? Are there any deal-killer items the seller is aware of (foundation, flood, title, zoning, code violations)?
- Is there a deadline driving the sale (1031 exchange, divorce, estate, relocation)? That informs how much negotiation room exists.
- Schools are A-rated — typically a magnet for longer-tenancy family renters. What's the average tenant stay here, and is there a school-zone premium baked into asking?
- The area grade is low — what's the realistic commute time and amenity access for the typical tenant pool here? Any planned neighborhood developments (good or bad) we should know about?
- What's the average days-on-market for RENTAL listings here right now (not sales)? A rising rental-DOM trend means longer vacancies and softer asking-rent achievability than the comps imply.
- What's the recent tenant-quality profile in this submarket — average credit score on applications, eviction rate, late-payment / NSF rate, and stable-employment percentage? A property-management company in the area should have these aggregated.
- How much new for-sale + rental construction is in the pipeline within 1–3 miles? Heavy new supply typically softens prices + rents 12–24 months out; constrained supply supports both.
Investment metrics
- 1% rule
- 0.94% ✗
- Cap rate
- 6.67%
- Cash-on-cash
- 1.34%
- DSCR
- 1.06
- GRM
- 8.8
CMA / ARV
No comps found within radius.
Projected returns pro-forma
-3.0% appreciation · 0.0% rent growth · sell at horizon
- IRR
- -17.7%
- Equity multiple
- 0.39×
- Total profit
- $-45,859
- Equity at exit
- $40,332
- IRR
- -17.2%
- Equity multiple
- 0.19×
- Total profit
- $-61,582
- Equity at exit
- $23,388
Cash invested: $75,740 (down + closing). Projections, not guarantees.
Landlord ↔ Tenant lean methodology
- Overall (STATE)
- 87 Strongly Landlord-Friendly
- State Florida
- 87 Strongly Landlord-Friendly · R+3
- County
- — inherits STATE
- City
- — inherits STATE
ZIP-level market 32259
- Home prices YoY
- -28.8%
- Rents YoY
- 0.0%
- Active inventory
- 766
- Price-to-rent
- 8.8×
Monthly cashflow live
- Estimated rent
- $2,549 medium interval (Pro) →
- Mortgage (P&I)
- −$1,419
- Tax from tax record
- −$227 /mo · $2,724/yr
- Insurance
- −$113
- HOA
- −$171
- Vacancy / Maint / Mgmt
- −$535
- Net cashflow
- $84
Break-even live
Sensitivity live
| Price | -10% $237 | -5% $161 | +0% $84 | +5% $8 | +10% $-69 |
|---|---|---|---|---|---|
| Rent | -10% $-117 | -5% $-16 | +0% $84 | +5% $185 | +10% $286 |
| Rate | -1.0pp $221 | -0.5pp $153 | base $84 | +0.5pp $14 | +1.0pp $-57 |
UW: 25.0% down · 7.5% · 30yr · 1.5% tax · 5.0% vac · 8.0% maint · 8.0% mgmt
Financing live
Cash to close
- Down payment
- $67,625
- Closing costs
- $8,115
- Reserves months
- —
- Total cash needed
- —
Loan-product check · same deal, 3 products live
Conventional
25% down · 7.5% · 30yr
- Down + closing
- —
- Monthly P&I
- —
- Monthly cashflow
- —
- DSCR
- —
- Eligible?
- —
Personal DTI + credit; lowest rate.
DSCR
20% down · 8.5% · 30yr
- Down + closing
- —
- Monthly P&I
- —
- Monthly cashflow
- —
- DSCR
- —
- Eligible?
- —
No personal income docs; deal must DSCR.
Hard money
10% down · 12.0% · 12mo
- Down + closing
- —
- Monthly P&I
- —
- Monthly cashflow
- —
- DSCR
- —
- Eligible?
- —
Short-term bridge; refi at stabilization.
Rent comps 2 comps
| Address | Beds | Baths | Sqft | Rent | $/sqft | DOM | Units | Dist |
|---|---|---|---|---|---|---|---|---|
| 45 Vicksburg Dr Saint Johns, FL | 3.0 | 2.0 | 1620 | $2,600 | $1.60 | 25d | 1 | 1.16mi |
| 84 Vicksburg Dr Saint Johns, FL | 4.0 | 2.0 | 1630 | $2,396 | $1.47 | 25d | 1 | 1.20mi |
HOA detail
- Monthly dues
- $171 · $2,052/yr
Listing history 3 events
-
2026-03-08status Pending
-
2026-02-19price $270,500
-
2026-01-05$270,990 Active
ⓘ Source: listings_history table (triggers on properties + properties_extension) + one-shot
backfill from property_details.listing_events for pre-trigger history.
Tax reassessment forecast FL · Resets to sale price
- Current annual tax
- $2,724 · $227/mo
- Projected year-2 tax
- $2,724 · $227/mo
- Expected delta
- $0/yr ($0/mo · 0.0%)
ⓘ Screening estimate from a state-policy table — verify with the county assessor before closing.
Nearby sold comps map
Loading sold comps map…
Walkable amenities ~0.75 mi
Loading nearby amenities…
Taxation est. · year 1
- Rental income
- $30,585
- − Mortgage interest
- −$15,152
- − Property taxes
- −$2,724
- − Insurance
- −$1,352
- − Repairs & maintenance
- −$2,447
- − Management
- −$2,447
- − HOA
- −$2,052
- − Depreciation
- −$7,869
- Taxable loss
- −$3,458
- Est. tax savings @ 24.0%
- +$830
- After-tax cash flow
- $1,841/yr
For passive investors: Depreciation is non-cash, so a rental often shows a tax loss while cash-flowing — sheltering income. Rental losses are passive: they offset passive income freely, and up to $25,000/yr can offset ordinary (W-2) income if you actively participate and your MAGI is under $100k (phasing out to $0 by $150k); unused losses carry forward. On sale, claimed depreciation is recaptured at up to 25%, and gains may owe capital-gains tax (a 1031 exchange can defer both). Figures are a year-1 estimate at your 24.0% rate — not tax advice; consult a CPA.
Schools (NCES district)
- District
- St. Johns
- NCES district ID
- 1201740
- Math proficiency
- 75% ▼ -5.00%
- Reading proficiency
- 73% ▼ -2.00%
- Median HH income
- $66,842
- Composite
- 64.31/100
- National rank
- #556
- State rank
- #2 of 73 in FL
Livability — Fruit Cove
- Score
- 69/100
- State rank
- #469
- US rank
- #8490
Category grades
Schools grade is shown separately in the Schools card above.
Census & demographics
- County
- Saint Johns County · 301,599 people
- Metro
- Jacksonville, FL
- Population (ZIP)
- 75,016
- Household income
- $150,736
- Rent vs Own
- Severe rent burden
- 727.0
Population outlook (St. Johns County) Hauer SSP2
- Today (2025)
- 303,941 people
- By 2030
- 342,590 · +12.7%
- By 2040
- 417,328 · +37.3%
- By 2050
- 487,011 · +60.2%
- By 2075
- 635,395 · +109.1%
- By 2100
- 717,469 · +136.1%
Race, ethnicity, and origin ACS 2023
- Neighborhood character
- Predominantly White (73%)
- Race & ethnicity
- White 73% Two or more races 11% Hispanic / Latino 9% Black 6% Asian 6%
- Hispanic origin (detail)
- Puerto Rican 2% Cuban 1%
- Common ancestry
- Romanian 2% Lithuanian 2% Slovak 2%
- Foreign-born
- 13% · Canada, Jamaica, China
- Languages at home
- 86% English-only · Spanish 5% Other Indo-European 4% Other Asian/Pacific 2%
Political lean MEDSL · St. Johns
- 2024 margin
- Solid R (+31.4) · D 33.9% · R 65.2%
- 2008→2024 swing
- +0.2pp no change · 2008: -31.6pp · 2024: -31.4pp
- All cycles
- 2024: R+31.4 2020: R+26.7 2016: R+33.4 2012: R+37.8 2008: R+31.6
Not yet ingested
- Civics
- —
Market trends
- HPI YoY
- ▼ -105.54%
- Current HPI
- 261.2552
- Rent YoY
- ▬ 0.00%
- Metro
- Jacksonville, FL
- State GDP YoY
- ▲ 3.28%
- F500 in state
- 36
Industry mix (Fortune 500 HQ in FL)
| Industry | F500 HQs | Revenue |
|---|---|---|
| Industrial Technology | 2 | $29B |
|
||
| Insurance | 2 | $17B |
|
||
| Retail | 1 | $60B |
|
||
| Technology Distribution | 1 | $58B |
|
||
| Homebuilding | 1 | $35B |
|
||
| Technology Manufacturing | 1 | $35B |
|
||
Price history
-0.2% since first listed3 events — show timeline
- 2026-03-08 Pending — realMLS
- 2026-02-19 Price Changed $270,500 realMLS
- 2026-01-05 Listed $270,990 realMLS
Property tax history
+10.2%/yrLatest (2025): $2,724 · +10.2% YoY. Source: county tax records.
Cash-flow waterfall
monthlySold comps — $/sqft
last 12 mo · ≤1 miLoading sold comps…