4505 Prospect Rd · Jonesboro, AR
Flood risk 1/10 · Minimal
- FEMA flood zone
- —
- Chance of flooding over 30 yrs
- 0.0%
- Est. flood insurance / yr
- —
Fire risk 4/10 · Minor
- Est. fire insurance / yr
- $1,499 – $2,785
Heat risk 5/10 · Moderate
- Hot days now (above 108°F)
- 7 days/yr
- Hot days in 30 yrs
- 21 days/yr
Wind risk 4/10 · Minor
- Chance of severe wind over 30 yrs
- 8.0%
Air-quality risk 2/10 · Minimal
- Unhealthy air days now
- 0 days/yr
- Unhealthy air days in 30 yrs
- 1 days/yr
Risk factors via First Street. Map © Google.
Why this score? — see what drove the B- grade
The composite is a weighted blend of 9 inputs, each scored 0–100. Each bar is that input's sub-score; the figure is the points it added to the 100-point composite (weight × sub-score).
- Cash flow +21.1/30.0
- ARV discount +15.0/15.0
- Appreciation +9.7/10.0
- DSCR +6.7/10.0
- 1% rule +4.7/10.0
- Livability +3.2/5.0
- Rent growth +2.5/5.0
- Condition / age +2.5/5.0
- Schools +1.9/10.0
$209,900
🖨 Deal sheet 📄 Offer letter ✓ Due diligence
Listing remarks MLS
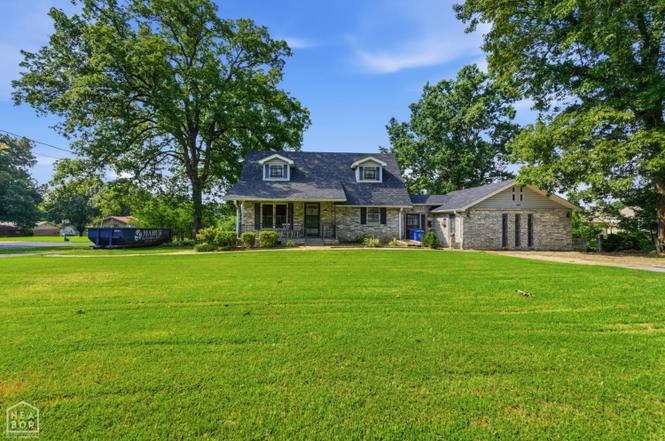
Welcome to 4505 Prospect Road, a property packed with potential and ready for your personal touch! Situated on approximately half an acre, this spacious 4-bedroom, 1.5-bath home offers the kind of space and flexibility that's hard to find. Inside, you'll find two living areas, providing plenty of room for entertaining, relaxing, or creating the layout that best fits your lifestyle. The sunroom offers a bright and inviting space to enjoy your morning coffee or unwind at the end of the day. Outside, the large detached shop provides endless possibilities for storage, hobbies, projects, or a workspace. While the home could benefit from some TLC and updates, the solid footprint, generous lot size, and desirable features make it an excellent opportunity for homeowners, investors, or anyone looking to build equity. If you've been searching for a property with great bones, plenty of space, and unlimited potential, 4505 Prospect Road is worth a look!
Key facts
- Sunroom
- Two living areas
- Large shop
Tags
Property features AI
Exterior
- Parking: Parking pads
- Utilities: Public sewer; Public water
- Home design: Brick exterior
- Construction: Architectural shingle roof; Slab/crawlspace combination foundation
- Exterior features: Level lot; Paved road access; Inside city limits
Interior
- Kitchen: Gas range; Dishwasher
- Flooring: Wood; Vinyl; Laminate; Other (see remarks)
- Bathrooms: 1 full bathroom; 1 half bathroom
- Heating & cooling: Central electric heat; Central electric cooling
- Interior features: Wood, vinyl, laminate and other flooring; Den/Family room; Sun room
Neighborhood map
What this means for you Summary
Snapshot
- This is a 4-bed/2.5-bath single-family listed at $210k.
Deal economics
- At list price, monthly cash flow is $299 ($4k/yr) — positive.
- The deal already cash-flows at list — no discount required.
- To meet the 1% rule (rent ≥ 1% of price), the offer needs to be $204k (2.8% below list).
- Recommended offer: $204k (2.8% below list) — sets the bar for 1% rule.
- Cap rate 8.0% vs local median 4.4% in Jonesboro — top-decile yield for the area; either an underpriced asset or a hidden risk that comps aren't pricing in. Stress-test before assuming the spread holds.
Location & tenants
- Location reads 65/100 on livability (#145 in AR) — a middle-class / working-renter tenant base. Strengths: cost of living A+, housing A+, health & safety A+; Watch: schools D, crime F, amenities F.
- Nettleton School District (urban): math 21% / reading 24% proficiency, ranked #199 of 238 in AR (top 84%) — low school quality limits family demand, transient renter base, plan for 1-2y turnover.
- Market conditions: 152 active listings in the ZIP; 2 comparable units currently listed for rent nearby; solid renter incomes; 926 units permitted in Craighead County in 2024 (69 in 5+ unit buildings).
Forward outlook
- In year one you build about $21k of equity ($1k loan paydown + $20k appreciation (9.4% local appreciation)).
- Craighead County population projected at +38% by 2050 — long-run rental-demand tailwind backs the buy-and-hold thesis.
- At projected returns (9.4% appreciation + 3.0% rent growth), your $59k cash investment doubles in ~3 years — after that, you're playing with house money.
- By year 2, paydown + projected appreciation supports a ~$34k cash-out refi (75% LTV) — recoverable capital for the next deal without selling this one.
Negotiation context
- Only 8 days on market — expect competitive offers; lowballing is unlikely to land.
- 2 sale attempts with the ask held roughly flat each time — persistent listings suggest the price (not the market) is what's stuck; bring a comps-based counter.
Risks & watch-outs
- Climate carrying-cost: extreme-heat days projected 7→21/yr by 2055 (HVAC capex compounding) — expect insurance premiums to compound above CPI over the hold.
Questions for the listing agent
- Is there a deadline driving the sale (1031 exchange, divorce, estate, relocation)? That informs how much negotiation room exists.
- Schools are D-rated, which usually means shorter tenancies and higher turnover. Who's the typical renter profile here, and what's been the actual vacancy rate?
- Crime grade is F in this area — have there been break-ins, vandalism, or insurance claims at this property in the last 3 years? What carrier currently insures it and at what premium?
- What's the average days-on-market for RENTAL listings here right now (not sales)? A rising rental-DOM trend means longer vacancies and softer asking-rent achievability than the comps imply.
- What's the recent tenant-quality profile in this submarket — average credit score on applications, eviction rate, late-payment / NSF rate, and stable-employment percentage? A property-management company in the area should have these aggregated.
- How much new for-sale + rental construction is in the pipeline within 1–3 miles? Heavy new supply typically softens prices + rents 12–24 months out; constrained supply supports both.
Investment metrics
- 1% rule
- 0.97% ✗
- Cap rate
- 8.00%
- Cash-on-cash
- 6.11%
- DSCR
- 1.27
- GRM
- 8.6
CMA / ARV
- ARV (on-the-fly)
- $290,878
- Comps found
- 12
Show comp detail 12 sales within ~0.75 mi
| Address | Dist | Beds/Ba | Sqft | Sold | Price | $/sf | Match |
|---|---|---|---|---|---|---|---|
| 4837 Edgemont Dr | 0.38mi | 4/2.0 | 1,819 (-1%) | 2mo | $294,990 | $162 | 77 |
| 4108 Stoke Dr | 0.30mi | 4/2.5 | 2,069 (+12%) | 1mo | $330,000 | $159 | 65 |
| 4208 Bobcat Meadow Ln | 0.48mi | 3/2.0 (-1) | 1,911 (+4%) | 2mo | $297,500 | $156 | 63 |
| 4145 Lynx | 0.52mi | 3/2.0 (-1) | 1,887 (+2%) | 2mo | $303,900 | $161 | 63 |
| 300 Prospect Trl | 0.50mi | 3/2.0 (-1) | 1,924 (+4%) | 1mo | $125,000 | $65 | 61 |
| 4307 Cypress Springs Rd | 0.40mi | 3/2.0 (-1) | 1,680 (-9%) | 1mo | $255,000 | $152 | 59 |
| 280 Prospect Farm Ln | 0.48mi | 3/2.0 (-1) | 1,698 (-8%) | 1mo | $246,900 | $145 | 57 |
| 4117 Bobcat Meadow Ln | 0.51mi | 3/2.0 (-1) | 1,699 (-8%) | 1mo | $284,900 | $168 | 56 |
| 4101 Stephanie Ln | 0.42mi | 5/2.5 (+1) | 2,048 (+11%) | 1mo | $276,000 | $135 | 56 |
| 712 Edgemont Cir | 0.49mi | 3/2.0 (-1) | 1,672 (-9%) | 2mo | $283,990 | $170 | 53 |
| 4811 Yukon Dr | 0.60mi | 3/2.0 (-1) | 1,680 (-9%) | 1mo | $235,000 | $140 | 50 |
| 4701 Edgemont | 0.63mi | 3/2.0 (-1) | 1,681 (-9%) | 1mo | $265,000 | $158 | 48 |
Match score weights: distance 35% · size 25% · config 20% · recency 20%. Top-matched comps best support the ARV.
Projected returns pro-forma
9.42% appreciation · 3.0% rent growth · sell at horizon
- IRR
- 27.6%
- Equity multiple
- 3.13×
- Total profit
- $125,037
- Equity at exit
- $180,276
- IRR
- 24.2%
- Equity multiple
- 6.98×
- Total profit
- $351,172
- Equity at exit
- $379,755
Cash invested: $58,772 (down + closing). Projections, not guarantees.
Landlord ↔ Tenant lean methodology
- Overall (STATE)
- 92 Strongly Landlord-Friendly
- State Arkansas
- 92 Strongly Landlord-Friendly · R+14
- County
- — inherits STATE
- City
- — inherits STATE
ZIP-level market 72405
- Home prices YoY
- 3.5%
- Active inventory
- 152
- Price-to-rent
- 8.6×
Monthly cashflow live
- Estimated rent
- $2,040 medium interval (Pro) →
- Mortgage (P&I)
- −$1,101
- Tax from tax record
- −$124 /mo · $1,487/yr
- Insurance
- −$87
- HOA
- −$0
- Vacancy / Maint / Mgmt
- −$428
- Net cashflow
- $299
Break-even live
UW: 25.0% down · 7.5% · 30yr · 1.5% tax · 5.0% vac · 8.0% maint · 8.0% mgmt
Financing live
Cash to close
- Down payment
- $52,475
- Closing costs
- $6,297
- Reserves months
- —
- Total cash needed
- —
Loan-product check · same deal, 3 products live
Conventional
25% down · 7.5% · 30yr
- Down + closing
- —
- Monthly P&I
- —
- Monthly cashflow
- —
- DSCR
- —
- Eligible?
- —
Personal DTI + credit; lowest rate.
DSCR
20% down · 8.5% · 30yr
- Down + closing
- —
- Monthly P&I
- —
- Monthly cashflow
- —
- DSCR
- —
- Eligible?
- —
No personal income docs; deal must DSCR.
Hard money
10% down · 12.0% · 12mo
- Down + closing
- —
- Monthly P&I
- —
- Monthly cashflow
- —
- DSCR
- —
- Eligible?
- —
Short-term bridge; refi at stabilization.
Rent comps 2 comps
| Address | Beds | Baths | Sqft | Rent | $/sqft | DOM | Units | Dist |
|---|---|---|---|---|---|---|---|---|
| 337 Wolf Den Dr Jonesboro, AR | 3.0 | 2.0 | 1419 | $1,600 | $1.13 | 43d | 1 | 0.32mi |
| 259 Wolf Den Dr Jonesboro, AR | 3.0 | 2.0 | 1419 | $1,550 | $1.09 | 43d | 1 | 0.50mi |
Listing history 8 events
-
2026-06-19days on market $209,900 Active 8 DOM
-
2026-06-18statusdays on market $209,900 Active 7 DOM
-
2026-06-17days on market $209,900 New Listing 6 DOM
-
2026-06-16days on market $209,900 New Listing 5 DOM
-
2026-06-15days on market $209,900 New Listing 4 DOM
-
2026-06-14days on market $209,900 New Listing 2 DOM
-
2026-06-13remarks 699-char remark
-
2026-06-13$209,900 New Listing 1 DOM
ⓘ Source: listings_history table (triggers on properties + properties_extension) + one-shot
backfill from property_details.listing_events for pre-trigger history.
Tax reassessment forecast AR · Resets to sale price
- Current annual tax
- $1,487 · $124/mo
- Projected year-2 tax
- $1,487 · $124/mo
- Expected delta
- $0/yr ($0/mo · 0.0%)
ⓘ Screening estimate from a state-policy table — verify with the county assessor before closing.
Climate risk First Street
- Flood 1/10 Low 0% chance over 30 yrs
- Wildfire 4/10 Moderate
- Heat 5/10 Major 7 d/yr ≥108°F today · 21 d/yr by 30 yrs out
- Wind 4/10 Moderate 8% chance of damaging wind over 30 yrs
- Air quality 2/10 Low 0 unhealthy d/yr today · 1 by 30 yrs out
Nearby sold comps map
Loading sold comps map…
Walkable amenities ~0.75 mi
Loading nearby amenities…
Taxation est. · year 1
- Rental income
- $24,477
- − Mortgage interest
- −$11,758
- − Property taxes
- −$1,487
- − Insurance
- −$1,050
- − Repairs & maintenance
- −$1,958
- − Management
- −$1,958
- − Depreciation
- −$6,106
- Taxable income
- $161
- Est. tax owed @ 24.0%
- −$39
- After-tax cash flow
- $3,553/yr
For passive investors: Depreciation is non-cash, so a rental often shows a tax loss while cash-flowing — sheltering income. Rental losses are passive: they offset passive income freely, and up to $25,000/yr can offset ordinary (W-2) income if you actively participate and your MAGI is under $100k (phasing out to $0 by $150k); unused losses carry forward. On sale, claimed depreciation is recaptured at up to 25%, and gains may owe capital-gains tax (a 1031 exchange can defer both). Figures are a year-1 estimate at your 24.0% rate — not tax advice; consult a CPA.
Schools (NCES district)
- District
- Nettleton School District
- NCES district ID
- 0510440
- Math proficiency
- 21% ▼ -16.00%
- Reading proficiency
- 24% ▼ -12.00%
- Median HH income
- $39,754
- Composite
- 19.0/100
- National rank
- #8846
- State rank
- #199 of 238 in AR
Livability — Jonesboro
- Score
- 65/100
- State rank
- #145
- US rank
- #12692
Category grades
Schools grade is shown separately in the Schools card above.
Census & demographics
- Census place
- Jonesboro, AR
- County
- Craighead County · 97,185 people
- City population
- 91,245
- Metro
- Jonesboro, AR
- Population (ZIP)
- 18,675
- Household income
- $92,440
- Rent vs Own
- Severe rent burden
- 443.0
Population outlook (Craighead County) Hauer SSP2
- Today (2025)
- 122,235 people
- By 2030
- 131,338 · +7.4%
- By 2040
- 149,862 · +22.6%
- By 2050
- 168,034 · +37.5%
- By 2075
- 208,094 · +70.2%
- By 2100
- 233,251 · +90.8%
Race, ethnicity, and origin ACS 2023
- Neighborhood character
- Predominantly White (78%)
- Race & ethnicity
- White 78% Two or more races 10% Black 9% Hispanic / Latino 3% Asian 1%
- Common ancestry
- Slovak 2% Italian 1% Serbian 1%
- Foreign-born
- 4% · Canada
- Languages at home
- 93% English-only · Spanish 4% Arabic 1%
Political lean MEDSL · Craighead
- 2024 margin
- Solid R (+37.4) · D 30.1% · R 67.5% · Other 2.4%
- 2008→2024 swing
- -12.9pp toward R · 2008: -24.5pp · 2024: -37.4pp
- All cycles
- 2024: R+37.4 2020: R+35.4 2016: R+35.2 2012: R+31.1 2008: R+24.5
Not yet ingested
- Civics
- —
Market trends
- HPI YoY
- ▲ 9.42%
- Current HPI
- 277.37
- Rent YoY
- —
- Metro
- Jonesboro, AR
- State GDP YoY
- ▲ 3.80%
- F500 in state
- 10
Industry mix (Fortune 500 HQ in AR)
| Industry | F500 HQs | Revenue |
|---|---|---|
| Retail | 1 | $681B |
|
||
| Food / Agriculture | 1 | $53B |
|
||
| Retail / Energy | 1 | $22B |
|
||
| Transportation / Logistics | 1 | $12B |
|
||
| Energy | 1 | $4B |
|
||
Price history
+0.0% since first listed2 events — show timeline
- 2026-06-11 Listed $209,900 CARMLS
- 2026-06-11 Listed $209,900 NEABOR MLS
Property tax history
+10.0%/yrLatest (2025): $1,487 · +10.3% YoY. Source: county tax records.
Cash-flow waterfall
monthlySold comps — $/sqft
last 12 mo · ≤1 miLoading sold comps…