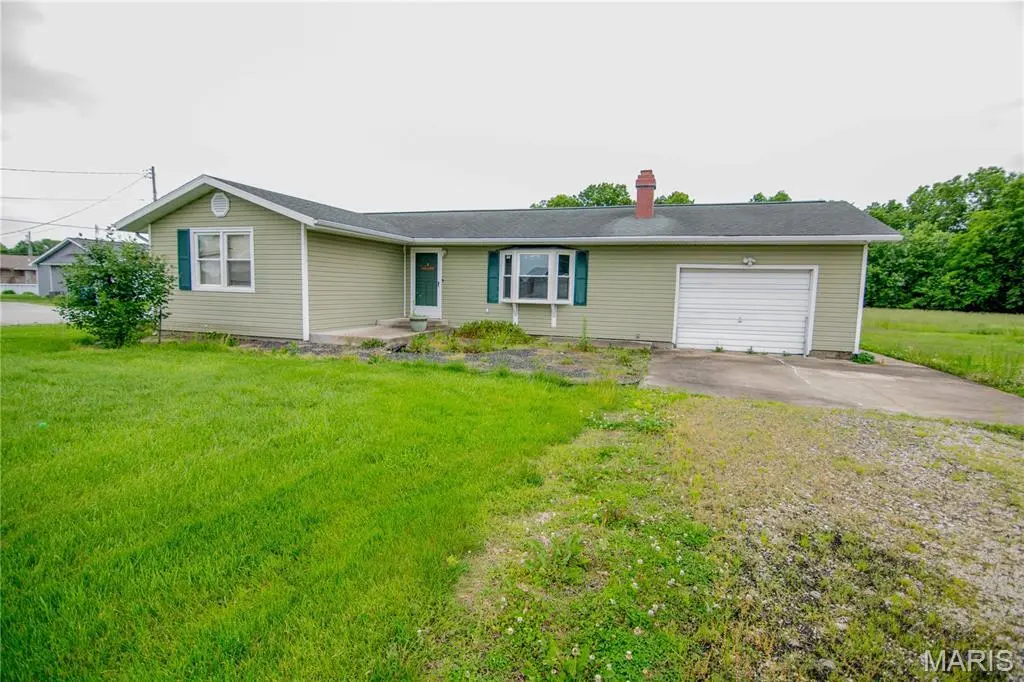
408 E 1st St · Ramsey, IL
Flood risk 1/10 · Minimal
- FEMA flood zone
- —
- Chance of flooding over 30 yrs
- 0.0%
- Est. flood insurance / yr
- —
Fire risk 1/10 · Minimal
- Est. fire insurance / yr
- $804 – $1,492
Heat risk 4/10 · Minor
- Hot days now (above 104°F)
- 7 days/yr
- Hot days in 30 yrs
- 20 days/yr
Wind risk 2/10 · Minimal
- Chance of severe wind over 30 yrs
- 3.0%
Air-quality risk 2/10 · Minimal
- Unhealthy air days now
- 1 days/yr
- Unhealthy air days in 30 yrs
- 2 days/yr
Risk factors via First Street. Map © Google.
Why this score? — see what drove the B+ grade
The composite is a weighted blend of 9 inputs, each scored 0–100. Each bar is that input's sub-score; the figure is the points it added to the 100-point composite (weight × sub-score).
- Cash flow +30.0/30.0
- DSCR +10.0/10.0
- 1% rule +9.6/10.0
- Appreciation +7.6/10.0
- ARV discount +7.5/15.0
- Livability +3.1/5.0
- Schools +2.7/10.0
- Rent growth +2.5/5.0
- Condition / age +2.5/5.0
$74,000
🖨 Deal sheet 📄 Offer letter ✓ Due diligence
Listing remarks
Looking for your next project? This could be the opportunity you've been waiting for! Built in 1977, this 3-bedroom, 1-bathroom home offers 1,184 square feet of potential and is ready for someone to bring it back to life. Included with the sale is the additional lot next door, giving you just over a half-acre of space with plenty of room to expand, garden, or simply enjoy extra privacy. While the home does need repairs and updates, it offers a solid opportunity for an investor, handyman, or buyer looking to create their own space. This bank-owned property is being sold strictly as-is. Don’t miss your chance to unlock the potential this property has to offer! Get in touch today to see
Key facts
- Additional lot
- Half-acre of space
- 0.56 acre lot
Tags
Property features AI
Exterior
- Parking: Attached garage with space for 1 vehicle
- Utilities: Public water; Public sewer; Electricity connected (single phase)
- Home design: Attached single-family residence; One story
- Construction: Vinyl siding; Block foundation
- Exterior features: Level lot; Shed(s)
Interior
- Bedrooms: Three bedrooms, all on the main level
- Bathrooms: One full bathroom on the main level
- Heating & cooling: Radiant ceiling heat; Central air conditioning
- Interior features: Crawl space basement; Living room fireplace (wood burning)
Neighborhood map
What this means for you Summary
Snapshot
- This is a 3-bed/1.0-bath other listed at $74k.
Deal economics
- At list price, monthly cash flow is $312 ($4k/yr) — positive.
- The deal already cash-flows at list — no discount required.
- Meets the 1% rule at list price ($1k rent vs $74k).
- Recommended offer: $73k (1.5% below list) — sets the bar for market timing.
Location & tenants
- Location reads 62/100 on livability (#887 in IL) — a middle-class / working-renter tenant base. Strengths: cost of living A+, housing A-; Watch: crime D-, amenities F, commute F.
- Ramsey CUSD 204 (rural): math 23% / reading 42% proficiency, ranked #233 of 620 in IL (top 38%) — families likely to look elsewhere, expect single-tenant / working-renter base with shorter leases.
- Zoned schools: Ramsey High School (math 22% / reading 37%, grade F, #187 of 693 statewide, top 30%, 206 students, 0% FRL) — zoned schools average 0% FRL vs 48% district-wide (48 pts lower); this property's tenant base skews higher-income than the district average.
- Market conditions: 8 active listings in the ZIP.
Forward outlook
- In year one you build about $4k of equity ($512 loan paydown + $4k appreciation (5.2% local appreciation)).
- Fayette County population projected to shrink 9% by 2050 — rents likely to lag national; underwrite the cash flow, not the appreciation.
- At projected returns (5.2% appreciation + 3.0% rent growth), your $21k cash investment doubles in ~3 years — after that, you're playing with house money.
- By year 8, paydown + projected appreciation supports a ~$33k cash-out refi (75% LTV) — recoverable capital for the next deal without selling this one.
Negotiation context
- It's been on market 27 days — a 2% lower offer ($73k) is reasonable based on typical stale-listing flexibility.
Questions for the listing agent
- Built in 1977 — when were the roof, HVAC, electrical panel, plumbing, and water heater last replaced?
- Is there a deadline driving the sale (1031 exchange, divorce, estate, relocation)? That informs how much negotiation room exists.
- Schools are F-rated, which usually means shorter tenancies and higher turnover. Who's the typical renter profile here, and what's been the actual vacancy rate?
- Crime grade is D in this area — have there been break-ins, vandalism, or insurance claims at this property in the last 3 years? What carrier currently insures it and at what premium?
- What's the average days-on-market for RENTAL listings here right now (not sales)? A rising rental-DOM trend means longer vacancies and softer asking-rent achievability than the comps imply.
- What's the recent tenant-quality profile in this submarket — average credit score on applications, eviction rate, late-payment / NSF rate, and stable-employment percentage? A property-management company in the area should have these aggregated.
- How much new for-sale + rental construction is in the pipeline within 1–3 miles? Heavy new supply typically softens prices + rents 12–24 months out; constrained supply supports both.
Investment metrics
- 1% rule
- 1.46% ✓
- Cap rate
- 11.36%
- Cash-on-cash
- 18.09%
- DSCR
- 1.80
- GRM
- 5.7
CMA / ARV
No comps found within radius.
Projected returns pro-forma
5.17% appreciation · 3.0% rent growth · sell at horizon
- IRR
- 28.9%
- Equity multiple
- 2.82×
- Total profit
- $37,704
- Equity at exit
- $42,705
- IRR
- 27.6%
- Equity multiple
- 5.66×
- Total profit
- $96,533
- Equity at exit
- $74,348
Cash invested: $20,720 (down + closing). Projections, not guarantees.
Landlord ↔ Tenant lean methodology
- Overall (STATE)
- 43 Moderately Tenant-Leaning
- State Illinois
- 43 Moderately Tenant-Leaning · D+7
- County
- — inherits STATE
- City
- — inherits STATE
ZIP-level market 62080
- Home prices YoY
- 3.3%
- Active inventory
- 8
- Price-to-rent
- 5.7×
Monthly cashflow live
- Estimated rent
- $1,081 medium interval (Pro) →
- Mortgage (P&I)
- −$388
- Tax from tax record
- −$122 /mo · $1,470/yr
- Insurance
- −$31
- HOA
- −$0
- Vacancy / Maint / Mgmt
- −$227
- Net cashflow
- $312
Break-even live
UW: 25.0% down · 7.5% · 30yr · 1.5% tax · 5.0% vac · 8.0% maint · 8.0% mgmt
Financing live
Cash to close
- Down payment
- $18,500
- Closing costs
- $2,220
- Reserves months
- —
- Total cash needed
- —
Loan-product check · same deal, 3 products live
Conventional
25% down · 7.5% · 30yr
- Down + closing
- —
- Monthly P&I
- —
- Monthly cashflow
- —
- DSCR
- —
- Eligible?
- —
Personal DTI + credit; lowest rate.
DSCR
20% down · 8.5% · 30yr
- Down + closing
- —
- Monthly P&I
- —
- Monthly cashflow
- —
- DSCR
- —
- Eligible?
- —
No personal income docs; deal must DSCR.
Hard money
10% down · 12.0% · 12mo
- Down + closing
- —
- Monthly P&I
- —
- Monthly cashflow
- —
- DSCR
- —
- Eligible?
- —
Short-term bridge; refi at stabilization.
Listing history 17 events
-
2026-06-18days on market $74,000 Active 27 DOM
-
2026-06-17days on market $74,000 Active 26 DOM
-
2026-06-16days on market $74,000 Active 25 DOM
-
2026-06-15days on market $74,000 Active 24 DOM
-
2026-06-13days on market $74,000 Active 22 DOM
-
2026-06-12days on market $74,000 Active 21 DOM
-
2026-06-09days on market $74,000 Active 18 DOM
-
2026-06-08days on market $74,000 Active 17 DOM
-
2026-06-07days on market $74,000 Active 16 DOM
-
2026-06-07days on market $74,000 Active 15 DOM
-
2026-06-04days on market $74,000 Active 12 DOM
-
2026-06-02days on market $74,000 Active 11 DOM
-
2026-06-01days on market $74,000 Active 10 DOM
-
2026-05-31days on market $74,000 Active 9 DOM
-
2026-05-31days on market $74,000 Active 8 DOM
-
2026-05-22$74,000 Active
-
2020-11-09soldstatus $80,000
ⓘ Source: listings_history table (triggers on properties + properties_extension) + one-shot
backfill from property_details.listing_events for pre-trigger history.
Tax reassessment forecast IL · Partial reset (capped growth)
- Current annual tax
- $1,470 · $122/mo
- Projected year-2 tax
- $1,575 · $131/mo
- Expected delta
- +$105/yr (+$9/mo · 7.1%)
ⓘ Screening estimate from a state-policy table — verify with the county assessor before closing.
Climate risk First Street
- Flood 1/10 Low 0% chance over 30 yrs
- Wildfire 1/10 Low
- Heat 4/10 Moderate 7 d/yr ≥104°F today · 20 d/yr by 30 yrs out
- Wind 2/10 Low 3% chance of damaging wind over 30 yrs
- Air quality 2/10 Low 1 unhealthy d/yr today · 2 by 30 yrs out
Nearby sold comps map
Loading sold comps map…
Walkable amenities ~0.75 mi
Loading nearby amenities…
Taxation est. · year 1
- Rental income
- $12,967
- − Mortgage interest
- −$4,145
- − Property taxes
- −$1,470
- − Insurance
- −$370
- − Repairs & maintenance
- −$1,037
- − Management
- −$1,037
- − Depreciation
- −$2,153
- Taxable income
- $2,755
- Est. tax owed @ 24.0%
- −$661
- After-tax cash flow
- $3,086/yr
For passive investors: Depreciation is non-cash, so a rental often shows a tax loss while cash-flowing — sheltering income. Rental losses are passive: they offset passive income freely, and up to $25,000/yr can offset ordinary (W-2) income if you actively participate and your MAGI is under $100k (phasing out to $0 by $150k); unused losses carry forward. On sale, claimed depreciation is recaptured at up to 25%, and gains may owe capital-gains tax (a 1031 exchange can defer both). Figures are a year-1 estimate at your 24.0% rate — not tax advice; consult a CPA.
Schools (NCES district)
- District
- Ramsey CUSD 204
- NCES district ID
- 1733090
- Math proficiency
- 23% ▼ -6.00%
- Reading proficiency
- 42% ▼ -2.00%
- Median HH income
- $39,290
- Composite
- 27.18/100
- National rank
- #7023
- State rank
- #233 of 620 in IL
Livability — Ramsey
- Score
- 62/100
- State rank
- #887
- US rank
- #17279
Category grades
Schools grade is shown separately in the Schools card above.
Census & demographics
- Census place
- Ramsey, IL
- City population
- 3,056
- Population (ZIP)
- 3,056
Population outlook (Fayette County) Hauer SSP2
- Today (2025)
- 21,667 people
- By 2030
- 21,362 · -1.4%
- By 2040
- 20,602 · -4.9%
- By 2050
- 19,669 · -9.2%
- By 2075
- 16,870 · -22.1%
- By 2100
- 12,861 · -40.6%
Race, ethnicity, and origin ACS 2023
- Neighborhood character
- Predominantly White (89%)
- Race & ethnicity
- White 89% Two or more races 10% Hispanic / Latino 5%
- Common ancestry
- Lithuanian 4% Romanian 2% Iranian 1%
- Foreign-born
- 0%
- Languages at home
- 99% English-only · Spanish 1%
Political lean MEDSL · Fayette
- 2024 margin
- Solid R (+64.7) · D 17.0% · R 81.7% · Other 1.3%
- 2008→2024 swing
- -48.9pp toward R · 2008: -15.8pp · 2024: -64.7pp
- All cycles
- 2024: R+64.7 2020: R+61.8 2016: R+58.3 2012: R+34.6 2008: R+15.8
Not yet ingested
- Civics
- —
Market trends
- HPI YoY
- ▲ 5.17%
- Current HPI
- 163.3277
- Rent YoY
- —
- Metro
- —
- State GDP YoY
- ▲ 1.59%
- F500 in state
- 60
Industry mix (Fortune 500 HQ in IL)
| Industry | F500 HQs | Revenue |
|---|---|---|
| Insurance | 4 | $201B |
|
||
| Consumer Goods | 4 | $87B |
|
||
| Industrial Machinery | 3 | $64B |
|
||
| Healthcare | 2 | $55B |
|
||
| Retail / Pharmacy | 1 | $148B |
|
||
| Agriculture / Food | 1 | $86B |
|
||
Price history
-7.5% since first listed2 events — show timeline
- 2026-05-22 Listed $74,000 MARIS as Distributed by MLS Grid
- 2020-11-09 Sold (Public Records) $80,000 Public Records
Property tax history
+1.7%/yrLatest (2024): $1,470 · +13.0% YoY. Source: county tax records.
Cash-flow waterfall
monthlySold comps — $/sqft
last 12 mo · ≤1 miLoading sold comps…