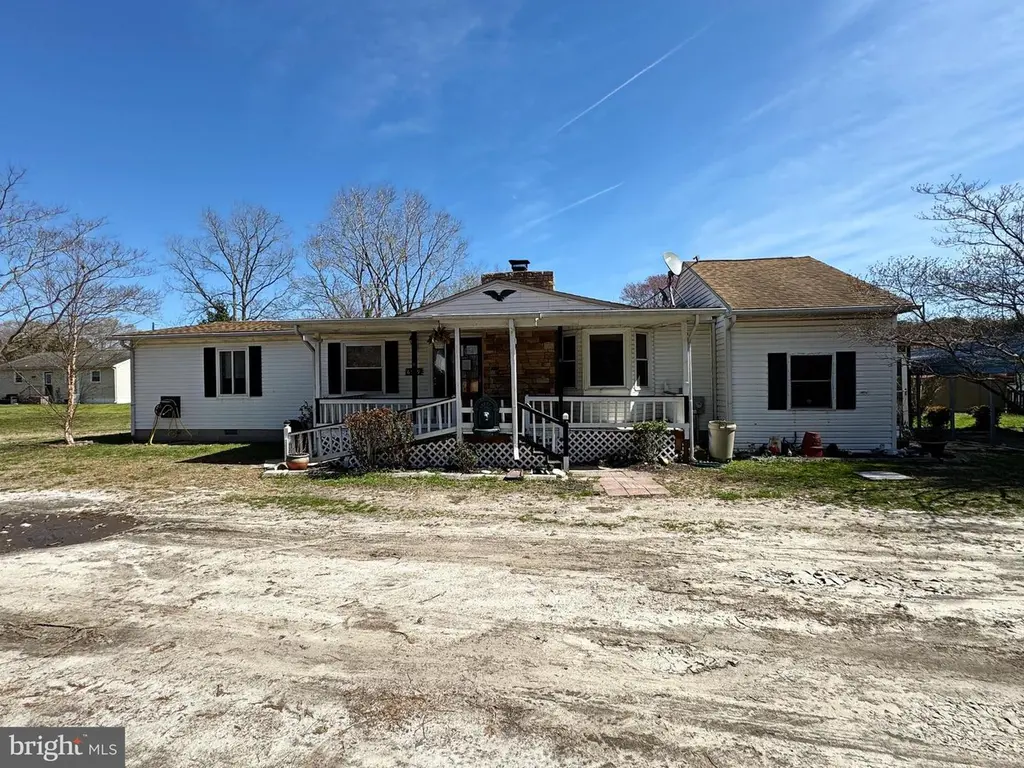
6509 Kenwood Dr · Salisbury, MD
Flood risk 1/10 · Minimal
- FEMA flood zone
- X (unshaded)
- Chance of flooding over 30 yrs
- 0.0%
- Est. flood insurance / yr
- $507 – $1,088
Fire risk 1/10 · Minimal
- Est. fire insurance / yr
- $755 – $1,403
Heat risk 8/10 · Major
- Hot days now (above 105°F)
- 7 days/yr
- Hot days in 30 yrs
- 16 days/yr
Wind risk 8/10 · Major
- Chance of severe wind over 30 yrs
- 80.0%
Air-quality risk 2/10 · Minimal
- Unhealthy air days now
- 1 days/yr
- Unhealthy air days in 30 yrs
- 2 days/yr
Risk factors via First Street. Map © Google.
Why this score? — see what drove the B grade
The composite is a weighted blend of 9 inputs, each scored 0–100. Each bar is that input's sub-score; the figure is the points it added to the 100-point composite (weight × sub-score).
- Cash flow +29.4/30.0
- ARV discount +15.0/15.0
- DSCR +10.0/10.0
- 1% rule +7.4/10.0
- Rent growth +3.4/5.0
- Livability +3.0/5.0
- Condition / age +2.5/5.0
- Schools +1.9/10.0
- Appreciation +0.0/10.0
$180,000
🖨 Deal sheet (PDF) 📄 Offer letter ✓ Due diligence
Listing remarks MLS
Discover this ranch-style home, nestled on a generous 1.31-acre lot with serene, wooded areas. Built in 1976, this well-maintained residence offers 1,505 sq. ft. of versatile living space. Venture inside to find a warm and inviting atmosphere, highlighted by hardwood and carpet flooring that flows seamlessly throughout. The eat-in kitchen with its brick walls and equipped with appliances, is an ideal place for kitchen enthusiasts. Enjoy the large bay windows in the living room that invite natural light to fill every corner. Outside, the property shines with its thoughtfully landscaped front yard and a spacious rear yard that backs to lush trees, providing a peaceful retreat. The expansive porch in the front is perfect for morning coffee or evening gatherings, allowing you to soak in the beauty of your surroundings. A convenient storage barn/shed offers additional space for tools and outdoor equipment, ensuring your yard remains pristine. Parking is a breeze with a detached carport accommodating two vehicles, making it easy to come and go. This home is a few minutes away from Salisbury Shopper's World, Arthur W Perdue Stadium, and Salisbury Regional Airport. So, don't miss out on this gem! Schedule your showing today.
Key facts
- 1.31 acre lot
- 2 parking spots
- Built 1976
Neighborhood map
What this means for you Summary
Snapshot
- This is a 4-bed/2.5-bath single-family listed at $180k.
Deal economics
- At list price, monthly cash flow is $641 ($8k/yr) — positive.
- The deal already cash-flows at list — no discount required.
- Meets the 1% rule at list price ($2k rent vs $180k).
- Recommended offer: $175k (3.0% below list) — sets the bar for market timing.
- Cap rate 10.6% vs local median 4.8% in Salisbury — top-decile yield for the area; either an underpriced asset or a hidden risk that comps aren't pricing in. Stress-test before assuming the spread holds.
Location & tenants
- Location reads 60/100 on livability (#351 in MD) — a middle-class / working-renter tenant base. Strengths: health & safety A+, cost of living A, housing A; Watch: schools D-, crime F, amenities F.
- Wicomico County Public Schools (urban): math 16% / reading 26% proficiency, ranked #19 of 24 in MD (top 79%) — low school quality limits family demand, transient renter base, plan for 1-2y turnover.
- Market conditions: Rents rising (+3.8%/yr); 201 active listings in the ZIP; 3 comparable units currently listed for rent nearby; rentals at typical pace (median 15d on market — plan ~3-4 weeks tenant-placement turnaround); 278 units permitted in Wicomico County in 2024 (44 in 5+ unit buildings).
- This rent runs 37% of the median local income ($73k/yr) — at the standard rent-burdened threshold; future hikes will face affordability resistance.
Forward outlook
- Local home prices are declining (-3.0%/yr); year-one equity from $1k of loan paydown is wiped out by about $5k of value loss. Plan a longer hold.
- Wicomico County population projected at +14% by 2050 — modest demand growth; plan on rents tracking national, not racing it.
- At projected returns (-3.0% appreciation + 3.8% rent growth), your $50k cash investment doubles in ~8 years — after that, you're playing with house money.
Negotiation context
- It's been on market 31 days — a 3% lower offer ($175k) is reasonable based on typical stale-listing flexibility.
- 4 sale attempts since 26y ago with the ask held roughly flat each time — persistent listings suggest the price (not the market) is what's stuck; bring a comps-based counter.
- Current owner paid $57k; list at $180k implies a 216% gain — meaningful room to come down on a strong offer.
Risks & watch-outs
- Climate carrying-cost: severe wind risk, 80% chance of damaging wind over 30y; extreme-heat days projected 7→16/yr by 2055 (HVAC capex compounding) — expect insurance premiums to compound above CPI over the hold.
Questions for the listing agent
- It's been on market 31 days. Have you received any prior offers? Is the seller open to a 3% concession, seller financing, or rate buy-down credit?
- Built in 1976 — when were the roof, HVAC, electrical panel, plumbing, and water heater last replaced?
- Is there a deadline driving the sale (1031 exchange, divorce, estate, relocation)? That informs how much negotiation room exists.
- Schools are D-rated, which usually means shorter tenancies and higher turnover. Who's the typical renter profile here, and what's been the actual vacancy rate?
- Crime grade is F in this area — have there been break-ins, vandalism, or insurance claims at this property in the last 3 years? What carrier currently insures it and at what premium?
- What's the average days-on-market for RENTAL listings here right now (not sales)? A rising rental-DOM trend means longer vacancies and softer asking-rent achievability than the comps imply.
- What's the recent tenant-quality profile in this submarket — average credit score on applications, eviction rate, late-payment / NSF rate, and stable-employment percentage? A property-management company in the area should have these aggregated.
- How much new for-sale + rental construction is in the pipeline within 1–3 miles? Heavy new supply typically softens prices + rents 12–24 months out; constrained supply supports both.
Investment metrics
- 1% rule
- 1.24% ✓
- Cap rate
- 10.57%
- Cash-on-cash
- 15.26%
- DSCR
- 1.68
- GRM
- 6.7
CMA / ARV
- ARV (median comp)
- $235,825
- List price
- $180,000
- Delta
- -23.67%
- Verdict
- UNDERPRICED
- Comps
- 20 within 1.0 mi
Show comp detail 9 sales within ~0.75 mi
| Address | Dist | Beds/Ba | Sqft | Sold | Price | $/sf | Match |
|---|---|---|---|---|---|---|---|
| 6509 Kenwood Dr | 0.00mi | 4/2.0 | 1,505 (0%) | 1mo | $150,000 | $100 | 97 |
| 3202 Old Ocean City Rd | 0.18mi | 3/1.5 (-1) | 1,495 (-1%) | 2mo | $210,000 | $140 | 80 |
| 215 Potomac Ave | 0.42mi | 3/2.0 (-1) | 1,565 (+4%) | 7mo | $324,900 | $208 | 61 |
| 306 Pacific Ave | 0.30mi | 4/2.5 | 1,560 (+4%) | 23mo | $255,000 | $163 | 60 |
| 113 Parker Rd | 0.52mi | 3/1.0 (-1) | 1,516 (+1%) | 10mo | $250,000 | $165 | 56 |
| 220 Phillip Morris Dr | 0.58mi | 3/1.5 (-1) | 1,568 (+4%) | 3mo | $155,000 | $99 | 54 |
| 407 Pacific Ave | 0.37mi | 4/2.0 | 1,441 (-4%) | 24mo | $295,000 | $205 | 54 |
| 3301 Old Ocean City Rd | 0.26mi | 3/1.0 (-1) | 1,320 (-12%) | 23mo | $231,500 | $175 | 37 |
| 506 Barnsdale Dr | 0.72mi | 3/2.0 (-1) | 1,296 (-14%) | 4mo | $285,000 | $220 | 34 |
Match score weights: distance 35% · size 25% · config 20% · recency 20%. Top-matched comps best support the ARV.
Projected returns pro-forma
-3.0% appreciation · 3.78% rent growth · sell at horizon
- IRR
- 6.8%
- Equity multiple
- 1.27×
- Total profit
- $13,387
- Equity at exit
- $26,839
- IRR
- 16.7%
- Equity multiple
- 2.42×
- Total profit
- $71,447
- Equity at exit
- $15,563
Cash invested: $50,400 (down + closing). Projections, not guarantees.
Landlord ↔ Tenant lean methodology
- Overall (STATE)
- 27 Tenant-Leaning
- State Maryland
- 27 Tenant-Leaning · D+14
- County
- — inherits STATE
- City
- — inherits STATE
ZIP-level market 21804
- Home prices YoY
- -26.7%
- Rents YoY
- 3.8%
- Active inventory
- 201
- Price-to-rent
- 6.7×
Monthly cashflow live
- Estimated rent
- $2,238 medium interval (Pro) →
- Mortgage (P&I)
- −$944
- Tax from tax record
- −$108 /mo · $1,296/yr
- Insurance
- −$75
- HOA
- −$0
- Vacancy / Maint / Mgmt
- −$470
- Net cashflow
- $641
Break-even live
Sensitivity live
| Price | -10% $743 | -5% $692 | +0% $641 | +5% $590 | +10% $539 |
|---|---|---|---|---|---|
| Rent | -10% $464 | -5% $553 | +0% $641 | +5% $729 | +10% $818 |
| Rate | -1.0pp $732 | -0.5pp $687 | base $641 | +0.5pp $594 | +1.0pp $547 |
UW: 25.0% down · 7.5% · 30yr · 1.5% tax · 5.0% vac · 8.0% maint · 8.0% mgmt
Financing live
Cash to close
- Down payment
- $45,000
- Closing costs
- $5,400
- Reserves months
- —
- Total cash needed
- —
Loan-product check · same deal, 3 products live
Conventional
25% down · 7.5% · 30yr
- Down + closing
- —
- Monthly P&I
- —
- Monthly cashflow
- —
- DSCR
- —
- Eligible?
- —
Personal DTI + credit; lowest rate.
DSCR
20% down · 8.5% · 30yr
- Down + closing
- —
- Monthly P&I
- —
- Monthly cashflow
- —
- DSCR
- —
- Eligible?
- —
No personal income docs; deal must DSCR.
Hard money
10% down · 12.0% · 12mo
- Down + closing
- —
- Monthly P&I
- —
- Monthly cashflow
- —
- DSCR
- —
- Eligible?
- —
Short-term bridge; refi at stabilization.
Rent comps 3 comps
| Address | Beds | Baths | Sqft | Rent | $/sqft | DOM | Units | Dist |
|---|---|---|---|---|---|---|---|---|
| 1500 Sharen Dr Salisbury, MD | 1.0–3.0 | 1.0–2.0 | 946 | $1,800 | $1.90 | 14d | 1 | 0.60mi |
| 130 Ocean Aisle Cir Salisbury, MD | 2.0–3.0 | 2.0 | 1388 | $2,299 | $1.66 | 14d | 16 | 0.61mi |
| 309 Stream Valley Ct Salisbury, MD | 3.0 | 2.5 | 1530 | $2,295 | $1.50 | 22d | 1 | 1.04mi |
Listing history 12 events
-
2026-05-08status Pending 1236-char remark
Show marketing remark (1236 chars)
Discover this ranch-style home, nestled on a generous 1.31-acre lot with serene, wooded areas. Built in 1976, this well-maintained residence offers 1,505 sq. ft. of versatile living space. Venture inside to find a warm and inviting atmosphere, highlighted by hardwood and carpet flooring that flows seamlessly throughout. The eat-in kitchen with its brick walls and equipped with appliances, is an ideal place for kitchen enthusiasts. Enjoy the large bay windows in the living room that invite natural light to fill every corner. Outside, the property shines with its thoughtfully landscaped front yard and a spacious rear yard that backs to lush trees, providing a peaceful retreat. The expansive porch in the front is perfect for morning coffee or evening gatherings, allowing you to soak in the beauty of your surroundings. A convenient storage barn/shed offers additional space for tools and outdoor equipment, ensuring your yard remains pristine. Parking is a breeze with a detached carport accommodating two vehicles, making it easy to come and go. This home is a few minutes away from Salisbury Shopper's World, Arthur W Perdue Stadium, and Salisbury Regional Airport. So, don't miss out on this gem! Schedule your showing today.
-
2026-04-07$180,000 Active 1236-char remark
Show marketing remark (1236 chars)
Discover this ranch-style home, nestled on a generous 1.31-acre lot with serene, wooded areas. Built in 1976, this well-maintained residence offers 1,505 sq. ft. of versatile living space. Venture inside to find a warm and inviting atmosphere, highlighted by hardwood and carpet flooring that flows seamlessly throughout. The eat-in kitchen with its brick walls and equipped with appliances, is an ideal place for kitchen enthusiasts. Enjoy the large bay windows in the living room that invite natural light to fill every corner. Outside, the property shines with its thoughtfully landscaped front yard and a spacious rear yard that backs to lush trees, providing a peaceful retreat. The expansive porch in the front is perfect for morning coffee or evening gatherings, allowing you to soak in the beauty of your surroundings. A convenient storage barn/shed offers additional space for tools and outdoor equipment, ensuring your yard remains pristine. Parking is a breeze with a detached carport accommodating two vehicles, making it easy to come and go. This home is a few minutes away from Salisbury Shopper's World, Arthur W Perdue Stadium, and Salisbury Regional Airport. So, don't miss out on this gem! Schedule your showing today.
-
2025-04-10historical
-
2025-04-03status Active
-
2025-03-31historical
-
2025-03-19price $199,900
-
2025-01-14$229,900 Active
-
2025-01-14historical
-
2001-05-31soldstatus $57,000
-
2001-05-23soldstatus $57,000
-
2000-07-20$59,900
-
1991-05-01soldstatus $36,500
ⓘ Source: listings_history table (triggers on properties + properties_extension) + one-shot
backfill from property_details.listing_events for pre-trigger history.
Tax reassessment forecast MD · Partial reset (capped growth)
- Current annual tax
- $1,296 · $108/mo
- Projected year-2 tax
- $1,629 · $136/mo
- Expected delta
- +$333/yr (+$28/mo · 25.7%)
ⓘ Screening estimate from a state-policy table — verify with the county assessor before closing.
Climate risk First Street
- Flood 1/10 Low FEMA zone X (unshaded) · 0% chance over 30 yrs
- Wildfire 1/10 Low
- Heat 8/10 Severe 7 d/yr ≥105°F today · 16 d/yr by 30 yrs out
- Wind 8/10 Severe 80% chance of damaging wind over 30 yrs
- Air quality 2/10 Low 1 unhealthy d/yr today · 2 by 30 yrs out
Nearby sold comps map
Loading sold comps map…
Walkable amenities ~0.75 mi
Loading nearby amenities…
Taxation est. · year 1
- Rental income
- $26,854
- − Mortgage interest
- −$10,083
- − Property taxes
- −$1,296
- − Insurance
- −$900
- − Repairs & maintenance
- −$2,148
- − Management
- −$2,148
- − Depreciation
- −$5,236
- Taxable income
- $5,042
- Est. tax owed @ 24.0%
- −$1,210
- After-tax cash flow
- $6,481/yr
For passive investors: Depreciation is non-cash, so a rental often shows a tax loss while cash-flowing — sheltering income. Rental losses are passive: they offset passive income freely, and up to $25,000/yr can offset ordinary (W-2) income if you actively participate and your MAGI is under $100k (phasing out to $0 by $150k); unused losses carry forward. On sale, claimed depreciation is recaptured at up to 25%, and gains may owe capital-gains tax (a 1031 exchange can defer both). Figures are a year-1 estimate at your 24.0% rate — not tax advice; consult a CPA.
Schools (NCES district)
- District
- Wicomico County Public Schools
- NCES district ID
- 2400690
- Math proficiency
- 16% ▼ -18.00%
- Reading proficiency
- 26% ▼ -13.00%
- Median HH income
- $51,745
- Composite
- 18.87/100
- National rank
- #8860
- State rank
- #19 of 24 in MD
Livability — Salisbury
- Score
- 60/100
- State rank
- #351
- US rank
- #18948
Category grades
Schools grade is shown separately in the Schools card above.
Census & demographics
- County
- Wicomico County · 75,969 people
- City population
- 70,518
- Metro
- Salisbury, MD-DE
- Population (ZIP)
- 40,430
- Household income
- $73,156
- Rent vs Own
- Severe rent burden
- 2096.0
Population outlook (Wicomico County) Hauer SSP2
- Today (2025)
- 108,548 people
- By 2030
- 111,783 · +3.0%
- By 2040
- 118,139 · +8.8%
- By 2050
- 123,641 · +13.9%
- By 2075
- 139,784 · +28.8%
- By 2100
- 145,334 · +33.9%
Race, ethnicity, and origin ACS 2023
- Neighborhood character
- Diverse neighborhood (Simpson 0.61)
- Race & ethnicity
- White 54% Black 30% Two or more races 9% Hispanic / Latino 7% Asian 3%
- Hispanic origin (detail)
- Mexican 4% Dominican 1%
- Common ancestry
- Hispanic 8% Romanian 3% Slovak 1%
- Foreign-born
- 13% · Canada, Vietnam, South Korea
- Languages at home
- 83% English-only · French/Haitian/Cajun 7% Spanish 5% Other Indo-European 2%
Political lean MEDSL · Wicomico
- 2024 margin
- Lean R (+5.5) · D 46.1% · R 51.5% · Other 2.4%
- 2008→2024 swing
- +0.3pp no change · 2008: -5.8pp · 2024: -5.5pp
- All cycles
- 2024: R+5.5 2020: R+1.9 2016: R+11.6 2012: R+6.9 2008: R+5.8
Not yet ingested
- Civics
- —
Market trends
- HPI YoY
- ▼ -84.15%
- Current HPI
- 230.6099
- Rent YoY
- ▲ 3.78%
- Metro
- Salisbury, MD-DE
- State GDP YoY
- ▲ 2.97%
- F500 in state
- 12
Industry mix (Fortune 500 HQ in MD)
| Industry | F500 HQs | Revenue |
|---|---|---|
| Aerospace / Defense | 1 | $71B |
|
||
| Utilities | 1 | $25B |
|
||
| Hotels | 1 | $24B |
|
||
| Consumer Goods | 1 | $7B |
|
||
| Real Estate | 1 | $6B |
|
||
| Chemicals | 1 | $2B |
|
||
Price history
+393.2% since first listed12 events — show timeline
- 2026-05-08 Pending — BRIGHT MLS
- 2026-04-07 Listed $180,000 BRIGHT MLS
- 2025-04-10 Listing Removed — BRIGHT MLS
- 2025-04-03 Relisted — BRIGHT MLS
- 2025-03-31 Listing Removed — BRIGHT MLS
- 2025-03-19 Price Changed $199,900 BRIGHT MLS
- 2025-01-14 Listed $229,900 BRIGHT MLS
- 2025-01-14 Coming Soon — BRIGHT MLS
- 2001-05-31 Sold (Public Records) $57,000 Public Records
- 2001-05-23 Sold (MLS) $57,000 BRIGHT MLS
- 2000-07-20 Listed $59,900 BRIGHT MLS
- 1991-05-01 Sold (Public Records) $36,500 Public Records
Property tax history
+3.4%/yrLatest (2025): $1,296 · +1.6% YoY. Source: county tax records.
Cash-flow waterfall
monthlySold comps — $/sqft
last 12 mo · ≤1 miLoading sold comps…