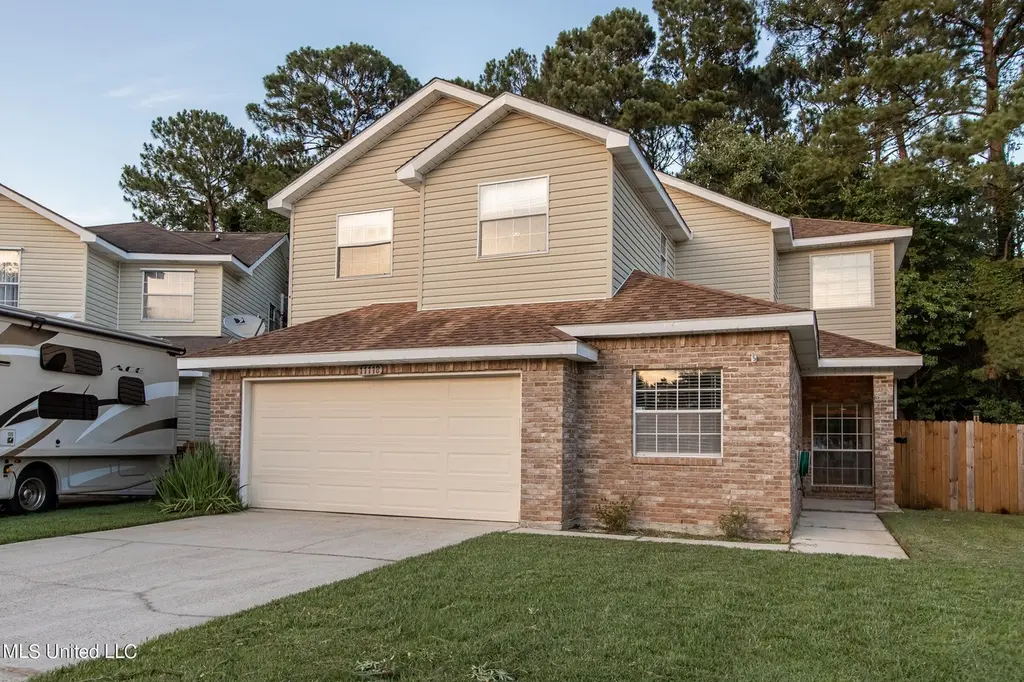
11118 Oakcrest Dr · D'Iberville, MS
Flood risk 1/10 · Minimal
- FEMA flood zone
- X (unshaded)
- Chance of flooding over 30 yrs
- 0.0%
- Est. flood insurance / yr
- $507 – $1,088
Fire risk 4/10 · Minor
- Est. fire insurance / yr
- $1,241 – $2,305
Heat risk 10/10 · Severe
- Hot days now (above 106°F)
- 7 days/yr
- Hot days in 30 yrs
- 22 days/yr
Wind risk 9/10 · Severe
- Chance of severe wind over 30 yrs
- 99.0%
Air-quality risk 2/10 · Minimal
- Unhealthy air days now
- 1 days/yr
- Unhealthy air days in 30 yrs
- 2 days/yr
Risk factors via First Street. Map © Google.
Why this score? — see what drove the D+ grade
The composite is a weighted blend of 9 inputs, each scored 0–100. Each bar is that input's sub-score; the figure is the points it added to the 100-point composite (weight × sub-score).
- Cash flow +19.2/30.0
- DSCR +6.1/10.0
- ARV discount +4.6/15.0
- Schools +4.2/10.0
- 1% rule +4.1/10.0
- Rent growth +2.5/5.0
- Livability +2.5/5.0
- Condition / age +2.5/5.0
- Appreciation +0.0/10.0
$284,900
🖨 Deal sheet 📄 Offer letter ✓ Due diligence
Listing remarks MLS
XL HOME IN D'IBERVILLE SCHOOL DISTRICT WITH NO FLOOD ZONE!!! Need space? You've got plenty with this home. 4 bedrooms with 3 full baths, dining room, breakfast room w/LED fireplace and plenty of space in the kitchen! Cul-de-sac street and located close to casinos, shopping at The Promenade and Keesler Air Force Base. EXPLORE THIS HOME IN TRUE 3D AT THIS WEB ADDRESS: https://my.matterport.com/show/?m=skLjKmQX8eX&brand=0
Key facts
- Access to schools
- Storage shed
- Fenced backyard
Tags
Neighborhood map
What this means for you Summary
Snapshot
- This is a 4-bed/1.0-bath single-family listed at $285k.
Deal economics
- At list price, monthly cash flow is $308 ($4k/yr) — positive.
- The deal already cash-flows at list — no discount required.
- To meet the 1% rule (rent ≥ 1% of price), the offer needs to be $260k (8.8% below list).
- Recommended offer: $260k (8.8% below list) — sets the bar for 1% rule.
- Cap rate 7.6% vs local median 5.4% in D'Iberville — top-decile yield for the area; either an underpriced asset or a hidden risk that comps aren't pricing in. Stress-test before assuming the spread holds.
Location & tenants
- Location reads: area grade D — affects rentability + tenant quality, not the cash-flow math above.
- Harrison County School District (rural): math 52% / reading 46% proficiency, ranked #14 of 130 in MS (top 11%) — families likely to look elsewhere, expect single-tenant / working-renter base with shorter leases; 62% free/reduced lunch — lower-income household profile, screen leases tightly.
- Market conditions: 89 active listings in the ZIP; 7 comparable units currently listed for rent nearby; rentals at typical pace (median 21d on market — plan ~3-4 weeks tenant-placement turnaround); 43% of comp listings sitting > 30 days — soft ceiling on asking rent; 2,194 units permitted in Harrison County in 2024 (0 in 5+ unit buildings).
Forward outlook
- Local home prices are declining (-3.0%/yr); year-one equity from $2k of loan paydown is wiped out by about $9k of value loss. Plan a longer hold.
- Harrison County population projected at +27% by 2050 — long-run rental-demand tailwind backs the buy-and-hold thesis.
Negotiation context
- Only 7 days on market — expect competitive offers; lowballing is unlikely to land.
- 4 sale attempts since 12y ago; this cycle's ask has dropped $25k (8%) from the opening price — seller is motivated, your offer sets the floor, not the list.
Risks & watch-outs
- Climate carrying-cost: severe wind risk, 99% chance of damaging wind over 30y; extreme-heat days projected 7→22/yr by 2055 (HVAC capex compounding) — expect insurance premiums to compound above CPI over the hold.
Questions for the listing agent
- Is there a deadline driving the sale (1031 exchange, divorce, estate, relocation)? That informs how much negotiation room exists.
- The area grade is low — what's the realistic commute time and amenity access for the typical tenant pool here? Any planned neighborhood developments (good or bad) we should know about?
- What's the average days-on-market for RENTAL listings here right now (not sales)? A rising rental-DOM trend means longer vacancies and softer asking-rent achievability than the comps imply.
- What's the recent tenant-quality profile in this submarket — average credit score on applications, eviction rate, late-payment / NSF rate, and stable-employment percentage? A property-management company in the area should have these aggregated.
- How much new for-sale + rental construction is in the pipeline within 1–3 miles? Heavy new supply typically softens prices + rents 12–24 months out; constrained supply supports both.
Investment metrics
- 1% rule
- 0.91% ✗
- Cap rate
- 7.59%
- Cash-on-cash
- 4.64%
- DSCR
- 1.21
- GRM
- 9.1
CMA / ARV
- ARV (median comp)
- $267,542
- List price
- $284,900
- Delta
- 6.49%
- Verdict
- FAIR
- Comps
- 20 within 1.0 mi
Show comp detail 8 sales within ~0.75 mi
| Address | Dist | Beds/Ba | Sqft | Sold | Price | $/sf | Match |
|---|---|---|---|---|---|---|---|
| 11047 Oakcrest Dr | 0.14mi | 4/2.5 | 1,974 (-12%) | 1mo | $268,500 | $136 | 67 |
| 874 Brentwood Dr | 0.69mi | 4/2.0 | 2,166 (-3%) | 6mo | $285,000 | $132 | 53 |
| 5031 West Gay Rd | 0.54mi | 4/2.0 | 2,000 (-11%) | 5mo | $515,000 | $258 | 49 |
| 872 Brentwood Dr | 0.71mi | 4/2.0 | 2,317 (+3%) | 15mo | $300,000 | $129 | 44 |
| 487 Ginger Dr | 0.59mi | 3/2.0 (-1) | 2,112 (-6%) | 12mo | $84,900 | $40 | 44 |
| 833 Heron Cv | 0.73mi | 3/2.0 (-1) | 2,075 (-7%) | 10mo | $273,000 | $132 | 37 |
| 352 Annette Ln | 0.73mi | 3/2.0 (-1) | 1,988 (-11%) | 8mo | $184,000 | $93 | 31 |
| 842 Eagle Eyrie Dr | 0.61mi | 3/2.0 (-1) | 2,067 (-8%) | 24mo | $268,500 | $130 | 30 |
Match score weights: distance 35% · size 25% · config 20% · recency 20%. Top-matched comps best support the ARV.
Projected returns pro-forma
-3.0% appreciation · 3.0% rent growth · sell at horizon
- IRR
- -9.1%
- Equity multiple
- 0.67×
- Total profit
- $-26,618
- Equity at exit
- $42,480
- IRR
- 0.3%
- Equity multiple
- 1.02×
- Total profit
- $1,716
- Equity at exit
- $24,633
Cash invested: $79,772 (down + closing). Projections, not guarantees.
Landlord ↔ Tenant lean methodology
- Overall (STATE)
- 90 Strongly Landlord-Friendly
- State Mississippi
- 90 Strongly Landlord-Friendly · R+11
- County
- — inherits STATE
- City
- — inherits STATE
ZIP-level market 39540
- Home prices YoY
- -30.9%
- Active inventory
- 89
- Price-to-rent
- 9.1×
Monthly cashflow live
- Estimated rent
- $2,597 high interval (Pro) →
- Mortgage (P&I)
- −$1,494
- Tax from tax record
- −$130 /mo · $1,564/yr
- Insurance
- −$119
- HOA
- −$0
- Vacancy / Maint / Mgmt
- −$545
- Net cashflow
- $308
Break-even live
UW: 25.0% down · 7.5% · 30yr · 1.5% tax · 5.0% vac · 8.0% maint · 8.0% mgmt
Financing live
Cash to close
- Down payment
- $71,225
- Closing costs
- $8,547
- Reserves months
- —
- Total cash needed
- —
Loan-product check · same deal, 3 products live
Conventional
25% down · 7.5% · 30yr
- Down + closing
- —
- Monthly P&I
- —
- Monthly cashflow
- —
- DSCR
- —
- Eligible?
- —
Personal DTI + credit; lowest rate.
DSCR
20% down · 8.5% · 30yr
- Down + closing
- —
- Monthly P&I
- —
- Monthly cashflow
- —
- DSCR
- —
- Eligible?
- —
No personal income docs; deal must DSCR.
Hard money
10% down · 12.0% · 12mo
- Down + closing
- —
- Monthly P&I
- —
- Monthly cashflow
- —
- DSCR
- —
- Eligible?
- —
Short-term bridge; refi at stabilization.
Rent comps 7 comps
| Address | Beds | Baths | Sqft | Rent | $/sqft | DOM | Units | Dist |
|---|---|---|---|---|---|---|---|---|
| 876 Kirkwood Dr Biloxi, MS | 4.0 | 3.0 | 2008 | $2,300 | $1.15 | 44d | 1 | 0.73mi |
| 327 Dianne Dr Diberville, MS | 4.0 | 2.0 | 1500 | $1,100 | $0.73 | 13d | 1 | 0.74mi |
| 608 Kimberly Dr Diberville, MS | 3.0 | 2.0 | 1509 | $1,575 | $1.04 | 21d | 1 | 0.84mi |
| 4441 Audubon Trl Biloxi, MS | 3.0 | 2.5 | 1704 | $3,800 | $2.23 | 21d | 1 | 0.85mi |
| 508 Tasha Dr Diberville, MS | 3.0 | 2.0 | 1890 | $3,200 | $1.69 | 44d | 1 | 0.91mi |
| 10480 Auto Mall Pkwy Diberville, MS | 1.0–3.0 | 1.0–2.0 | 1281 | $1,907 | $1.49 | 13d | 1 | 0.98mi |
| 611 Peach St D'Iberville, MS | 3.0 | 2.5 | 1589 | $2,500 | $1.57 | 44d | 1 | 1.46mi |
Listing history 22 events
-
2026-06-18days on market $284,900 Active 7 DOM
-
2026-06-17days on market $284,900 Active 6 DOM
-
2026-06-16days on market $284,900 Active 5 DOM
-
2026-06-15days on market $284,900 Active 4 DOM
-
2026-06-14days on market $284,900 Active 2 DOM
-
2026-06-13remarks 660-char remark
-
2026-06-13statusdays on market $284,900 Active 1 DOM
-
2026-05-06historical
-
2026-04-30price $284,900
-
2026-02-25price $299,950
-
2026-02-06$310,000 Active
-
2022-10-06soldstatus
-
2022-10-03soldstatus Closed 432-char remark
Show marketing remark (432 chars)
XL HOME IN D'IBERVILLE SCHOOL DISTRICT WITH NO FLOOD ZONE!!! Need space? You've got plenty with this home. 4 bedrooms with 3 full baths, dining room, breakfast room w/LED fireplace and plenty of space in the kitchen! Cul-de-sac street and located close to casinos, shopping at The Promenade and Keesler Air Force Base. EXPLORE THIS HOME IN TRUE 3D AT THIS WEB ADDRESS: https://my.matterport.com/show/?m=skLjKmQX8eX&brand=0
-
2022-08-26status Pending 432-char remark
Show marketing remark (432 chars)
XL HOME IN D'IBERVILLE SCHOOL DISTRICT WITH NO FLOOD ZONE!!! Need space? You've got plenty with this home. 4 bedrooms with 3 full baths, dining room, breakfast room w/LED fireplace and plenty of space in the kitchen! Cul-de-sac street and located close to casinos, shopping at The Promenade and Keesler Air Force Base. EXPLORE THIS HOME IN TRUE 3D AT THIS WEB ADDRESS: https://my.matterport.com/show/?m=skLjKmQX8eX&brand=0
-
2022-07-29price $264,900 432-char remark
Show marketing remark (432 chars)
XL HOME IN D'IBERVILLE SCHOOL DISTRICT WITH NO FLOOD ZONE!!! Need space? You've got plenty with this home. 4 bedrooms with 3 full baths, dining room, breakfast room w/LED fireplace and plenty of space in the kitchen! Cul-de-sac street and located close to casinos, shopping at The Promenade and Keesler Air Force Base. EXPLORE THIS HOME IN TRUE 3D AT THIS WEB ADDRESS: https://my.matterport.com/show/?m=skLjKmQX8eX&brand=0
-
2022-06-21price $269,900 432-char remark
Show marketing remark (432 chars)
XL HOME IN D'IBERVILLE SCHOOL DISTRICT WITH NO FLOOD ZONE!!! Need space? You've got plenty with this home. 4 bedrooms with 3 full baths, dining room, breakfast room w/LED fireplace and plenty of space in the kitchen! Cul-de-sac street and located close to casinos, shopping at The Promenade and Keesler Air Force Base. EXPLORE THIS HOME IN TRUE 3D AT THIS WEB ADDRESS: https://my.matterport.com/show/?m=skLjKmQX8eX&brand=0
-
2022-06-03$279,900 Active 432-char remark
Show marketing remark (432 chars)
XL HOME IN D'IBERVILLE SCHOOL DISTRICT WITH NO FLOOD ZONE!!! Need space? You've got plenty with this home. 4 bedrooms with 3 full baths, dining room, breakfast room w/LED fireplace and plenty of space in the kitchen! Cul-de-sac street and located close to casinos, shopping at The Promenade and Keesler Air Force Base. EXPLORE THIS HOME IN TRUE 3D AT THIS WEB ADDRESS: https://my.matterport.com/show/?m=skLjKmQX8eX&brand=0
-
2014-09-23soldstatus
-
2014-09-19soldstatus
-
2014-07-18$159,900
-
2014-05-12soldstatus
-
2014-02-27$117,000
ⓘ Source: listings_history table (triggers on properties + properties_extension) + one-shot
backfill from property_details.listing_events for pre-trigger history.
Tax reassessment forecast MS · Resets to sale price
- Current annual tax
- $1,564 · $130/mo
- Projected year-2 tax
- $2,251 · $188/mo
- Expected delta
- +$686/yr (+$57/mo · 43.9%)
ⓘ Screening estimate from a state-policy table — verify with the county assessor before closing.
Climate risk First Street
- Flood 1/10 Low FEMA zone X (unshaded) · 0% chance over 30 yrs
- Wildfire 4/10 Moderate
- Heat 10/10 Extreme 7 d/yr ≥106°F today · 22 d/yr by 30 yrs out
- Wind 9/10 Extreme 99% chance of damaging wind over 30 yrs
- Air quality 2/10 Low 1 unhealthy d/yr today · 2 by 30 yrs out
Nearby sold comps map
Loading sold comps map…
Walkable amenities ~0.75 mi
Loading nearby amenities…
Taxation est. · year 1
- Rental income
- $31,164
- − Mortgage interest
- −$15,959
- − Property taxes
- −$1,564
- − Insurance
- −$1,424
- − Repairs & maintenance
- −$2,493
- − Management
- −$2,493
- − Depreciation
- −$8,288
- Taxable loss
- −$1,058
- Est. tax savings @ 24.0%
- +$254
- After-tax cash flow
- $3,956/yr
For passive investors: Depreciation is non-cash, so a rental often shows a tax loss while cash-flowing — sheltering income. Rental losses are passive: they offset passive income freely, and up to $25,000/yr can offset ordinary (W-2) income if you actively participate and your MAGI is under $100k (phasing out to $0 by $150k); unused losses carry forward. On sale, claimed depreciation is recaptured at up to 25%, and gains may owe capital-gains tax (a 1031 exchange can defer both). Figures are a year-1 estimate at your 24.0% rate — not tax advice; consult a CPA.
Schools (NCES district)
- District
- Harrison County School District
- NCES district ID
- 2801770
- Math proficiency
- 52% ▼ -4.00%
- Reading proficiency
- 46% ▼ -4.00%
- Median HH income
- $46,504
- Composite
- 41.66/100
- National rank
- #3419
- State rank
- #14 of 130 in MS
Livability — D'Iberville
No livability data for this city. (Only ~50 U.S. cities are tracked.)
Census & demographics
- Census place
- D'Iberville, MS
- Population (ZIP)
- 13,033
Population outlook (Harrison County) Hauer SSP2
- Today (2025)
- 228,444 people
- By 2030
- 241,942 · +5.9%
- By 2040
- 267,531 · +17.1%
- By 2050
- 291,062 · +27.4%
- By 2075
- 346,711 · +51.8%
- By 2100
- 378,165 · +65.5%
Race, ethnicity, and origin ACS 2023
- Neighborhood character
- Diverse neighborhood (Simpson 0.60)
- Race & ethnicity
- White 60% Black 18% Asian 10% Two or more races 9% Hispanic / Latino 9%
- Hispanic origin (detail)
- Common ancestry
- Romanian 5% Slovak 4% Lithuanian 3%
- Foreign-born
- 12% · Canada, Vietnam, South Korea
- Languages at home
- 85% English-only · Spanish 6% Vietnamese 6% Other Asian/Pacific 1%
Political lean MEDSL · Harrison
- 2024 margin
- Strong R (+28.9) · D 35.0% · R 63.9% · Other 1.1%
- 2008→2024 swing
- -2.9pp toward R · 2008: -26.0pp · 2024: -28.9pp
- All cycles
- 2024: R+28.9 2020: R+25.2 2016: R+30.7 2012: R+26.6 2008: R+26.0
Not yet ingested
- Civics
- —
Market trends
- HPI YoY
- ▼ -83.70%
- Current HPI
- 187.2895
- Rent YoY
- —
- Metro
- —
- State GDP YoY
- —
- F500 in state
- 0
Price history
+143.5% since first listed15 events — show timeline
- 2026-05-06 Listing Removed — MLSU
- 2026-04-30 Price Changed $284,900 MLSU
- 2026-02-25 Price Changed $299,950 MLSU
- 2026-02-06 Listed $310,000 MLSU
- 2022-10-06 Sold (Public Records) — Public Records
- 2022-10-03 Sold (MLS) — MLSU
- 2022-08-26 Pending — MLSU
- 2022-07-29 Price Changed $264,900 MLSU
- 2022-06-21 Price Changed $269,900 MLSU
- 2022-06-03 Listed $279,900 MLSU
- 2014-09-23 Sold (Public Records) — Public Records
- 2014-09-19 Sold (MLS) — MLSU
- 2014-07-18 Listed $159,900 MLSU
- 2014-05-12 Sold (MLS) — MLSU
- 2014-02-27 Listed $117,000 MLSU
Property tax history
-5.0%/yrLatest (2025): $1,564 · +5.4% YoY. Source: county tax records.
Cash-flow waterfall
monthlySold comps — $/sqft
last 12 mo · ≤1 miLoading sold comps…