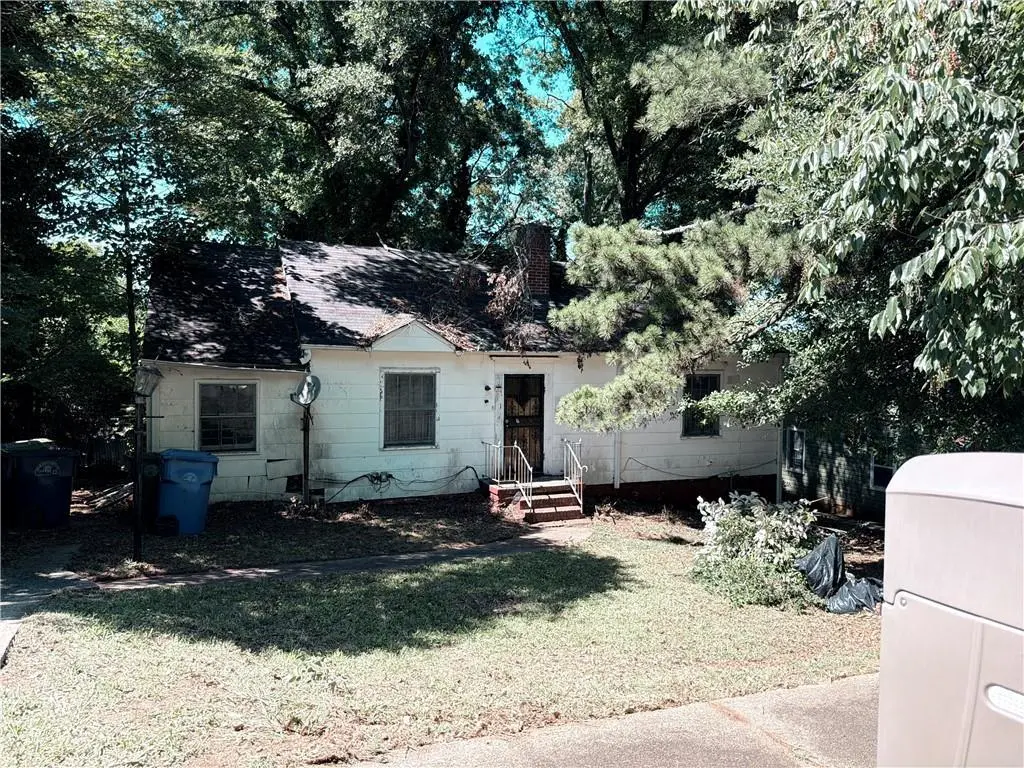
541 Erin Ave SW · Atlanta, GA
Flood risk 1/10 · Minimal
- FEMA flood zone
- X (unshaded)
- Chance of flooding over 30 yrs
- 0.0%
- Est. flood insurance / yr
- $473 – $860
Fire risk 1/10 · Minimal
- Est. fire insurance / yr
- $963 – $1,789
Heat risk 5/10 · Moderate
- Hot days now (above 104°F)
- 7 days/yr
- Hot days in 30 yrs
- 16 days/yr
Wind risk 6/10 · Moderate
- Chance of severe wind over 30 yrs
- 27.0%
Air-quality risk 4/10 · Minor
- Unhealthy air days now
- 4 days/yr
- Unhealthy air days in 30 yrs
- 6 days/yr
Risk factors via First Street. Map © Google.
Why this score? — see what drove the B grade
The composite is a weighted blend of 9 inputs, each scored 0–100. Each bar is that input's sub-score; the figure is the points it added to the 100-point composite (weight × sub-score).
- Cash flow +27.0/30.0
- ARV discount +13.4/15.0
- DSCR +9.3/10.0
- 1% rule +8.6/10.0
- Livability +4.2/5.0
- Rent growth +3.2/5.0
- Schools +2.7/10.0
- Condition / age +2.5/5.0
- Appreciation +0.0/10.0
$149,900
🖨 Deal sheet 📄 Offer letter ✓ Due diligence
Listing remarks
Investors wanted. This home has been cleaned out and ready for a complete rehab. Make your offer today! Perfect for fix & flip investors looking to increase the value. It could be a nice addition to a buy- & -hold portfolio. Sold As-Is. NO BLIND OFFERS. Must use seller’s closing attorney
Key facts
- 0.32 acre lot
- Built 1956
- Listed 5 days
Property features AI
Exterior
- Parking: Driveway parking; Open parking available
- Utilities: Public water; Public sewer; 110 volt electric; Cable available; Electricity available; Natural gas available; Sewer available; Water available
- Home design: One level; Property listed as a fixer; Combination foundation; Composition roof
- Construction: Construction materials not specified
- Exterior features: City street frontage; Asphalt road access
Interior
- Kitchen: Kitchen features not specified
- Bedrooms: 2 bedrooms on the main level; Bedrooms have no special features listed
- Flooring: Flooring type not specified
- Bathrooms: 1 full bathroom (main level)
- Heating & cooling: Central heating; Central air; Ceiling fan(s)
- Interior features: No shared/common walls; Attic
- Laundry & utility: Laundry features not specified
Neighborhood map
What this means for you Summary
Snapshot
- This is a 2-bed/1.0-bath single-family listed at $150k.
Deal economics
- At list price, monthly cash flow is $418 ($5k/yr) — positive.
- The deal already cash-flows at list — no discount required.
- Meets the 1% rule at list price ($2k rent vs $150k).
- Cap rate 9.6% vs local median 3.1% in Atlanta — top-decile yield for the area; either an underpriced asset or a hidden risk that comps aren't pricing in. Stress-test before assuming the spread holds.
Location & tenants
- Location reads 83/100 on livability (#6 in GA, #919 nationally) — a professional / high-income tenant draw. Strengths: amenities A+, commute A+, housing A+; Watch: cost of living C-.
- Atlanta Public Schools (urban): math 28% / reading 35% proficiency, ranked #80 of 174 in GA (top 46%) — families likely to look elsewhere, expect single-tenant / working-renter base with shorter leases; 71% free/reduced lunch — lower-income household profile, screen leases tightly.
- Zoned schools: T. J. Perkerson Elementary School (math 8% / reading 12%, grade F, #1,092 of 1,228 statewide, top 91%, 354 students, 100% FRL); Sylvan Hills Middle School (math 5% / reading 12%, grade F, #439 of 470 statewide, top 94%, 445 students, 100% FRL); Booker T. Washington High School (math 24% / reading 24%, grade F, #184 of 424 statewide, top 48%, 831 students, 100% FRL) — zoned schools average 100% FRL vs 71% district-wide (29 pts higher); higher-poverty schools than district average — tighter screening recommended.
- Zoned-school proficiency averages 14% at this address vs 32% district-wide (-17 pts) — the specific schools serving this property underperform the Atlanta Public Schools average; the district grade overstates school quality for this exact location.
- Market conditions: Rents rising (+2.8%/yr); 452 active listings in the ZIP; 40 comparable units currently listed for rent nearby; rentals at typical pace (median 24d on market — plan ~3-4 weeks tenant-placement turnaround); 11,565 units permitted in Fulton County in 2024 (8,159 in 5+ unit buildings).
- At $2,046/mo this rent would consume 46% of the median local household income ($53k/yr) (locally 1676% of renters already pay >50% of income on rent) — very limited rent-growth headroom before tenants either downsize or default.
Forward outlook
- Local home prices are declining (-3.0%/yr); year-one equity from $1k of loan paydown is wiped out by about $4k of value loss. Plan a longer hold.
- Fulton County population projected at +38% by 2050 — long-run rental-demand tailwind backs the buy-and-hold thesis.
- At projected returns (-3.0% appreciation + 2.8% rent growth), your $42k cash investment doubles in ~10 years — after that, you're playing with house money.
Negotiation context
- Only 5 days on market — expect competitive offers; lowballing is unlikely to land.
- Current owner paid $20k; list at $150k implies a 631% gain — meaningful room to come down on a strong offer.
Risks & watch-outs
- Watch-outs: property tax is 2.8% of price; built in 1956 — expect roof / HVAC / electrical / plumbing capex.
- Climate carrying-cost: major wind risk, 27% chance of damaging wind over 30y; extreme-heat days projected 7→16/yr by 2055 (HVAC capex compounding) — expect insurance premiums to compound above CPI over the hold.
Questions for the listing agent
- Built in 1956 — when were the roof, HVAC, electrical panel, plumbing, and water heater last replaced?
- Property tax is high relative to price — has the assessment been appealed recently, and will the sale trigger a re-assessment?
- Is there a deadline driving the sale (1031 exchange, divorce, estate, relocation)? That informs how much negotiation room exists.
- What's the average days-on-market for RENTAL listings here right now (not sales)? A rising rental-DOM trend means longer vacancies and softer asking-rent achievability than the comps imply.
- What's the recent tenant-quality profile in this submarket — average credit score on applications, eviction rate, late-payment / NSF rate, and stable-employment percentage? A property-management company in the area should have these aggregated.
- How much new for-sale + rental construction is in the pipeline within 1–3 miles? Heavy new supply typically softens prices + rents 12–24 months out; constrained supply supports both.
Investment metrics
- 1% rule
- 1.36% ✓
- Cap rate
- 9.64%
- Cash-on-cash
- 11.95%
- DSCR
- 1.53
- GRM
- 6.1
CMA / ARV
- ARV (on-the-fly)
- $172,700
- Comps found
- 12
Show comp detail 12 sales within ~0.75 mi
| Address | Dist | Beds/Ba | Sqft | Sold | Price | $/sf | Match |
|---|---|---|---|---|---|---|---|
| 530 Erin Ave SW | 0.04mi | 3/2.0 (+1) | 1,010 (-8%) | 7mo | $299,900 | $297 | 70 |
| 1180 Garibaldi St SW | 0.43mi | 3/2.0 (+1) | 1,085 (-1%) | 6mo | $243,000 | $224 | 64 |
| 1143 Windsor St SW | 0.48mi | 3/1.0 (+1) | 1,008 (-8%) | 2mo | $99,000 | $98 | 57 |
| 1056 Welch St SW | 0.44mi | 2/2.5 | 1,189 (+8%) | 5mo | $145,000 | $122 | 56 |
| 1464 Hartford Ave SW | 0.74mi | 2/1.0 | 1,173 (+7%) | 1mo | $275,000 | $234 | 54 |
| 1395 Hartford Ave SW | 0.71mi | 2/2.0 | 1,132 (+3%) | 6mo | $350,000 | $309 | 53 |
| 1149 Ira St SW | 0.40mi | 3/2.0 (+1) | 1,231 (+12%) | 3mo | $184,000 | $149 | 50 |
| 817 Beechwood Ave SW | 0.53mi | 3/2.0 (+1) | 1,200 (+9%) | 2mo | $180,000 | $150 | 49 |
| 1684 Thornton Pl | 0.73mi | 3/1.0 (+1) | 1,175 (+7%) | 4mo | $185,000 | $157 | 46 |
| 997 Ira St SW | 0.63mi | 3/2.0 (+1) | 1,014 (-8%) | 4mo | $109,000 | $107 | 46 |
| 296 Thornton St SW | 0.69mi | 3/2.0 (+1) | 988 (-10%) | 2mo | $155,000 | $157 | 41 |
| 1473 Everhart St SW | 0.62mi | 3/1.0 (+1) | 1,254 (+14%) | 3mo | $495,000 | $395 | 40 |
Match score weights: distance 35% · size 25% · config 20% · recency 20%. Top-matched comps best support the ARV.
Projected returns pro-forma
-3.0% appreciation · 2.77% rent growth · sell at horizon
- IRR
- 1.2%
- Equity multiple
- 1.05×
- Total profit
- $1,985
- Equity at exit
- $22,351
- IRR
- 10.7%
- Equity multiple
- 1.82×
- Total profit
- $34,604
- Equity at exit
- $12,961
Cash invested: $41,972 (down + closing). Projections, not guarantees.
Landlord ↔ Tenant lean methodology
- Overall (STATE)
- 90 Strongly Landlord-Friendly
- State Georgia
- 90 Strongly Landlord-Friendly · R+3
- County
- — inherits STATE
- City
- — inherits STATE
ZIP-level market 30310
- Home prices YoY
- -32.8%
- Rents YoY
- 2.8%
- Active inventory
- 452
- Price-to-rent
- 6.1×
Monthly cashflow live
- Estimated rent
- $2,046 high interval (Pro) →
- Mortgage (P&I)
- −$786
- Tax from tax record
- −$350 /mo · $4,197/yr
- Insurance
- −$62
- HOA
- −$0
- Vacancy / Maint / Mgmt
- −$430
- Net cashflow
- $418
Break-even live
UW: 25.0% down · 7.5% · 30yr · 1.5% tax · 5.0% vac · 8.0% maint · 8.0% mgmt
Financing live
Cash to close
- Down payment
- $37,475
- Closing costs
- $4,497
- Reserves months
- —
- Total cash needed
- —
Loan-product check · same deal, 3 products live
Conventional
25% down · 7.5% · 30yr
- Down + closing
- —
- Monthly P&I
- —
- Monthly cashflow
- —
- DSCR
- —
- Eligible?
- —
Personal DTI + credit; lowest rate.
DSCR
20% down · 8.5% · 30yr
- Down + closing
- —
- Monthly P&I
- —
- Monthly cashflow
- —
- DSCR
- —
- Eligible?
- —
No personal income docs; deal must DSCR.
Hard money
10% down · 12.0% · 12mo
- Down + closing
- —
- Monthly P&I
- —
- Monthly cashflow
- —
- DSCR
- —
- Eligible?
- —
Short-term bridge; refi at stabilization.
Rent comps 40 comps
| Address | Beds | Baths | Sqft | Rent | $/sqft | DOM | Units | Dist |
|---|---|---|---|---|---|---|---|---|
| 547 Erin Ave SW Atlanta, GA | 3.0 | 2.0 | 1394 | $2,600 | $1.87 | 24d | 1 | 0.03mi |
| 547 Erin Ave SW Atlanta, GA | 3.0 | 2.0 | 1400 | $5,000 | $3.57 | 2d | 1 | 0.03mi |
| 518 Erin Ave SW Atlanta, GA | 2.0 | 1.0 | 1075 | $2,500 | $2.33 | 18d | 1 | 0.09mi |
| 1180 Sims St SW Atlanta, GA | 2.0 | 1.0 | 772 | $1,100 | $1.42 | 24d | 1 | 0.25mi |
| 1133 Mayland Cir SW Atlanta, GA | 3.0 | 2.0 | 1120 | $3,600 | $3.21 | 24d | 1 | 0.28mi |
| 1187 McDaniel St SW Unit B Atlanta, GA | 2.0 | 1.0 | 1038 | $1,025 | $0.99 | 12d | 1 | 0.29mi |
| 1135 Coleman St SW Atlanta, GA | 3.0 | 2.5 | 1353 | $1,795 | $1.33 | 24d | 1 | 0.30mi |
| 1246 Allene Ave SW Atlanta, GA | 2.0 | 1.0–2.0 | 896 | $2,110 | $2.35 | 1d | 23 | 0.30mi |
| 600 Mayland Ave SW Atlanta, GA | 3.0 | 2.0 | 1100 | $2,300 | $2.09 | 24d | 1 | 0.32mi |
| 490 Lynnhaven Dr SW Atlanta, GA | 3.0 | 2.0 | 1289 | $2,395 | $1.86 | 4d | 1 | 0.33mi |
| 1430 Desoto Ave SW Atlanta, GA | 3.0 | 2.0 | 1224 | $2,200 | $1.80 | 24d | 1 | 0.43mi |
| 706 Catherine St SW Atlanta, GA | 3.0 | 2.0 | 1352 | $2,200 | $1.63 | 7d | 1 | 0.48mi |
| 825 Erin Ave SW Atlanta, GA | 2.0 | 1.0 | 776 | $3,000 | $3.87 | 24d | 1 | 0.52mi |
| 1040 Smith St SW Atlanta, GA | 3.0 | 2.5 | 1500 | $1,595 | $1.06 | 24d | 1 | 0.53mi |
| 1534 Beatie Ave SW Atlanta, GA | 3.0 | 2.0 | 1050 | $2,050 | $1.95 | 24d | 1 | 0.53mi |
| 1148 Booker Ave SW Atlanta, GA | 1.0 | 1.0 | 1012 | $900 | $0.89 | 17d | 1 | 0.55mi |
| 1048 Garibaldi St SW Atlanta, GA | 2.0 | 2.0 | 1280 | $2,150 | $1.68 | 24d | 1 | 0.59mi |
| 1483 Arthur Langford Jr Pl SW Atlanta, GA | 1.0–2.0 | 1.0 | 825 | $900 | $1.09 | 24d | 7 | 0.61mi |
| 1264 Hartford Ave SW Atlanta, GA | 3.0 | 2.0 | 1290 | $1,989 | $1.54 | 24d | 1 | 0.61mi |
| 375 Lincoln St SW Atlanta, GA | 1.0 | 1.0 | 1020 | $750 | $0.74 | 24d | 1 | 0.64mi |
| 1645 Metropolitan Pkwy SW Unit A Atlanta, GA | 3.0 | 1.0 | 1433 | $1,795 | $1.25 | 24d | 1 | 0.71mi |
| 827 Elbert St SW Atlanta, GA | 3.0 | 2.0 | 1300 | $2,900 | $2.23 | 24d | 1 | 0.77mi |
| 1734 Cahoon St SW Atlanta, GA | 3.0 | 1.0 | 950 | $1,800 | $1.89 | 24d | 1 | 0.83mi |
| 906 Allene Ave SW Atlanta, GA | 3.0 | 2.0 | 1500 | $3,500 | $2.33 | 22d | 1 | 0.83mi |
| 840 Smith St SW Unit A Atlanta, GA | 2.0 | 1.5 | 910 | $1,550 | $1.70 | 17d | 1 | 0.89mi |
| 174 Moury Ave SW Atlanta, GA | 1.0–3.0 | 1.0–2.0 | 926 | $1,604 | $1.73 | 3d | 6 | 0.91mi |
| 1780 Cahoon St SW Atlanta, GA | 2.0 | 1.0 | 700 | $1,100 | $1.57 | 24d | 1 | 0.94mi |
| 1782 Cahoon St SW Atlanta, GA | 2.0 | 1.0 | 700 | $1,100 | $1.57 | 24d | 1 | 0.95mi |
| 776 Metropolitan Pkwy SW Atlanta, GA | 2.0–3.0 | 2.0–3.0 | 1212 | $2,165 | $1.79 | 2d | 6 | 0.96mi |
| 806 Murphy Ave SW Atlanta, GA | 1.0 | 1.0 | 731 | $1,254 | $1.72 | 7d | 3 | 1.00mi |
| 806 Murphy Ave SW Atlanta, GA | 1.0–2.0 | 1.0 | 825 | $1,254 | $1.52 | 24d | 8 | 1.00mi |
| 1790 Brewer Blvd SW Atlanta, GA | 3.0 | 2.0 | 1301 | $2,000 | $1.54 | 22d | 1 | 1.06mi |
| 200 Guerin Rd Holly Springs, NC | 2.0–3.0 | 1.0–1.5 | 947 | $1,249 | $1.32 | 22d | 1 | 1.06mi |
| 825 Hank Aaron Dr SW Atlanta, GA | 2.0 | 2.0 | 861 | $1,470 | $1.71 | 24d | 1 | 1.09mi |
| 1788 Broadwell St SW Atlanta, GA | 2.0 | 2.0 | 1017 | $1,850 | $1.82 | 24d | 1 | 1.09mi |
| 245 Amal Dr SW #3004 Atlanta, GA | 2.0 | 2.0 | 1402 | $1,800 | $1.28 | 22d | 1 | 1.10mi |
| 404 Bass St SW Atlanta, GA | 3.0 | 2.0 | 1080 | $1,850 | $1.71 | 17d | 1 | 1.10mi |
| 1056 Hank Aaron Dr SW Atlanta, GA | 1.0–2.0 | 1.0 | 753 | $1,139 | $1.51 | 7d | 6 | 1.13mi |
| 903 Beecher St SW Atlanta, GA | 3.0 | 2.0 | 1500 | $7,500 | $5.00 | 24d | 1 | 1.14mi |
| 903 Beecher St SW Unit 905 Beecher Atlanta, GA | 3.0 | 2.0 | 1500 | $4,000 | $2.67 | 22d | 1 | 1.14mi |
Listing history 6 events
-
2026-06-17status $149,900 Pending 5 DOM
-
2026-06-16days on market $149,900 Active 5 DOM
-
2026-06-15days on market $149,900 Active 4 DOM
-
2026-06-13days on market $149,900 Active 2 DOM
-
2026-06-13remarks 290-char remark
-
2026-06-13$149,900 Active 1 DOM
ⓘ Source: listings_history table (triggers on properties + properties_extension) + one-shot
backfill from property_details.listing_events for pre-trigger history.
Tax reassessment forecast GA · Resets to sale price
- Current annual tax
- $4,197 · $350/mo
- Projected year-2 tax
- $4,197 · $350/mo
- Expected delta
- $0/yr ($0/mo · 0.0%)
ⓘ Screening estimate from a state-policy table — verify with the county assessor before closing.
Climate risk First Street
- Flood 1/10 Low FEMA zone X (unshaded) · 0% chance over 30 yrs
- Wildfire 1/10 Low
- Heat 5/10 Major 7 d/yr ≥104°F today · 16 d/yr by 30 yrs out
- Wind 6/10 Major 27% chance of damaging wind over 30 yrs
- Air quality 4/10 Moderate 4 unhealthy d/yr today · 6 by 30 yrs out
Nearby sold comps map
Loading sold comps map…
Walkable amenities ~0.75 mi
Loading nearby amenities…
Taxation est. · year 1
- Rental income
- $24,550
- − Mortgage interest
- −$8,397
- − Property taxes
- −$4,197
- − Insurance
- −$750
- − Repairs & maintenance
- −$1,964
- − Management
- −$1,964
- − Depreciation
- −$4,361
- Taxable income
- $2,918
- Est. tax owed @ 24.0%
- −$700
- After-tax cash flow
- $4,315/yr
For passive investors: Depreciation is non-cash, so a rental often shows a tax loss while cash-flowing — sheltering income. Rental losses are passive: they offset passive income freely, and up to $25,000/yr can offset ordinary (W-2) income if you actively participate and your MAGI is under $100k (phasing out to $0 by $150k); unused losses carry forward. On sale, claimed depreciation is recaptured at up to 25%, and gains may owe capital-gains tax (a 1031 exchange can defer both). Figures are a year-1 estimate at your 24.0% rate — not tax advice; consult a CPA.
Schools (NCES district)
- District
- Atlanta Public Schools
- NCES district ID
- 1300120
- Math proficiency
- 28% ▼ -6.00%
- Reading proficiency
- 35% ▼ -2.00%
- Median HH income
- $48,306
- Composite
- 27.27/100
- National rank
- #7006
- State rank
- #80 of 174 in GA
Livability — Atlanta
- Score
- 83/100
- State rank
- #6
- US rank
- #919
Category grades
Schools grade is shown separately in the Schools card above.
Census & demographics
- Census place
- Atlanta, GA
- County
- Fulton County · 1,094,430 people
- City population
- 629,525
- Metro
- Atlanta-Sandy Springs-Alpharetta, GA
- Population (ZIP)
- 27,186
- Household income
- $53,037
- Rent vs Own
- Severe rent burden
- 1676.0
Population outlook (Fulton County) Hauer SSP2
- Today (2025)
- 1,203,707 people
- By 2030
- 1,299,706 · +8.0%
- By 2040
- 1,488,256 · +23.6%
- By 2050
- 1,664,580 · +38.3%
- By 2075
- 2,036,072 · +69.2%
- By 2100
- 2,222,402 · +84.6%
Race, ethnicity, and origin ACS 2023
- Neighborhood character
- Predominantly Black (76%)
- Race & ethnicity
- Black 76% White 14% Two or more races 4% Hispanic / Latino 4% Asian 2%
- Common ancestry
- Lithuanian 1% Slovak 1% Serbian 0%
- Foreign-born
- 5% · Canada, South Korea, Vietnam
- Languages at home
- 92% English-only · Spanish 4% French/Haitian/Cajun 1% Other Indo-European 1%
Political lean MEDSL · Fulton
- 2024 margin
- Solid D (+44.9) · D 71.9% · R 27.0% · Other 1.1%
- 2008→2024 swing
- +9.8pp toward D · 2008: 35.0pp · 2024: 44.9pp
- All cycles
- 2024: D+44.9 2020: D+46.4 2016: D+42.1 2012: D+29.6 2008: D+35.0
Not yet ingested
- Civics
- —
Market trends
- HPI YoY
- ▼ -204.00%
- Current HPI
- 418.7297
- Rent YoY
- ▲ 2.77%
- Metro
- Atlanta-Sandy Springs-Alpharetta, GA
- State GDP YoY
- ▲ 2.66%
- F500 in state
- 28
Industry mix (Fortune 500 HQ in GA)
| Industry | F500 HQs | Revenue |
|---|---|---|
| Paper / Packaging | 2 | $29B |
|
||
| Retail | 1 | $160B |
|
||
| Transportation / Logistics | 1 | $91B |
|
||
| Airlines | 1 | $62B |
|
||
| Consumer Goods | 1 | $47B |
|
||
| Utilities | 1 | $25B |
|
||
Price history
+631.2% since first listed3 events — show timeline
- 2026-06-11 Listed $149,900 FMLS
- 1977-12-01 Sold (Public Records) $20,500 Public Records
- 1976-12-14 Sold (Public Records) $20,500 Public Records
Property tax history
+5.6%/yrLatest (2025): $4,197 · +0.7% YoY. Source: county tax records.
Cash-flow waterfall
monthlySold comps — $/sqft
last 12 mo · ≤1 miLoading sold comps…