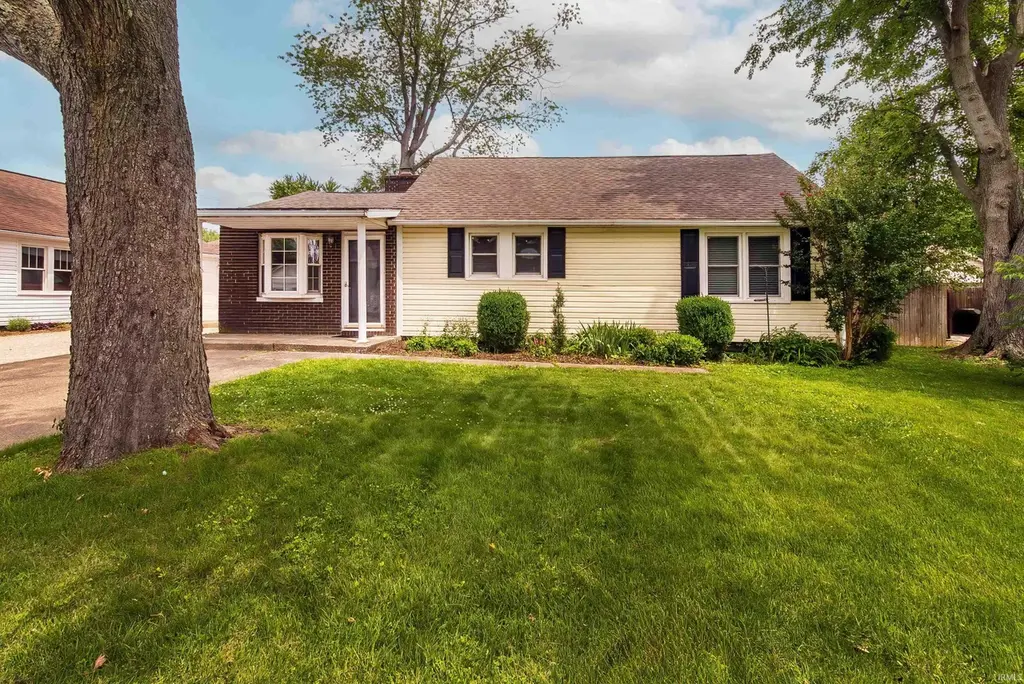
608 E Moore St · Boonville, IN
Flood risk 1/10 · Minimal
- FEMA flood zone
- X (unshaded)
- Chance of flooding over 30 yrs
- 0.0%
- Est. flood insurance / yr
- $507 – $1,088
Fire risk 1/10 · Minimal
- Est. fire insurance / yr
- $717 – $1,331
Heat risk 5/10 · Moderate
- Hot days now (above 106°F)
- 7 days/yr
- Hot days in 30 yrs
- 20 days/yr
Wind risk 2/10 · Minimal
- Chance of severe wind over 30 yrs
- 3.0%
Air-quality risk 2/10 · Minimal
- Unhealthy air days now
- 2 days/yr
- Unhealthy air days in 30 yrs
- 2 days/yr
Risk factors via First Street. Map © Google.
Why this score? — see what drove the D grade
The composite is a weighted blend of 9 inputs, each scored 0–100. Each bar is that input's sub-score; the figure is the points it added to the 100-point composite (weight × sub-score).
- Cash flow +15.8/30.0
- DSCR +4.9/10.0
- Schools +4.9/10.0
- 1% rule +3.3/10.0
- Livability +3.3/5.0
- ARV discount +3.2/15.0
- Rent growth +2.5/5.0
- Condition / age +2.5/5.0
- Appreciation +0.0/10.0
$205,000
🖨 Deal sheet (PDF) 📄 Offer letter ✓ Due diligence
Listing remarks
Welcome home to this thoughtfully cared-for and updated 3-bedroom, 1-bath home in the heart of Boonville. Move-in ready and full of charm, this home features hardwood flooring in two of the bedrooms, newer vinyl windows, and an updated kitchen with beautiful ClearVue cabinetry. All kitchen appliances, along with the washer and dryer, are included for added convenience. Cozy up by the woodburning fireplace in the family room on cool evenings, or enjoy the attractive landscaping with beautiful flowering plants. Conveniently located within walking distance of City Lake Park and Lions Park Aquatic Center, this well-maintained home offers comfort, charm, and a great location all in one!
Key facts
- Hardwood flooring
- Vinyl windows
- Clearvue cabinetry
Tags
Property features AI
Exterior
- Parking: Detached off-street garage with 1 garage space
- Utilities: Public water; Public sewer
- Home design: Single-family, site-built home; One-story
- Construction: Aluminum siding, brick, and vinyl siding exterior
- Exterior features: Level lot; Lot dimensions approximately 65 x 143; Asphalt roof
Interior
- Kitchen: Dishwasher; Microwave; Refrigerator; Electric range
- Bedrooms: Total of 6 rooms (includes bedrooms and living spaces)
- Bathrooms: One full bathroom on the main level
- Interior features: Window treatments and blinds; Wood-burning fireplace in the family room; Crawl space basement
- Laundry & utility: Washer and dryer located on the main level
Neighborhood map
What this means for you Summary
Snapshot
- This is a 3-bed/1.0-bath single-family listed at $205k.
Deal economics
- At list price, monthly cash flow is $93 ($1k/yr) — positive.
- The deal already cash-flows at list — no discount required.
- To meet the 1% rule (rent ≥ 1% of price), the offer needs to be $170k (17.3% below list).
- Recommended offer: $170k (17.3% below list) — sets the bar for 1% rule.
- Cap rate 6.8% vs local median 3.5% in Boonville — top-decile yield for the area; either an underpriced asset or a hidden risk that comps aren't pricing in. Stress-test before assuming the spread holds.
Location & tenants
- Location reads 66/100 on livability (#278 in IN) — a middle-class / working-renter tenant base. Strengths: cost of living A+, housing A+; Watch: crime D+, amenities F, commute F.
- Warrick County School Corporation (suburban): math 54% / reading 59% proficiency, ranked #24 of 301 in IN (top 8%) — acceptable for families but not a draw, mixed tenant base, ~2y average lease.
- Zoned schools: Oakdale Elementary School (math 54% / reading 56%, grade C, #192 of 994 statewide, top 20%, 458 students, 56% FRL); Boonville Middle School (math 37% / reading 47%, grade D-, #102 of 330 statewide, top 32%, 700 students, 51% FRL); Boonville High School (math 32% / reading 60%, grade D-, #163 of 369 statewide, top 44%, 881 students, 44% FRL) — zoned schools average 50% FRL vs 24% district-wide (26 pts higher); higher-poverty schools than district average — tighter screening recommended.
- Market conditions: 160 active listings in the ZIP; 1 comparable units currently listed for rent nearby; 249 units permitted in Warrick County in 2024 (0 in 5+ unit buildings).
Forward outlook
- Local home prices are declining (-3.0%/yr); year-one equity from $1k of loan paydown is wiped out by about $6k of value loss. Plan a longer hold.
- Warrick County population projected at +9% by 2050 — modest demand growth; plan on rents tracking national, not racing it.
Negotiation context
- It's been on market 27 days — a 2% lower offer ($202k) is reasonable based on typical stale-listing flexibility.
Risks & watch-outs
- Watch-outs: built in 1945 — expect roof / HVAC / electrical / plumbing capex.
- Climate carrying-cost: extreme-heat days projected 7→20/yr by 2055 (HVAC capex compounding) — expect insurance premiums to compound above CPI over the hold.
Questions for the listing agent
- Built in 1945 — when were the roof, HVAC, electrical panel, plumbing, and water heater last replaced?
- Is there a deadline driving the sale (1031 exchange, divorce, estate, relocation)? That informs how much negotiation room exists.
- Crime grade is D in this area — have there been break-ins, vandalism, or insurance claims at this property in the last 3 years? What carrier currently insures it and at what premium?
- The area grade is low — what's the realistic commute time and amenity access for the typical tenant pool here? Any planned neighborhood developments (good or bad) we should know about?
- What's the average days-on-market for RENTAL listings here right now (not sales)? A rising rental-DOM trend means longer vacancies and softer asking-rent achievability than the comps imply.
- What's the recent tenant-quality profile in this submarket — average credit score on applications, eviction rate, late-payment / NSF rate, and stable-employment percentage? A property-management company in the area should have these aggregated.
- How much new for-sale + rental construction is in the pipeline within 1–3 miles? Heavy new supply typically softens prices + rents 12–24 months out; constrained supply supports both.
Investment metrics
- 1% rule
- 0.83% ✗
- Cap rate
- 6.84%
- Cash-on-cash
- 1.94%
- DSCR
- 1.09
- GRM
- 10.1
CMA / ARV
- ARV (on-the-fly)
- $187,250
- Comps found
- 12
Show comp detail 12 sales within ~0.75 mi
| Address | Dist | Beds/Ba | Sqft | Sold | Price | $/sf | Match |
|---|---|---|---|---|---|---|---|
| 424 E Oak St | 0.13mi | 3/2.0 | 1,649 (-6%) | 4mo | $180,000 | $109 | 77 |
| 413 E Division St | 0.21mi | 3/2.0 | 1,800 (+3%) | 9mo | $200,000 | $111 | 74 |
| 603 E Moore St | 0.04mi | 3/2.0 | 1,909 (+9%) | 7mo | $205,000 | $107 | 73 |
| 504 E Walnut St | 0.41mi | 3/2.0 | 1,864 (+6%) | 6mo | $230,000 | $123 | 61 |
| 315 W Walnut St | 0.67mi | 3/1.0 | 1,679 (-4%) | 5mo | $27,000 | $16 | 58 |
| 506 E Locust St | 0.48mi | 3/1.0 | 1,920 (+10%) | 10mo | $138,000 | $72 | 54 |
| 1403 Wilson St | 0.70mi | 3/2.0 | 1,700 (-3%) | 10mo | $112,000 | $66 | 50 |
| 222 N 5th St | 0.68mi | 2/1.0 (-1) | 1,630 (-7%) | 5mo | $32,000 | $20 | 47 |
| 1306 S First St | 0.59mi | 3/1.5 | 1,573 (-10%) | 8mo | $162,000 | $103 | 47 |
| 1255 Maple Grove Rd | 0.67mi | 3/2.0 | 1,538 (-12%) | 8mo | $333,450 | $217 | 38 |
| 588 W State Rd 62 | 0.57mi | 3/2.0 | 1,520 (-13%) | 12mo | $299,900 | $197 | 38 |
| 510 W Walnut St | 0.74mi | 3/2.0 | 1,989 (+14%) | 5mo | $90,000 | $45 | 34 |
Match score weights: distance 35% · size 25% · config 20% · recency 20%. Top-matched comps best support the ARV.
Projected returns pro-forma
-3.0% appreciation · 3.0% rent growth · sell at horizon
- IRR
- -13.3%
- Equity multiple
- 0.52×
- Total profit
- $-27,381
- Equity at exit
- $30,566
- IRR
- -4.4%
- Equity multiple
- 0.71×
- Total profit
- $-16,545
- Equity at exit
- $17,725
Cash invested: $57,400 (down + closing). Projections, not guarantees.
Landlord ↔ Tenant lean methodology
- Overall (STATE)
- 90 Strongly Landlord-Friendly
- State Indiana
- 90 Strongly Landlord-Friendly · R+11
- County
- — inherits STATE
- City
- — inherits STATE
ZIP-level market 47601
- Active inventory
- 160
- Price-to-rent
- 10.1×
Monthly cashflow live
- Estimated rent
- $1,695 medium interval (Pro) →
- Mortgage (P&I)
- −$1,075
- Tax from tax record
- −$86 /mo · $1,028/yr
- Insurance
- −$85
- HOA
- −$0
- Vacancy / Maint / Mgmt
- −$356
- Net cashflow
- $93
Break-even live
Sensitivity live
| Price | -10% $209 | -5% $151 | +0% $93 | +5% $35 | +10% $-23 |
|---|---|---|---|---|---|
| Rent | -10% $-41 | -5% $26 | +0% $93 | +5% $160 | +10% $227 |
| Rate | -1.0pp $196 | -0.5pp $145 | base $93 | +0.5pp $40 | +1.0pp $-14 |
UW: 25.0% down · 7.5% · 30yr · 1.5% tax · 5.0% vac · 8.0% maint · 8.0% mgmt
Financing live
Cash to close
- Down payment
- $51,250
- Closing costs
- $6,150
- Reserves months
- —
- Total cash needed
- —
Loan-product check · same deal, 3 products live
Conventional
25% down · 7.5% · 30yr
- Down + closing
- —
- Monthly P&I
- —
- Monthly cashflow
- —
- DSCR
- —
- Eligible?
- —
Personal DTI + credit; lowest rate.
DSCR
20% down · 8.5% · 30yr
- Down + closing
- —
- Monthly P&I
- —
- Monthly cashflow
- —
- DSCR
- —
- Eligible?
- —
No personal income docs; deal must DSCR.
Hard money
10% down · 12.0% · 12mo
- Down + closing
- —
- Monthly P&I
- —
- Monthly cashflow
- —
- DSCR
- —
- Eligible?
- —
Short-term bridge; refi at stabilization.
Rent comps 1 comps
| Address | Beds | Baths | Sqft | Rent | $/sqft | DOM | Units | Dist |
|---|---|---|---|---|---|---|---|---|
| 911 Mayfair Dr Boonville, IN | 3.0 | 2.0 | 1897 | $1,695 | $0.89 | 45d | 1 | 0.47mi |
Listing history 16 events
-
2026-06-22days on market $205,000 Active 27 DOM
-
2026-06-18days on market $205,000 Active 24 DOM
-
2026-06-17days on market $205,000 Active 23 DOM
-
2026-06-16days on market $205,000 Active 22 DOM
-
2026-06-15days on market $205,000 Active 21 DOM
-
2026-06-14days on market $205,000 Active 19 DOM
-
2026-06-13days on market $205,000 Active 18 DOM
-
2026-06-10days on market $205,000 Active 16 DOM
-
2026-06-09days on market $205,000 Active 15 DOM
-
2026-06-08days on market $205,000 Active 14 DOM
-
2026-06-07days on market $205,000 Active 13 DOM
-
2026-06-02days on market $205,000 Active 8 DOM
-
2026-06-01days on market $205,000 Active 7 DOM
-
2026-05-31days on market $205,000 Active 6 DOM
-
2026-05-30days on market $205,000 Active 5 DOM
-
2026-05-26$205,000 Active
ⓘ Source: listings_history table (triggers on properties + properties_extension) + one-shot
backfill from property_details.listing_events for pre-trigger history.
Tax reassessment forecast IN · Partial reset (capped growth)
- Current annual tax
- $1,028 · $86/mo
- Projected year-2 tax
- $1,385 · $115/mo
- Expected delta
- +$357/yr (+$30/mo · 34.7%)
ⓘ Screening estimate from a state-policy table — verify with the county assessor before closing.
Climate risk First Street
- Flood 1/10 Low FEMA zone X (unshaded) · 0% chance over 30 yrs
- Wildfire 1/10 Low
- Heat 5/10 Major 7 d/yr ≥106°F today · 20 d/yr by 30 yrs out
- Wind 2/10 Low 3% chance of damaging wind over 30 yrs
- Air quality 2/10 Low 2 unhealthy d/yr today · 2 by 30 yrs out
Nearby sold comps map
Loading sold comps map…
Walkable amenities ~0.75 mi
Loading nearby amenities…
Taxation est. · year 1
- Rental income
- $20,340
- − Mortgage interest
- −$11,483
- − Property taxes
- −$1,028
- − Insurance
- −$1,025
- − Repairs & maintenance
- −$1,627
- − Management
- −$1,627
- − Depreciation
- −$5,964
- Taxable loss
- −$2,414
- Est. tax savings @ 24.0%
- +$579
- After-tax cash flow
- $1,694/yr
For passive investors: Depreciation is non-cash, so a rental often shows a tax loss while cash-flowing — sheltering income. Rental losses are passive: they offset passive income freely, and up to $25,000/yr can offset ordinary (W-2) income if you actively participate and your MAGI is under $100k (phasing out to $0 by $150k); unused losses carry forward. On sale, claimed depreciation is recaptured at up to 25%, and gains may owe capital-gains tax (a 1031 exchange can defer both). Figures are a year-1 estimate at your 24.0% rate — not tax advice; consult a CPA.
Schools (NCES district)
- District
- Warrick County School Corporation
- NCES district ID
- 1812390
- Math proficiency
- 54% ▼ -8.00%
- Reading proficiency
- 59% ▼ -6.00%
- Median HH income
- $62,801
- Composite
- 49.38/100
- National rank
- #2014
- State rank
- #24 of 301 in IN
Livability — Boonville
- Score
- 66/100
- State rank
- #278
- US rank
- #11520
Category grades
Schools grade is shown separately in the Schools card above.
Census & demographics
- Census place
- Boonville, IN
- Population (ZIP)
- 13,119
Population outlook (Warrick County) Hauer SSP2
- Today (2025)
- 66,569 people
- By 2030
- 68,404 · +2.8%
- By 2040
- 71,131 · +6.9%
- By 2050
- 72,743 · +9.3%
- By 2075
- 76,088 · +14.3%
- By 2100
- 72,261 · +8.6%
Race, ethnicity, and origin ACS 2023
- Neighborhood character
- Predominantly White (95%)
- Race & ethnicity
- White 95% Two or more races 3% Hispanic / Latino 2%
- Common ancestry
- Slovak 2% Italian 1% Lithuanian 1%
- Foreign-born
- 0% · Canada
- Languages at home
- 99% English-only · Spanish 1%
Political lean MEDSL · Warrick
- 2024 margin
- Solid R (+30.2) · D 34.1% · R 64.3% · Other 1.5%
- 2008→2024 swing
- -17.4pp toward R · 2008: -12.8pp · 2024: -30.2pp
- All cycles
- 2024: R+30.2 2020: R+27.8 2016: R+33.9 2012: R+26.6 2008: R+12.8
Not yet ingested
- Civics
- —
Market trends
- HPI YoY
- ▼ -119.46%
- Current HPI
- 207.7817
- Rent YoY
- —
- Metro
- —
- State GDP YoY
- ▲ 2.90%
- F500 in state
- 18
Industry mix (Fortune 500 HQ in IN)
| Industry | F500 HQs | Revenue |
|---|---|---|
| Industrial Machinery | 2 | $37B |
|
||
| Healthcare | 1 | $177B |
|
||
| Pharmaceuticals | 1 | $45B |
|
||
| Metals / Steel | 1 | $18B |
|
||
| Agriculture | 1 | $17B |
|
||
| Packaging | 1 | $12B |
|
||
Price history
1 event — show timeline
- 2026-05-26 Listed $205,000 IRMLS
Property tax history
+26.7%/yrLatest (2024): $1,028 · +10.4% YoY. Source: county tax records.
Cash-flow waterfall
monthlySold comps — $/sqft
last 12 mo · ≤1 miLoading sold comps…