 Multi-family
2089 Us-101 101 · Benbow, CA
Flood risk No data
- FEMA flood zone
- —
- Chance of flooding over 30 yrs
- —
- Est. flood insurance / yr
- —
Fire risk No data
- Est. fire insurance / yr
- —
Heat risk No data
- Hot days now (above threshold)
- —
- Hot days in 30 yrs
- —
Wind risk No data
- Chance of severe wind over 30 yrs
- —
Air-quality risk No data
- Unhealthy air days now
- —
- Unhealthy air days in 30 yrs
- —
Risk factors via First Street. Map © Google.
Why this score? — see what drove the C+ grade
The composite is a weighted blend of 9 inputs, each scored 0–100. Each bar is that input's sub-score; the figure is the points it added to the 100-point composite (weight × sub-score).
- Cash flow +25.9/30.0
- DSCR +8.7/10.0
- ARV discount +7.5/15.0
- 1% rule +6.9/10.0
- Condition / age +3.8/5.0
- Appreciation +3.3/10.0
- Schools +3.1/10.0
- Rent growth +2.5/5.0
- Livability +2.2/5.0
$1,199,888
🖨 Deal sheet 📄 Offer letter ✓ Due diligence
Multi-family units
County records classify this as Multi-Family (5+ Unit). Listing-text estimate: 1 unit. estimate disagrees with records
5+ unit building — per-unit beds/baths from public records are typically unavailable; the breakdown below (if shown) is an estimate from the listing text.
Listing remarks
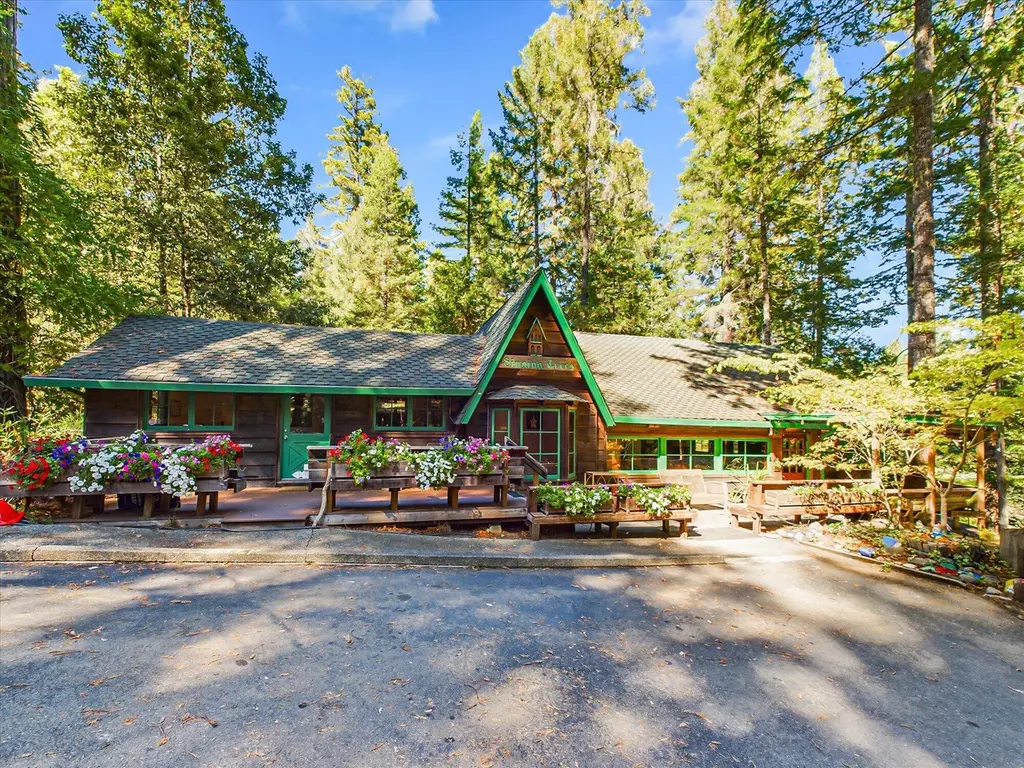
Unlock the extraordinary potential of this expansive property nestled among the majestic redwoods of Richardson Grove, perfectly poised for investors seeking a one-of-a-kind retreat overlooking the Eel River. Comprising eight versatile buildings, including a private main home with sweeping views of the Eel River, with separate living spaces, including an elevator from the garage to the main home, multiple cabins with bedrooms and kitchens, five kitchens in total (one being a commercial kitchen), and a sprawling game/exercise room. This estate is designed to accommodate large groups or multiple uses. With 15 bedrooms and 11 bathrooms, it's ideally suited for an Airbnb venture, business retre
Key facts
- Private main home
- Sweeping views
- Majestic redwoods
Tags
Property features AI
Finance
- Other: Zoned Commercial/Unclassified
Exterior
- Parking: Paved parking; Private parking; Gravel parking; RV access/parking
- Utilities: Spring water source; Private sewer
- Home design: Residential income property; Multi-family; One level
- Construction: Frame construction; Wood siding; Concrete perimeter foundation; Slab foundation; Pillar/post/pier foundation; Built on a 3.45-acre lot
- Exterior features: Shingle roof; Rolling slope lot; Wooded lot; Has view; Asphalt/paved road access
Interior
- Kitchen: Dishwasher; Microwave; Range; Trash compactor; Refrigerator
- Flooring: Carpet; Concrete; Vinyl; Hardwood; Laminate
- Bathrooms: One half bathroom
- Heating & cooling: Wood stove heating; Electric heating; Propane heating; Ceiling fan(s) for cooling
- Interior features: Ceiling fan(s); Dining room fireplace
- Laundry & utility: Washer; Dryer; Washer hookup
Neighborhood map
What this means for you Summary
Snapshot
- This is a ?-bed/0.5-bath multifamily listed at $1.20M. Condition is rated good.
Deal economics
- At list price, monthly cash flow is $3k ($35k/yr) — positive.
- The deal already cash-flows at list — no discount required.
- Meets the 1% rule at list price ($14k rent vs $1.20M).
- Recommended offer: $1.18M (1.5% below list) — sets the bar for market timing.
Location & tenants
- Location reads 44/100 on livability (#1,336 in CA) — a working-class tenant base; expect higher turnover. Watch: schools C-, health & safety C-, crime F.
- Southern Humboldt Joint Unified (rural): math 28% / reading 41% proficiency, ranked #928 of 1,400 in CA (top 66%) — families likely to look elsewhere, expect single-tenant / working-renter base with shorter leases.
- Market conditions: 65 active listings in the ZIP; 188 units permitted in Humboldt County in 2024 (17 in 5+ unit buildings).
Forward outlook
- Local home prices are declining (-3.0%/yr); year-one equity from $8k of loan paydown is wiped out by about $36k of value loss. Plan a longer hold.
- Humboldt County population projected to shrink 4% by 2050 — rents likely to lag national; underwrite the cash flow, not the appreciation.
Negotiation context
- It's been on market 24 days — a 2% lower offer ($1.18M) is reasonable based on typical stale-listing flexibility.
Risks & watch-outs
- Watch-outs: built in 1946 — expect roof / HVAC / electrical / plumbing capex.
Questions for the listing agent
- Built in 1946 — when were the roof, HVAC, electrical panel, plumbing, and water heater last replaced?
- Is there a deadline driving the sale (1031 exchange, divorce, estate, relocation)? That informs how much negotiation room exists.
- Crime grade is F in this area — have there been break-ins, vandalism, or insurance claims at this property in the last 3 years? What carrier currently insures it and at what premium?
- What's the average days-on-market for RENTAL listings here right now (not sales)? A rising rental-DOM trend means longer vacancies and softer asking-rent achievability than the comps imply.
- What's the recent tenant-quality profile in this submarket — average credit score on applications, eviction rate, late-payment / NSF rate, and stable-employment percentage? A property-management company in the area should have these aggregated.
- How much new apartment / multifamily construction is in the pipeline within 1–3 miles? Heavy new supply (>2% of stock underway) typically softens rents 12–24 months out; light construction supports rent growth.
Investment metrics
- 1% rule
- 1.19% ✓
- Cap rate
- 9.25%
- Cash-on-cash
- 10.55%
- DSCR
- 1.47
- GRM
- 7.0
CMA / ARV
No comps found within radius.
Projected returns pro-forma
-3.0% appreciation · 3.0% rent growth · sell at horizon
- IRR
- -0.5%
- Equity multiple
- 0.98×
- Total profit
- $-6,159
- Equity at exit
- $178,907
- IRR
- 9.2%
- Equity multiple
- 1.71×
- Total profit
- $237,666
- Equity at exit
- $103,744
Cash invested: $335,969 (down + closing). Projections, not guarantees.
Landlord ↔ Tenant lean methodology
- Overall (STATE)
- 18 Strongly Tenant-Friendly
- State California
- 18 Strongly Tenant-Friendly · D+13
- County
- — inherits STATE
- City
- — inherits STATE
ZIP-level market 95542
- Home prices YoY
- -2.1%
- Active inventory
- 65
- Price-to-rent
- 56.2×
Monthly cashflow live
- Estimated rent
- $14,234 medium interval (Pro) →
- Mortgage (P&I)
- −$6,292
- Tax est. 1.5%
- −$1,500 /mo · $17,998/yr
- Insurance
- −$500
- HOA
- −$0
- Vacancy / Maint / Mgmt
- −$2,989
- Net cashflow
- $2,953
Break-even live
8-unit breakdown (identical units grouped — click to expand)
| Units | Beds | Baths | Est. rent |
|---|---|---|---|
| 8× units | 15 | 11 | $14,232 |
| #1 | 15 | 11 | $1,779 |
| #2 | 15 | 11 | $1,779 |
| #3 | 15 | 11 | $1,779 |
| #4 | 15 | 11 | $1,779 |
| #5 | 15 | 11 | $1,779 |
| #6 | 15 | 11 | $1,779 |
| #7 | 15 | 11 | $1,779 |
| #8 | 15 | 11 | $1,779 |
| Total (8 units) | $14,234 | ||
UW: 25.0% down · 7.5% · 30yr · 1.5% tax · 5.0% vac · 8.0% maint · 8.0% mgmt
Financing live
Cash to close
- Down payment
- $299,972
- Closing costs
- $35,997
- Reserves months
- —
- Total cash needed
- —
Loan-product check · same deal, 3 products live
Conventional
25% down · 7.5% · 30yr
- Down + closing
- —
- Monthly P&I
- —
- Monthly cashflow
- —
- DSCR
- —
- Eligible?
- —
Personal DTI + credit; lowest rate.
DSCR
20% down · 8.5% · 30yr
- Down + closing
- —
- Monthly P&I
- —
- Monthly cashflow
- —
- DSCR
- —
- Eligible?
- —
No personal income docs; deal must DSCR.
Hard money
10% down · 12.0% · 12mo
- Down + closing
- —
- Monthly P&I
- —
- Monthly cashflow
- —
- DSCR
- —
- Eligible?
- —
Short-term bridge; refi at stabilization.
Listing history 17 events
-
2026-06-19days on market $1,199,888 Active 24 DOM
-
2026-06-18days on market $1,199,888 Active 23 DOM
-
2026-06-17days on market $1,199,888 Active 22 DOM
-
2026-06-16days on market $1,199,888 Active 21 DOM
-
2026-06-15days on market $1,199,888 Active 20 DOM
-
2026-06-14days on market $1,199,888 Active 18 DOM
-
2026-06-12days on market $1,199,888 Active 17 DOM
-
2026-06-09days on market $1,199,888 Active 14 DOM
-
2026-06-08days on market $1,199,888 Active 13 DOM
-
2026-06-07days on market $1,199,888 Active 12 DOM
-
2026-06-07days on market $1,199,888 Active 11 DOM
-
2026-06-04days on market $1,199,888 Active 8 DOM
-
2026-06-02days on market $1,199,888 Active 7 DOM
-
2026-06-01days on market $1,199,888 Active 6 DOM
-
2026-05-31days on market $1,199,888 Active 5 DOM
-
2026-05-31days on market $1,199,888 Active 4 DOM
-
2026-05-27$1,199,888 Active
ⓘ Source: listings_history table (triggers on properties + properties_extension) + one-shot
backfill from property_details.listing_events for pre-trigger history.
Nearby sold comps map
Loading sold comps map…
Walkable amenities ~0.75 mi
Loading nearby amenities…
Taxation est. · year 1
- Rental income
- $170,808
- − Mortgage interest
- −$67,212
- − Property taxes
- −$17,998
- − Insurance
- −$5,999
- − Repairs & maintenance
- −$13,665
- − Management
- −$13,665
- − Depreciation
- −$34,906
- Taxable income
- $17,363
- Est. tax owed @ 24.0%
- −$4,167
- After-tax cash flow
- $31,265/yr
For passive investors: Depreciation is non-cash, so a rental often shows a tax loss while cash-flowing — sheltering income. Rental losses are passive: they offset passive income freely, and up to $25,000/yr can offset ordinary (W-2) income if you actively participate and your MAGI is under $100k (phasing out to $0 by $150k); unused losses carry forward. On sale, claimed depreciation is recaptured at up to 25%, and gains may owe capital-gains tax (a 1031 exchange can defer both). Figures are a year-1 estimate at your 24.0% rate — not tax advice; consult a CPA.
Condition & rehab AI · 14 photos
This multi-family property is in good condition with a good condition score of 75. It has a good roof, exterior, and interior. The property is well-maintained and has a good curb appeal. The property is ready for a cosmetic rehab to enhance its curb appeal and increase its value.
Value-add opportunities
- Both Paint the exterior siding — A fresh coat of paint can enhance the curb appeal and increase the property's value.
- Both Clean the gutters — Clean gutters improve the property's appearance and prevent water damage to the siding and foundation.
Renovation cost estimate screening
Value-add ROI direction
- Both Paint the exterior siding — A fresh coat of paint can enhance the curb appeal and increase the property's value. ↑
- Both Clean the gutters — Clean gutters improve the property's appearance and prevent water damage to the siding and foundation. ↑
ⓘ Cost ranges are severity-bucket heuristics (US national rule-of-thumb). Get contractor quotes + a written scope before underwriting a rehab budget.
Schools (NCES district)
- District
- Southern Humboldt Joint Unified
- NCES district ID
- 0637590
- Math proficiency
- 28% ▲ 1.00%
- Reading proficiency
- 41% ▲ 2.00%
- Median HH income
- $38,108
- Composite
- 31.43/100
- National rank
- #11197
- State rank
- #928 of 1400 in CA
Livability — Benbow
- Score
- 44/100
- State rank
- #1336
- US rank
- #26785
Category grades
Schools grade is shown separately in the Schools card above.
Census & demographics
- Population (ZIP)
- 2,831
Population outlook (Humboldt County) Hauer SSP2
- Today (2025)
- 135,550 people
- By 2030
- 134,798 · -0.6%
- By 2040
- 132,222 · -2.5%
- By 2050
- 130,850 · -3.5%
- By 2075
- 128,656 · -5.1%
- By 2100
- 120,238 · -11.3%
Race, ethnicity, and origin ACS 2023
- Neighborhood character
- Predominantly White (83%)
- Race & ethnicity
- White 83% Hispanic / Latino 9% Two or more races 9% Native American 3%
- Hispanic origin (detail)
- Mexican 8%
- Common ancestry
- Italian 9% Portuguese 7% English 3%
- Foreign-born
- 2% · Canada
- Languages at home
- 96% English-only · Spanish 3% German/W. Germanic 1%
Political lean MEDSL · Humboldt
- 2024 margin
- Strong D (+28.4) · D 62.0% · R 33.6% · Other 4.5%
- 2008→2024 swing
- +0.2pp no change · 2008: 28.2pp · 2024: 28.4pp
- All cycles
- 2024: D+28.4 2020: D+33.4 2016: D+25.9 2012: D+26.2 2008: D+28.2
Not yet ingested
- Civics
- —
Market trends
- HPI YoY
- ▼ -3.38%
- Current HPI
- 154.2527
- Rent YoY
- —
- Metro
- —
- State GDP YoY
- ▲ 3.21%
- F500 in state
- 116
Industry mix (Fortune 500 HQ in CA)
| Industry | F500 HQs | Revenue |
|---|---|---|
| Technology | 27 | $1,492B |
|
||
| Financial Services | 3 | $174B |
|
||
| Retail | 3 | $44B |
|
||
| Insurance | 3 | $26B |
|
||
| Media / Entertainment | 2 | $115B |
|
||
| Pharmaceuticals / Biotech | 2 | $62B |
|
||
Price history
1 event — show timeline
- 2026-05-27 Listed $1,199,888 HAR
Cash-flow waterfall
monthlySold comps — $/sqft
last 12 mo · ≤1 miLoading sold comps…