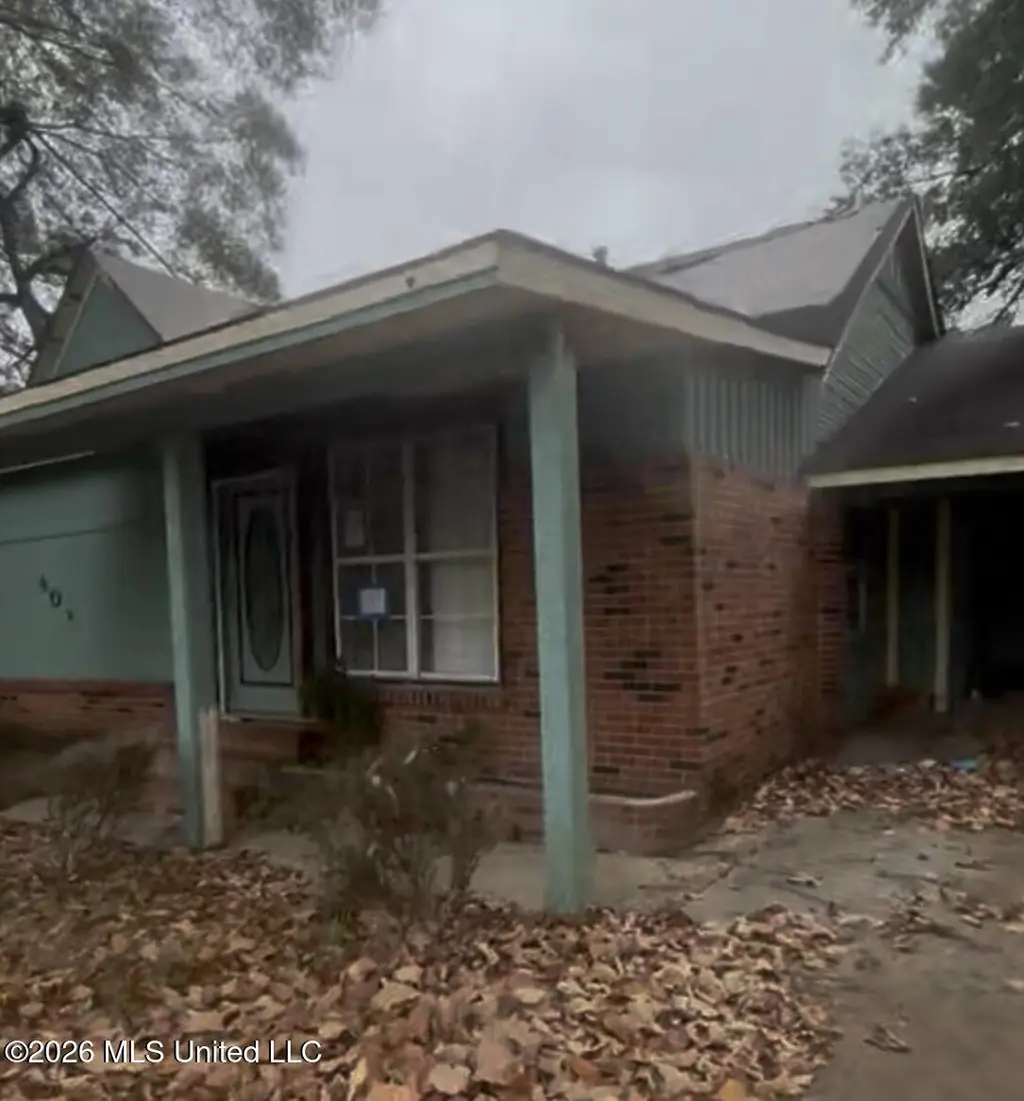
408 Mcallister St · Greenville, MS
Flood risk 1/10 · Minimal
- FEMA flood zone
- X
- Chance of flooding over 30 yrs
- 0.0%
- Est. flood insurance / yr
- $507 – $1,088
Fire risk 1/10 · Minimal
- Est. fire insurance / yr
- $1,241 – $2,305
Heat risk 7/10 · Major
- Hot days now (above 111°F)
- 7 days/yr
- Hot days in 30 yrs
- 20 days/yr
Wind risk 6/10 · Moderate
- Chance of severe wind over 30 yrs
- 37.0%
Air-quality risk 1/10 · Minimal
- Unhealthy air days now
- 0 days/yr
- Unhealthy air days in 30 yrs
- 0 days/yr
Risk factors via First Street. Map © Google.
Why this score? — see what drove the D grade
The composite is a weighted blend of 9 inputs, each scored 0–100. Each bar is that input's sub-score; the figure is the points it added to the 100-point composite (weight × sub-score).
- Cash flow +15.0/30.0
- ARV discount +7.5/15.0
- 1% rule +5.0/10.0
- DSCR +5.0/10.0
- Livability +2.9/5.0
- Rent growth +2.5/5.0
- Condition / age +2.5/5.0
- Schools +0.5/10.0
- Appreciation +0.0/10.0
$11,990
🖨 Deal sheet 📄 Offer letter ✓ Due diligence
Listing remarks
Great Investment Opportunity in Greenville. Recent foreclosure looking for the right investor to see the potential through on this home.
Key facts
- 7,840 sq ft lot
- Garage
- Built 1949
Property features AI
Exterior
- Parking: Detached carport (2 spaces); Driveway; Concrete parking surfaces
- Utilities: Public water; Public sewer; Other utilities
- Home design: Single-family house; One level
- Construction: Brick veneer and wood siding construction; Built in public-records year
- Exterior features: Brick patio/porch; Shingle roof
Interior
- Kitchen: Disposal
- Bedrooms: Primary bedroom; Two additional bedrooms
- Bathrooms: 1 full bathroom; 1 half bathroom
- Heating & cooling: Forced air heating; Central air conditioning
- Interior features: Total of 5 rooms; Wood-burning fireplace
Neighborhood map
What this means for you Summary
Snapshot
- This is a 3-bed/1.0-bath single-family listed at $12k.
Deal economics
- At list price, monthly cash flow is $770 ($9k/yr) — positive.
- The deal already cash-flows at list — no discount required.
- Meets the 1% rule at list price ($1k rent vs $12k).
- Cap rate 83.4% vs local median 4.5% in Greenville — top-decile yield for the area; either an underpriced asset or a hidden risk that comps aren't pricing in. Stress-test before assuming the spread holds.
Location & tenants
- Location reads 57/100 on livability (#284 in MS) — a working-class tenant base; expect higher turnover. Strengths: cost of living A+, housing A; Watch: schools F, amenities F, commute F.
- Greenville Public Schools (town): math 4% / reading 11% proficiency, ranked #126 of 130 in MS (top 97%) — low school quality limits family demand, transient renter base, plan for 1-2y turnover; 93% free/reduced lunch — lower-income household profile, screen leases tightly.
- Market conditions: 128 active listings in the ZIP; 10 units permitted in Washington County in 2024 (0 in 5+ unit buildings).
Forward outlook
- Local home prices are declining (-3.0%/yr); year-one equity from $82 of loan paydown is wiped out by about $360 of value loss. Plan a longer hold.
- Washington County population projected at -36% by 2050 — secular population decline; favor cash flow + early exit over multi-decade hold.
- At projected returns (-3.0% appreciation + 3.0% rent growth), your $3k cash investment doubles in ~1 year — after that, you're playing with house money.
Negotiation context
- Only 8 days on market — expect competitive offers; lowballing is unlikely to land.
Risks & watch-outs
- Watch-outs: built in 1949 — expect roof / HVAC / electrical / plumbing capex.
- Climate carrying-cost: major wind risk, 37% chance of damaging wind over 30y; extreme-heat days projected 7→20/yr by 2055 (HVAC capex compounding) — expect insurance premiums to compound above CPI over the hold.
Questions for the listing agent
- Built in 1949 — when were the roof, HVAC, electrical panel, plumbing, and water heater last replaced?
- Is there a deadline driving the sale (1031 exchange, divorce, estate, relocation)? That informs how much negotiation room exists.
- Schools are F-rated, which usually means shorter tenancies and higher turnover. Who's the typical renter profile here, and what's been the actual vacancy rate?
- The area grade is low — what's the realistic commute time and amenity access for the typical tenant pool here? Any planned neighborhood developments (good or bad) we should know about?
- What's the average days-on-market for RENTAL listings here right now (not sales)? A rising rental-DOM trend means longer vacancies and softer asking-rent achievability than the comps imply.
- What's the recent tenant-quality profile in this submarket — average credit score on applications, eviction rate, late-payment / NSF rate, and stable-employment percentage? A property-management company in the area should have these aggregated.
- How much new for-sale + rental construction is in the pipeline within 1–3 miles? Heavy new supply typically softens prices + rents 12–24 months out; constrained supply supports both.
Investment metrics
- 1% rule
- 9.01% ✓
- Cap rate
- 83.37%
- Cash-on-cash
- 275.27%
- DSCR
- 13.25
- GRM
- 0.9
CMA / ARV
- ARV (on-the-fly)
- $98,298
- Comps found
- 2
Show comp detail 2 sales within ~0.75 mi
| Address | Dist | Beds/Ba | Sqft | Sold | Price | $/sf | Match |
|---|---|---|---|---|---|---|---|
| 408 Mcallister St | 0.00mi | 3/1.5 | 2,485 (+9%) | 0mo | $11,990 | $5 | 83 |
| 441 S Washington Ave | 0.23mi | 3/3.0 | 2,565 (+12%) | 22mo | $110,000 | $43 | 42 |
Match score weights: distance 35% · size 25% · config 20% · recency 20%. Top-matched comps best support the ARV.
Projected returns pro-forma
-3.0% appreciation · 3.0% rent growth · sell at horizon
- IRR
- —
- Equity multiple
- 15.04×
- Total profit
- $47,123
- Equity at exit
- $1,788
- IRR
- —
- Equity multiple
- 32.06×
- Total profit
- $104,260
- Equity at exit
- $1,037
Cash invested: $3,357 (down + closing). Projections, not guarantees.
Landlord ↔ Tenant lean methodology
- Overall (STATE)
- 90 Strongly Landlord-Friendly
- State Mississippi
- 90 Strongly Landlord-Friendly · R+11
- County
- — inherits STATE
- City
- — inherits STATE
ZIP-level market 38701
- Active inventory
- 128
- Price-to-rent
- 0.9×
Monthly cashflow live
- Estimated rent
- $1,080 medium interval (Pro) →
- Mortgage (P&I)
- −$63
- Tax est. 1.5%
- −$15 /mo · $180/yr
- Insurance
- −$5
- HOA
- −$0
- Vacancy / Maint / Mgmt
- −$227
- Net cashflow
- $770
Break-even live
UW: 25.0% down · 7.5% · 30yr · 1.5% tax · 5.0% vac · 8.0% maint · 8.0% mgmt
Financing live
Cash to close
- Down payment
- $2,998
- Closing costs
- $360
- Reserves months
- —
- Total cash needed
- —
Loan-product check · same deal, 3 products live
Conventional
25% down · 7.5% · 30yr
- Down + closing
- —
- Monthly P&I
- —
- Monthly cashflow
- —
- DSCR
- —
- Eligible?
- —
Personal DTI + credit; lowest rate.
DSCR
20% down · 8.5% · 30yr
- Down + closing
- —
- Monthly P&I
- —
- Monthly cashflow
- —
- DSCR
- —
- Eligible?
- —
No personal income docs; deal must DSCR.
Hard money
10% down · 12.0% · 12mo
- Down + closing
- —
- Monthly P&I
- —
- Monthly cashflow
- —
- DSCR
- —
- Eligible?
- —
Short-term bridge; refi at stabilization.
Listing history 5 events
-
2026-06-04statusdays on market $11,990 Pending 8 DOM
-
2026-06-02days on market $11,990 Active 7 DOM
-
2026-06-01days on market $11,990 Active 6 DOM
-
2026-05-31days on market $11,990 Active 5 DOM
-
2026-05-26$11,990 Active
ⓘ Source: listings_history table (triggers on properties + properties_extension) + one-shot
backfill from property_details.listing_events for pre-trigger history.
Climate risk First Street
- Flood 1/10 Low FEMA zone X · 0% chance over 30 yrs
- Wildfire 1/10 Low
- Heat 7/10 Severe 7 d/yr ≥111°F today · 20 d/yr by 30 yrs out
- Wind 6/10 Major 37% chance of damaging wind over 30 yrs
- Air quality 1/10 Low 0 unhealthy d/yr today · 0 by 30 yrs out
Nearby sold comps map
Loading sold comps map…
Walkable amenities ~0.75 mi
Loading nearby amenities…
Taxation est. · year 1
- Rental income
- $12,957
- − Mortgage interest
- −$672
- − Property taxes
- −$180
- − Insurance
- −$60
- − Repairs & maintenance
- −$1,037
- − Management
- −$1,037
- − Depreciation
- −$349
- Taxable income
- $9,623
- Est. tax owed @ 24.0%
- −$2,310
- After-tax cash flow
- $6,932/yr
For passive investors: Depreciation is non-cash, so a rental often shows a tax loss while cash-flowing — sheltering income. Rental losses are passive: they offset passive income freely, and up to $25,000/yr can offset ordinary (W-2) income if you actively participate and your MAGI is under $100k (phasing out to $0 by $150k); unused losses carry forward. On sale, claimed depreciation is recaptured at up to 25%, and gains may owe capital-gains tax (a 1031 exchange can defer both). Figures are a year-1 estimate at your 24.0% rate — not tax advice; consult a CPA.
Schools (NCES district)
- District
- Greenville Public Schools
- NCES district ID
- 2801620
- Math proficiency
- 4% ▼ -20.00%
- Reading proficiency
- 11% ▼ -12.00%
- Median HH income
- $26,432
- Composite
- 5.27/100
- National rank
- #10035
- State rank
- #126 of 130 in MS
Livability — Greenville
- Score
- 57/100
- State rank
- #284
- US rank
- #21778
Category grades
Schools grade is shown separately in the Schools card above.
Census & demographics
- Census place
- Greenville, MS
- Population (ZIP)
- 21,260
Population outlook (Washington County) Hauer SSP2
- Today (2025)
- 41,424 people
- By 2030
- 38,061 · -8.1%
- By 2040
- 31,752 · -23.3%
- By 2050
- 26,394 · -36.3%
- By 2075
- 17,180 · -58.5%
- By 2100
- 12,936 · -68.8%
Race, ethnicity, and origin ACS 2023
- Neighborhood character
- Predominantly Black (73%)
- Race & ethnicity
- Black 73% White 24% Asian 2%
- Common ancestry
- Lithuanian 1%
- Foreign-born
- 1%
- Languages at home
- 96% English-only · Spanish 1% Other Indo-European 1%
Political lean MEDSL · Washington
- 2024 margin
- Solid D (+35.0) · D 67.0% · R 32.0% · Other 1.1%
- 2008→2024 swing
- +0.2pp no change · 2008: 34.7pp · 2024: 35.0pp
- All cycles
- 2024: D+35.0 2020: D+40.0 2016: D+36.4 2012: D+42.7 2008: D+34.7
Not yet ingested
- Civics
- —
Market trends
- HPI YoY
- ▼ -102.75%
- Current HPI
- 52.6126
- Rent YoY
- —
- Metro
- —
- State GDP YoY
- —
- F500 in state
- 0
Price history
1 event — show timeline
- 2026-05-26 Listed $11,990 MLSU
Property tax history
+2.8%/yrLatest (2025): $1,146 · +8682.1% YoY. Source: county tax records.
Cash-flow waterfall
monthlySold comps — $/sqft
last 12 mo · ≤1 miLoading sold comps…