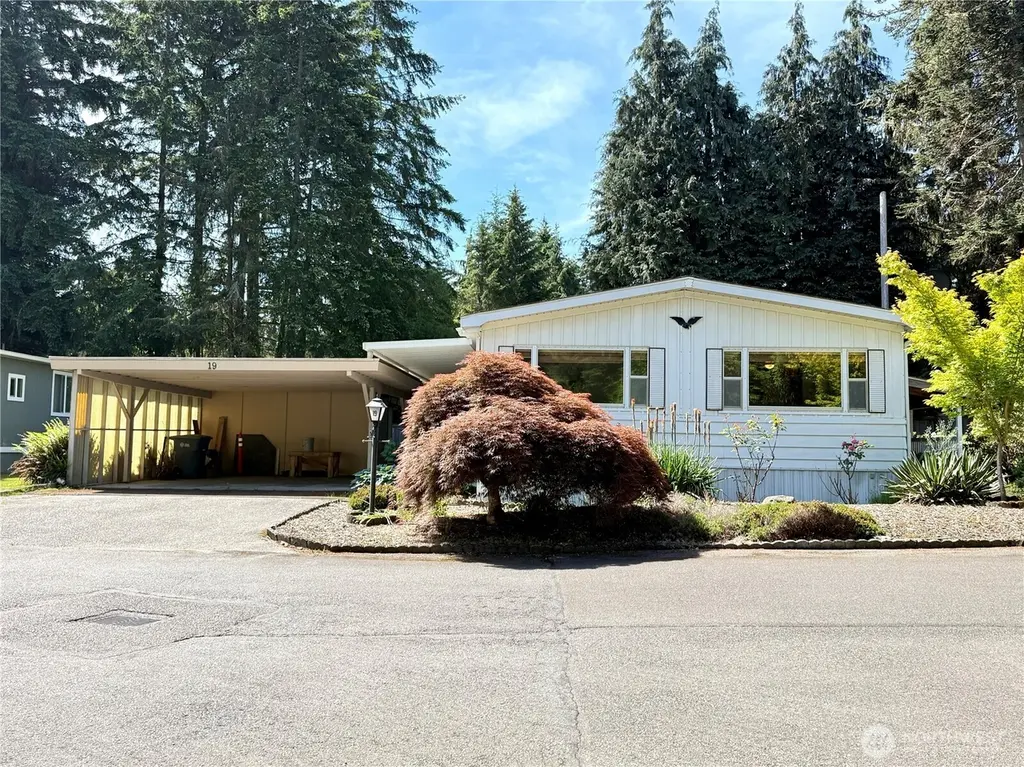
10414 Peacock Hill Ave #19 · Gig Harbor, WA
Flood risk 1/10 · Minimal
- FEMA flood zone
- X (unshaded)
- Chance of flooding over 30 yrs
- 0.0%
- Est. flood insurance / yr
- $507 – $1,088
Fire risk 1/10 · Minimal
- Est. fire insurance / yr
- $604 – $1,122
Heat risk 3/10 · Minor
- Hot days now (above 87°F)
- 7 days/yr
- Hot days in 30 yrs
- 14 days/yr
Wind risk 1/10 · Minimal
- Chance of severe wind over 30 yrs
- —
Air-quality risk 6/10 · Moderate
- Unhealthy air days now
- 8 days/yr
- Unhealthy air days in 30 yrs
- 8 days/yr
Risk factors via First Street. Map © Google.
Why this score? — see what drove the A- grade
The composite is a weighted blend of 9 inputs, each scored 0–100. Each bar is that input's sub-score; the figure is the points it added to the 100-point composite (weight × sub-score).
- Cash flow +30.0/30.0
- ARV discount +15.0/15.0
- 1% rule +10.0/10.0
- DSCR +10.0/10.0
- Schools +6.0/10.0
- Appreciation +5.0/10.0
- Livability +3.7/5.0
- Rent growth +2.5/5.0
- Condition / age +2.5/5.0
$165,000
🖨 Deal sheet 📄 Offer letter ✓ Due diligence
Listing remarks
Updated Double-Wide in Gig Harbor’s Hillcrest 55+ Community! A peaceful and well-maintained community conveniently located in the desirable Peacock Hill area of Gig Harbor. Just minutes from the historic downtown waterfront, shopping, restaurants, Costco, and everyday amenities, this home offers comfort, convenience, and affordability in one great package. This double-wide manufactured home has already received major updates including a new heat pump, luxury vinyl plank flooring, and a beautifully remodeled kitchen and bathroom. The home is move-in ready while still offering room for your own finishing touches and personal style. Enjoy outdoor living year-round under the expansive cov
Key facts
- Covered deck
- Level yard
- Covered parking
Tags
Property features AI
Finance
- Other: Buyer brokerage compensation: 3%
- Financial info: Listing terms include Cash, Conventional, and Lease Purchase
- HOA & community: Hillcrest Mobile Home Park (park approved for sale); Senior community; Number of homes in park: 64; Pets allowed: see remarks; Land lease: $960/month
Exterior
- Parking: Carport
- Utilities: Electric energy source; Electric water heater (closet accessed outside, right rear); Community/public water (Hillcrest MHP - HOA); Septic (Hillcrest MHP - HOA); Peninsula Light power; Cable and internet: various providers
- Home design: Manufactured double-wide home; One level; North-facing; Average condition; Make: Marlette; Style: Manufactured - Double Wide
- Construction: Metal/vinyl construction materials; Composition roof; Wood skirting; Pillar/post/pier foundation with tie downs; Manufactured house structure type; Manufactured before 06/15/1976 (not post-1976)
- Exterior features: Metal/vinyl exterior; Patio/porch/deck; Landscaped; Skylights; Walk-in closet; Dead-end street; Paved access; Has view
Interior
- Kitchen: Dishwasher; Refrigerator; Stove/Range
- Bedrooms: 2 bedrooms
- Flooring: Laminate; Vinyl plank
- Bathrooms: 1 full bath; 1 three-quarter bath; 1 bathtub; 1 shower
- Heating & cooling: Forced air heating; Heat pump; Central air conditioning
- Interior features: Fireplace (electric); Water heater
- Laundry & utility: Washer; Dryer
Neighborhood map
What this means for you Summary
Snapshot
- This is a 2-bed/2.0-bath manufactured listed at $165k.
Deal economics
- At list price, monthly cash flow is $1k ($16k/yr) — positive.
- The deal already cash-flows at list — no discount required.
- Meets the 1% rule at list price ($3k rent vs $165k).
- Recommended offer: $163k (1.5% below list) — sets the bar for market timing.
- Cap rate 16.2% vs local median 1.9% in Gig Harbor — top-decile yield for the area; either an underpriced asset or a hidden risk that comps aren't pricing in. Stress-test before assuming the spread holds.
Location & tenants
- Location reads 74/100 on livability (#177 in WA, #4,581 nationally) — a middle-class / working-renter tenant base. Strengths: schools A+, commute A+, employment A+; Watch: health & safety C-, amenities F, cost of living F.
- Peninsula School District (suburban): math 61% / reading 72% proficiency, ranked #21 of 291 in WA (top 7%) — acceptable for families but not a draw, mixed tenant base, ~2y average lease; only 19% free/reduced lunch — higher-income household profile.
- Market conditions: 1 active listings in the ZIP; 2 comparable units currently listed for rent nearby; 3,209 units permitted in Pierce County in 2024 (1,269 in 5+ unit buildings).
Forward outlook
- In year one you build about $6k of equity ($1k loan paydown + $5k appreciation (3.0% local appreciation)).
- Pierce County population projected at +26% by 2050 — long-run rental-demand tailwind backs the buy-and-hold thesis.
- At projected returns (3.0% appreciation + 3.0% rent growth), your $46k cash investment doubles in ~3 years — after that, you're playing with house money.
- By year 6, paydown + projected appreciation supports a ~$32k cash-out refi (75% LTV) — recoverable capital for the next deal without selling this one.
Negotiation context
- It's been on market 17 days — a 2% lower offer ($163k) is reasonable based on typical stale-listing flexibility.
- 2 sale attempts since 20y ago with the ask held roughly flat each time — persistent listings suggest the price (not the market) is what's stuck; bring a comps-based counter.
- Current owner paid $15k; list at $165k implies a 1000% gain — meaningful room to come down on a strong offer.
Questions for the listing agent
- Built in 1972 — when were the roof, HVAC, electrical panel, plumbing, and water heater last replaced?
- Is there a deadline driving the sale (1031 exchange, divorce, estate, relocation)? That informs how much negotiation room exists.
- Schools are A-rated — typically a magnet for longer-tenancy family renters. What's the average tenant stay here, and is there a school-zone premium baked into asking?
- What's the average days-on-market for RENTAL listings here right now (not sales)? A rising rental-DOM trend means longer vacancies and softer asking-rent achievability than the comps imply.
- What's the recent tenant-quality profile in this submarket — average credit score on applications, eviction rate, late-payment / NSF rate, and stable-employment percentage? A property-management company in the area should have these aggregated.
- How much new for-sale + rental construction is in the pipeline within 1–3 miles? Heavy new supply typically softens prices + rents 12–24 months out; constrained supply supports both.
Investment metrics
- 1% rule
- 1.79% ✓
- Cap rate
- 16.16%
- Cash-on-cash
- 35.23%
- DSCR
- 2.57
- GRM
- 4.6
CMA / ARV
- ARV (on-the-fly)
- $232,400
- Comps found
- 1
Show comp detail 1 sale within ~0.75 mi
| Address | Dist | Beds/Ba | Sqft | Sold | Price | $/sf | Match |
|---|---|---|---|---|---|---|---|
| 10414 Peacock Hill Ave #54 | 0.00mi | 2/2.0 | 1,430 (+8%) | 9mo | $249,950 | $175 | 80 |
Match score weights: distance 35% · size 25% · config 20% · recency 20%. Top-matched comps best support the ARV.
Projected returns pro-forma
3.0% appreciation · 3.0% rent growth · sell at horizon
- IRR
- 40.9%
- Equity multiple
- 3.30×
- Total profit
- $106,216
- Equity at exit
- $74,191
- IRR
- 40.8%
- Equity multiple
- 6.56×
- Total profit
- $256,998
- Equity at exit
- $114,337
Cash invested: $46,200 (down + closing). Projections, not guarantees.
Landlord ↔ Tenant lean methodology
- Overall (STATE)
- 28 Tenant-Leaning
- State Washington
- 28 Tenant-Leaning · D+8
- County
- — inherits STATE
- City
- — inherits STATE
ZIP-level market 98322
- Active inventory
- 1
- Price-to-rent
- 4.6×
Monthly cashflow live
- Estimated rent
- $2,960 medium interval (Pro) →
- Mortgage (P&I)
- −$865
- Tax from tax record
- −$48 /mo · $575/yr
- Insurance
- −$69
- HOA
- −$0
- Vacancy / Maint / Mgmt
- −$622
- Net cashflow
- $1,356
Break-even live
UW: 25.0% down · 7.5% · 30yr · 1.5% tax · 5.0% vac · 8.0% maint · 8.0% mgmt
Financing live
Cash to close
- Down payment
- $41,250
- Closing costs
- $4,950
- Reserves months
- —
- Total cash needed
- —
Loan-product check · same deal, 3 products live
Conventional
25% down · 7.5% · 30yr
- Down + closing
- —
- Monthly P&I
- —
- Monthly cashflow
- —
- DSCR
- —
- Eligible?
- —
Personal DTI + credit; lowest rate.
DSCR
20% down · 8.5% · 30yr
- Down + closing
- —
- Monthly P&I
- —
- Monthly cashflow
- —
- DSCR
- —
- Eligible?
- —
No personal income docs; deal must DSCR.
Hard money
10% down · 12.0% · 12mo
- Down + closing
- —
- Monthly P&I
- —
- Monthly cashflow
- —
- DSCR
- —
- Eligible?
- —
Short-term bridge; refi at stabilization.
Rent comps 2 comps
| Address | Beds | Baths | Sqft | Rent | $/sqft | DOM | Units | Dist |
|---|---|---|---|---|---|---|---|---|
| 4113 105th Street Ct Gig Harbor, WA | 3.0 | 2.0 | 1594 | $3,000 | $1.88 | 15d | 1 | 0.19mi |
| 11315 17th Avenue Ct NW Gig Harbor, WA | 3.0 | 2.0 | 1338 | $2,700 | $2.02 | 43d | 1 | 1.48mi |
Listing history 12 events
-
2026-06-18days on market $165,000 Active 17 DOM
-
2026-06-17days on market $165,000 Active 16 DOM
-
2026-06-16days on market $165,000 Active 15 DOM
-
2026-06-15days on market $165,000 Active 14 DOM
-
2026-06-13days on market $165,000 Active 12 DOM
-
2026-06-09days on market $165,000 Active 8 DOM
-
2026-06-08days on market $165,000 Active 7 DOM
-
2026-06-07days on market $165,000 Active 6 DOM
-
2026-06-04days on market $165,000 Active 3 DOM
-
2026-06-03days on market $165,000 Active 2 DOM
-
2026-06-02remarks 693-char remark
-
2026-06-02$165,000 Active 1 DOM
ⓘ Source: listings_history table (triggers on properties + properties_extension) + one-shot
backfill from property_details.listing_events for pre-trigger history.
Tax reassessment forecast WA · Resets to sale price
- Current annual tax
- $575 · $48/mo
- Projected year-2 tax
- $1,617 · $135/mo
- Expected delta
- +$1,042/yr (+$87/mo · 181.0%)
ⓘ Screening estimate from a state-policy table — verify with the county assessor before closing.
Climate risk First Street
- Flood 1/10 Low FEMA zone X (unshaded) · 0% chance over 30 yrs
- Wildfire 1/10 Low
- Heat 3/10 Moderate 7 d/yr ≥87°F today · 14 d/yr by 30 yrs out
- Wind 1/10 Low
- Air quality 6/10 Major 8 unhealthy d/yr today · 8 by 30 yrs out
Nearby sold comps map
Loading sold comps map…
Walkable amenities ~0.75 mi
Loading nearby amenities…
Taxation est. · year 1
- Rental income
- $35,520
- − Mortgage interest
- −$9,243
- − Property taxes
- −$575
- − Insurance
- −$825
- − Repairs & maintenance
- −$2,842
- − Management
- −$2,842
- − Depreciation
- −$4,800
- Taxable income
- $14,394
- Est. tax owed @ 24.0%
- −$3,455
- After-tax cash flow
- $12,823/yr
For passive investors: Depreciation is non-cash, so a rental often shows a tax loss while cash-flowing — sheltering income. Rental losses are passive: they offset passive income freely, and up to $25,000/yr can offset ordinary (W-2) income if you actively participate and your MAGI is under $100k (phasing out to $0 by $150k); unused losses carry forward. On sale, claimed depreciation is recaptured at up to 25%, and gains may owe capital-gains tax (a 1031 exchange can defer both). Figures are a year-1 estimate at your 24.0% rate — not tax advice; consult a CPA.
Schools (NCES district)
- District
- Peninsula School District
- NCES district ID
- 5306690
- Math proficiency
- 61% ▲ 1.00%
- Reading proficiency
- 72% ▼ -1.00%
- Median HH income
- $76,796
- Composite
- 60.35/100
- National rank
- #1718
- State rank
- #21 of 291 in WA
Livability — Gig Harbor
- Score
- 74/100
- State rank
- #177
- US rank
- #4581
Category grades
Schools grade is shown separately in the Schools card above.
Census & demographics
- Census place
- Gig Harbor, WA
Population outlook (Pierce County) Hauer SSP2
- Today (2025)
- 956,648 people
- By 2030
- 1,010,862 · +5.7%
- By 2040
- 1,113,170 · +16.4%
- By 2050
- 1,206,524 · +26.1%
- By 2075
- 1,436,425 · +50.2%
- By 2100
- 1,563,654 · +63.5%
Not yet ingested
- Political lean
- —
- Race & ethnicity
- —
- Common origin
- —
- Civics
- —
Market trends
- HPI YoY
- —
- Current HPI
- —
- Rent YoY
- —
- Metro
- —
- State GDP YoY
- ▲ 4.65%
- F500 in state
- 22
Industry mix (Fortune 500 HQ in WA)
| Industry | F500 HQs | Revenue |
|---|---|---|
| Retail | 2 | $269B |
|
||
| Technology / Retail | 1 | $638B |
|
||
| Technology | 1 | $245B |
|
||
| Telecommunications | 1 | $38B |
|
||
| Food / Beverage | 1 | $36B |
|
||
| Automotive / Trucks | 1 | $34B |
|
||
Price history
+746.2% since first listed4 events — show timeline
- 2026-06-01 Listed $165,000 NWMLS as Distributed by MLS Grid
- 2007-03-28 Sold (MLS) $15,000 NWMLS as Distributed by MLS Grid
- 2007-03-26 Delisted — NWMLS as Distributed by MLS Grid
- 2006-12-13 Listed $19,500 NWMLS as Distributed by MLS Grid
Property tax history
+9.4%/yrLatest (2026): $575 · +13.4% YoY. Source: county tax records.
Cash-flow waterfall
monthlySold comps — $/sqft
last 12 mo · ≤1 miLoading sold comps…