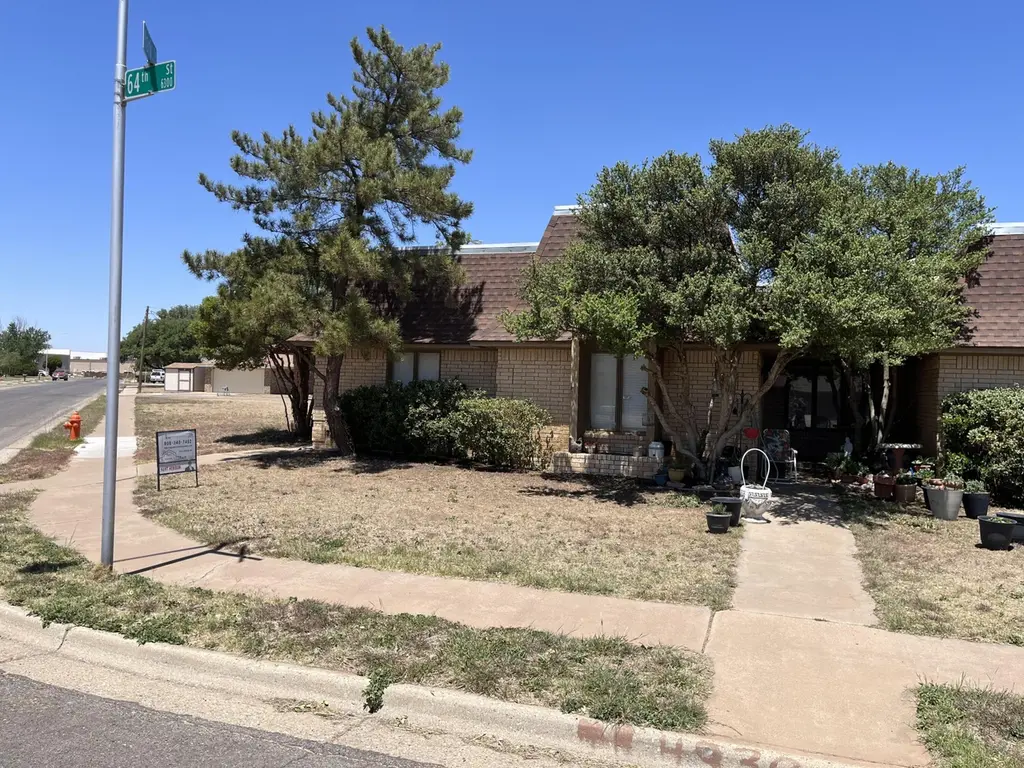
4930 64th St · Lubbock, TX
Flood risk 1/10 · Minimal
- FEMA flood zone
- X (unshaded)
- Chance of flooding over 30 yrs
- 0.0%
- Est. flood insurance / yr
- $507 – $1,088
Fire risk 1/10 · Minimal
- Est. fire insurance / yr
- $1,222 – $2,270
Heat risk 5/10 · Moderate
- Hot days now (above 99°F)
- 7 days/yr
- Hot days in 30 yrs
- 21 days/yr
Wind risk 2/10 · Minimal
- Chance of severe wind over 30 yrs
- —
Air-quality risk 2/10 · Minimal
- Unhealthy air days now
- 1 days/yr
- Unhealthy air days in 30 yrs
- 1 days/yr
Risk factors via First Street. Map © Google.
Why this score? — see what drove the D grade
The composite is a weighted blend of 9 inputs, each scored 0–100. Each bar is that input's sub-score; the figure is the points it added to the 100-point composite (weight × sub-score).
- Cash flow +12.7/30.0
- ARV discount +7.5/15.0
- Livability +4.0/5.0
- DSCR +3.8/10.0
- 1% rule +3.7/10.0
- Schools +3.1/10.0
- Rent growth +2.6/5.0
- Condition / age +2.5/5.0
- Appreciation +0.0/10.0
$129,000
🖨 Deal sheet (PDF) 📄 Offer letter ✓ Due diligence
Listing remarks MLS
Can be sold individually, or as a package with 4928, & 4932 64th. Currently vacant, yet could rent for $1,000+/m. Just painted with new floor covering throughout.
Key facts
- New roof
- Garage
- Built 1984
Tags
Neighborhood map
What this means for you Summary
Snapshot
- This is a 2-bed/2.0-bath townhouse listed at $129k.
Deal economics
- At list price, monthly cash flow is $-14 ($-166/yr) — negative.
- To cash-flow at today's rent, offer at most $127k (1.9% below list).
- To meet the 1% rule (rent ≥ 1% of price), the offer needs to be $112k (12.9% below list).
- Recommended offer: $112k (12.9% below list) — sets the bar for 1% rule.
Location & tenants
- Location reads 80/100 on livability (#37 in TX, #1,749 nationally) — a professional / high-income tenant draw. Strengths: commute A+, cost of living A+, housing A+; Watch: employment C-, crime F.
- Lubbock ISD (urban): math 36% / reading 39% proficiency, ranked #481 of 826 in TX (top 58%) — families likely to look elsewhere, expect single-tenant / working-renter base with shorter leases; 60% free/reduced lunch — lower-income household profile, screen leases tightly.
- Zoned schools: Williams El (math 32% / reading 37%, grade F, #1,995 of 4,322 statewide, top 50%, 307 students, 76% FRL); Coronado H S (math 34% / reading 38%, grade F, #930 of 1,632 statewide, top 57%, 1,960 students, 66% FRL).
- Market conditions: Rents flat; 91 active listings in the ZIP; 40 comparable units currently listed for rent nearby; rentals at typical pace (median 23d on market — plan ~3-4 weeks tenant-placement turnaround); 42% of comp listings sitting > 30 days — soft ceiling on asking rent; 2,219 units permitted in Lubbock County in 2024 (252 in 5+ unit buildings).
Forward outlook
- Local home prices are declining (-3.0%/yr); year-one equity from $892 of loan paydown is wiped out by about $4k of value loss. Plan a longer hold.
- Lubbock County population projected at +39% by 2050 — long-run rental-demand tailwind backs the buy-and-hold thesis.
Negotiation context
- It's been on market 35 days — a 3% lower offer ($125k) is reasonable based on typical stale-listing flexibility.
Risks & watch-outs
- Climate carrying-cost: extreme-heat days projected 7→21/yr by 2055 (HVAC capex compounding) — expect insurance premiums to compound above CPI over the hold.
Questions for the listing agent
- What do current leases actually rent for vs. the listed asking? Can we see a recent rent roll and the last 12 months of T-12 income?
- It's been on market 35 days. Have you received any prior offers? Is the seller open to a 13% concession, seller financing, or rate buy-down credit?
- Is there a deadline driving the sale (1031 exchange, divorce, estate, relocation)? That informs how much negotiation room exists.
- Schools are D-rated, which usually means shorter tenancies and higher turnover. Who's the typical renter profile here, and what's been the actual vacancy rate?
- Crime grade is F in this area — have there been break-ins, vandalism, or insurance claims at this property in the last 3 years? What carrier currently insures it and at what premium?
- The area grade is low — what's the realistic commute time and amenity access for the typical tenant pool here? Any planned neighborhood developments (good or bad) we should know about?
- What's the average days-on-market for RENTAL listings here right now (not sales)? A rising rental-DOM trend means longer vacancies and softer asking-rent achievability than the comps imply.
- What's the recent tenant-quality profile in this submarket — average credit score on applications, eviction rate, late-payment / NSF rate, and stable-employment percentage? A property-management company in the area should have these aggregated.
- How much new for-sale + rental construction is in the pipeline within 1–3 miles? Heavy new supply typically softens prices + rents 12–24 months out; constrained supply supports both.
Investment metrics
- 1% rule
- 0.87% ✗
- Cap rate
- 6.16%
- Cash-on-cash
- -0.46%
- DSCR
- 0.98
- GRM
- 9.6
CMA / ARV
No comps found within radius.
Projected returns pro-forma
-3.0% appreciation · 0.56% rent growth · sell at horizon
- IRR
- -19.8%
- Equity multiple
- 0.32×
- Total profit
- $-24,452
- Equity at exit
- $19,234
- IRR
- -19.1%
- Equity multiple
- 0.09×
- Total profit
- $-32,851
- Equity at exit
- $11,154
Cash invested: $36,120 (down + closing). Projections, not guarantees.
Landlord ↔ Tenant lean methodology
- Overall (STATE)
- 87 Strongly Landlord-Friendly
- State Texas
- 87 Strongly Landlord-Friendly · R+5
- County
- — inherits STATE
- City
- — inherits STATE
ZIP-level market 79414
- Home prices YoY
- -27.8%
- Rents YoY
- 0.6%
- Active inventory
- 91
- Price-to-rent
- 9.6×
Monthly cashflow live
- Estimated rent
- $1,123 high interval (Pro) →
- Mortgage (P&I)
- −$676
- Tax from tax record
- −$171 /mo · $2,052/yr
- Insurance
- −$54
- HOA
- −$0
- Vacancy / Maint / Mgmt
- −$236
- Net cashflow
- $-14
Break-even live
Sensitivity live
| Price | -10% $59 | -5% $23 | +0% $-14 | +5% $-50 | +10% $-87 |
|---|---|---|---|---|---|
| Rent | -10% $-103 | -5% $-58 | +0% $-14 | +5% $31 | +10% $75 |
| Rate | -1.0pp $51 | -0.5pp $19 | base $-14 | +0.5pp $-47 | +1.0pp $-81 |
UW: 25.0% down · 7.5% · 30yr · 1.5% tax · 5.0% vac · 8.0% maint · 8.0% mgmt
Financing live
Cash to close
- Down payment
- $32,250
- Closing costs
- $3,870
- Reserves months
- —
- Total cash needed
- —
Loan-product check · same deal, 3 products live
Conventional
25% down · 7.5% · 30yr
- Down + closing
- —
- Monthly P&I
- —
- Monthly cashflow
- —
- DSCR
- —
- Eligible?
- —
Personal DTI + credit; lowest rate.
DSCR
20% down · 8.5% · 30yr
- Down + closing
- —
- Monthly P&I
- —
- Monthly cashflow
- —
- DSCR
- —
- Eligible?
- —
No personal income docs; deal must DSCR.
Hard money
10% down · 12.0% · 12mo
- Down + closing
- —
- Monthly P&I
- —
- Monthly cashflow
- —
- DSCR
- —
- Eligible?
- —
Short-term bridge; refi at stabilization.
Rent comps 40 comps
| Address | Beds | Baths | Sqft | Rent | $/sqft | DOM | Units | Dist |
|---|---|---|---|---|---|---|---|---|
| 6302 York Dr Unit 6302 B York Lubbock, TX | 2.0 | 1.0 | 1052 | $1,195 | $1.14 | 46d | 1 | 0.11mi |
| 4818 66th St Unit B Lubbock, TX | 3.0 | 2.0 | 1334 | $975 | $0.73 | 46d | 1 | 0.17mi |
| 5016 61st St Lubbock, TX | 2.0 | 2.0 | 1395 | $1,500 | $1.08 | 46d | 1 | 0.23mi |
| 4806 60th St Lubbock, TX | 3.0 | 2.0 | 1423 | $1,375 | $0.97 | 15d | 1 | 0.34mi |
| 4711 58th St Unit A Lubbock, TX | 3.0 | 1.5 | 1100 | $1,025 | $0.93 | 23d | 1 | 0.47mi |
| 7001 Utica Ave Lubbock, TX | 1.0–2.0 | 1.0–2.0 | 944 | $1,100 | $1.16 | 46d | 13 | 0.50mi |
| 6504 Quaker Ave Lubbock, TX | 1.0–2.0 | 1.0 | 725 | $1,016 | $1.40 | 15d | 11 | 0.55mi |
| 6508 Albany Ave Lubbock, TX | 2.0 | 1.0 | 1115 | $1,000 | $0.90 | 23d | 1 | 0.55mi |
| 6402 Albany Ave Lubbock, TX | 1.0–3.0 | 1.0–2.0 | 802 | $824 | $1.03 | 46d | 4 | 0.55mi |
| 4501 71st St Lubbock, TX | 1.0–2.0 | 1.0–2.0 | 845 | $1,095 | $1.30 | 46d | 9 | 0.71mi |
| 5405 66th St Lubbock, TX | 1.0–3.0 | 1.0–2.0 | 874 | $1,010 | $1.16 | 23d | 19 | 0.71mi |
| 4804 76th St Unit A Lubbock, TX | 2.0 | 2.0 | 1333 | $1,350 | $1.01 | 46d | 1 | 0.73mi |
| 5011 52nd St Lubbock, TX | 3.0 | 2.0 | 1292 | $1,500 | $1.16 | 23d | 1 | 0.74mi |
| 5128 Aberdeen Ave Lubbock, TX | 1.0–2.0 | 1.0–1.5 | 925 | $915 | $0.99 | 23d | 9 | 0.76mi |
| 5128 Aberdeen Ave Unit 206 Lubbock, TX | 2.0 | 1.5 | 1100 | $915 | $0.83 | 23d | 1 | 0.76mi |
| 4602 54th St Lubbock, TX | 1.0–2.0 | 1.0–2.0 | 764 | $975 | $1.28 | 15d | 11 | 0.79mi |
| 4644 52nd St Lubbock, TX | 2.0 | 1.0 | 836 | $775 | $0.93 | 15d | 1 | 0.82mi |
| 4638 52nd St Lubbock, TX | 2.0 | 1.0 | 836 | $749 | $0.90 | 46d | 1 | 0.83mi |
| 4630 52nd St Lubbock, TX | 2.0 | 1.0 | 836 | $699 | $0.84 | 46d | 1 | 0.84mi |
| 4626 52nd St Lubbock, TX | 2.0 | 1.0 | 836 | $775 | $0.93 | 15d | 1 | 0.85mi |
| 4313 58th St Lubbock, TX | 2.0 | 1.5 | 1165 | $1,099 | $0.94 | 46d | 1 | 0.86mi |
| 6027 Orlando Ave Lubbock, TX | 3.0 | 2.0 | 1114 | $1,400 | $1.26 | 23d | 1 | 0.87mi |
| 4604 52nd St Lubbock, TX | 2.0 | 1.0 | 836 | $749 | $0.90 | 46d | 1 | 0.90mi |
| 4303 58th St Unit a Lubbock, TX | 2.0 | 1.5 | 1170 | $1,050 | $0.90 | 46d | 1 | 0.92mi |
| 5102 80th St Lubbock, TX | 2.0 | 2.0 | 870 | $1,098 | $1.26 | 46d | 1 | 0.96mi |
| 5202 Bangor Ave Lubbock, TX | 2.0 | 1.5 | 1080 | $987 | $0.91 | 15d | 11 | 0.98mi |
| 6603 Elkhart Ave Unit A Lubbock, TX | 2.0 | 1.5 | 1334 | $1,300 | $0.97 | 46d | 1 | 1.00mi |
| 5204 50th St Lubbock, TX | 2.0–3.0 | 2.0 | 1050 | $939 | $0.89 | 15d | 2 | 1.02mi |
| 4926 48th St Lubbock, TX | 3.0 | 2.0 | 1354 | $1,500 | $1.11 | 23d | 1 | 1.03mi |
| 5401 50th St Lubbock, TX | 1.0–3.0 | 1.0–2.0 | 1018 | $899 | $0.88 | 15d | 11 | 1.04mi |
| 4313 53rd St Unit B Lubbock, TX | 2.0 | 1.5 | 1368 | $1,200 | $0.88 | 46d | 1 | 1.04mi |
| 5001 Chicago Ave Lubbock, TX | 1.0–2.0 | 1.0–2.0 | 715 | $1,019 | $1.43 | 15d | 15 | 1.06mi |
| 4705 Albany Ave Lubbock, TX | 2.0 | 2.0 | 926 | $742 | $0.80 | 15d | 5 | 1.07mi |
| 5550 56th St Lubbock, TX | 1.0–3.0 | 1.0–2.0 | 958 | $1,010 | $1.05 | 15d | 21 | 1.08mi |
| 4602 50th St Lubbock, TX | 1.0–3.0 | 1.0–2.5 | 1080 | $1,043 | $0.97 | 15d | 9 | 1.08mi |
| 4320 52nd St Unit B Lubbock, TX | 2.0 | 1.5 | 1200 | $1,395 | $1.16 | 46d | 1 | 1.09mi |
| 5302 48th St Lubbock, TX | 3.0 | 2.0 | 1368 | $1,450 | $1.06 | 23d | 1 | 1.11mi |
| 7911 Albany Ave Unit A Lubbock, TX | 3.0 | 2.0 | 1441 | $1,350 | $0.94 | 23d | 1 | 1.12mi |
| 7911 Albany Ave Unit B Lubbock, TX | 2.0 | 2.0 | 1441 | $1,350 | $0.94 | 15d | 1 | 1.12mi |
| 5002 46th St Lubbock, TX | 3.0 | 2.0 | 1369 | $1,450 | $1.06 | 46d | 1 | 1.15mi |
Listing history 15 events
-
2026-06-10days on market $129,000 Active 35 DOM
-
2026-06-09days on market $129,000 Active 34 DOM
-
2026-06-08days on market $129,000 Active 33 DOM
-
2026-06-07days on market $129,000 Active 32 DOM
-
2026-06-05days on market $129,000 Active 29 DOM
-
2026-06-03days on market $129,000 Active 28 DOM
-
2026-06-02days on market $129,000 Active 27 DOM
-
2026-06-01days on market $129,000 Active 26 DOM
-
2026-05-31days on market $129,000 Active 25 DOM
-
2026-05-30days on market $129,000 Active 24 DOM
-
2026-05-06$129,000 Active 293-char remark
-
2021-11-08soldstatus 168-char remark
Show marketing remark (168 chars)
Can be sold individually, or as a package with 4928, & 4932 64th. Currently vacant, yet could rent for $1,000+/m. Just painted with new floor covering throughout.
-
2021-10-06$120,000 168-char remark
Show marketing remark (168 chars)
Can be sold individually, or as a package with 4928, & 4932 64th. Currently vacant, yet could rent for $1,000+/m. Just painted with new floor covering throughout.
-
2009-09-03soldstatus
-
1990-12-01soldstatus
ⓘ Source: listings_history table (triggers on properties + properties_extension) + one-shot
backfill from property_details.listing_events for pre-trigger history.
Tax reassessment forecast TX · Resets to sale price
- Current annual tax
- $2,052 · $171/mo
- Projected year-2 tax
- $2,361 · $197/mo
- Expected delta
- +$308/yr (+$26/mo · 15.0%)
ⓘ Screening estimate from a state-policy table — verify with the county assessor before closing.
Climate risk First Street
- Flood 1/10 Low FEMA zone X (unshaded) · 0% chance over 30 yrs
- Wildfire 1/10 Low
- Heat 5/10 Major 7 d/yr ≥99°F today · 21 d/yr by 30 yrs out
- Wind 2/10 Low
- Air quality 2/10 Low 1 unhealthy d/yr today · 1 by 30 yrs out
Nearby sold comps map
Loading sold comps map…
Walkable amenities ~0.75 mi
Loading nearby amenities…
Taxation est. · year 1
- Rental income
- $13,481
- − Mortgage interest
- −$7,226
- − Property taxes
- −$2,052
- − Insurance
- −$645
- − Repairs & maintenance
- −$1,078
- − Management
- −$1,078
- − Depreciation
- −$3,753
- Taxable loss
- −$2,352
- Est. tax savings @ 24.0%
- +$565
- After-tax cash flow
- $399/yr
For passive investors: Depreciation is non-cash, so a rental often shows a tax loss while cash-flowing — sheltering income. Rental losses are passive: they offset passive income freely, and up to $25,000/yr can offset ordinary (W-2) income if you actively participate and your MAGI is under $100k (phasing out to $0 by $150k); unused losses carry forward. On sale, claimed depreciation is recaptured at up to 25%, and gains may owe capital-gains tax (a 1031 exchange can defer both). Figures are a year-1 estimate at your 24.0% rate — not tax advice; consult a CPA.
Schools (NCES district)
- District
- Lubbock ISD
- NCES district ID
- 4828500
- Math proficiency
- 36% ▼ -8.00%
- Reading proficiency
- 39% ▼ -1.00%
- Median HH income
- $39,820
- Composite
- 31.44/100
- National rank
- #5984
- State rank
- #481 of 826 in TX
Livability — Lubbock
- Score
- 80/100
- State rank
- #37
- US rank
- #1749
Category grades
Schools grade is shown separately in the Schools card above.
Census & demographics
- Census place
- Lubbock, TX
- County
- Lubbock County · 293,542 people
- City population
- 283,030
- Metro
- Lubbock, TX
- Population (ZIP)
- 17,596
- Household income
- $49,057
- Rent vs Own
- Severe rent burden
- 1330.0
Population outlook (Lubbock County) Hauer SSP2
- Today (2025)
- 345,960 people
- By 2030
- 371,449 · +7.4%
- By 2040
- 424,539 · +22.7%
- By 2050
- 481,150 · +39.1%
- By 2075
- 633,467 · +83.1%
- By 2100
- 746,853 · +115.9%
Race, ethnicity, and origin ACS 2023
- Neighborhood character
- Diverse neighborhood (Simpson 0.62)
- Race & ethnicity
- White 47% Hispanic / Latino 39% Two or more races 21% Black 9% Asian 1%
- Hispanic origin (detail)
- Mexican 30%
- Common ancestry
- Slovak 2% Serbian 1% Italian 1%
- Foreign-born
- 3% · Canada, China
- Languages at home
- 82% English-only · Spanish 16%
Political lean MEDSL · Lubbock
- 2024 margin
- Solid R (+39.5) · D 29.7% · R 69.2% · Other 1.0%
- 2008→2024 swing
- -2.8pp toward R · 2008: -36.7pp · 2024: -39.5pp
- All cycles
- 2024: R+39.5 2020: R+32.2 2016: R+38.4 2012: R+40.9 2008: R+36.7
Not yet ingested
- Civics
- —
Market trends
- HPI YoY
- ▼ -95.31%
- Current HPI
- 247.7963
- Rent YoY
- ▲ 0.56%
- Metro
- Lubbock, TX
- State GDP YoY
- ▲ 3.95%
- F500 in state
- 110
Industry mix (Fortune 500 HQ in TX)
| Industry | F500 HQs | Revenue |
|---|---|---|
| Energy | 16 | $1,198B |
|
||
| Technology | 5 | $198B |
|
||
| Engineering / Construction | 4 | $72B |
|
||
| Energy Services | 3 | $60B |
|
||
| Utilities | 3 | $41B |
|
||
| Healthcare | 2 | $330B |
|
||
Price history
4 events — show timeline
- 2021-11-08 Sold (MLS) — LARMLS
- 2021-10-06 Listed $120,000 LARMLS
- 2009-09-03 Sold (Public Records) — Public Records
- 1990-12-01 Sold (Public Records) — Public Records
Property tax history
+1.9%/yrLatest (2025): $2,052 · -1.4% YoY. Source: county tax records.
Cash-flow waterfall
monthlySold comps — $/sqft
last 12 mo · ≤1 miLoading sold comps…