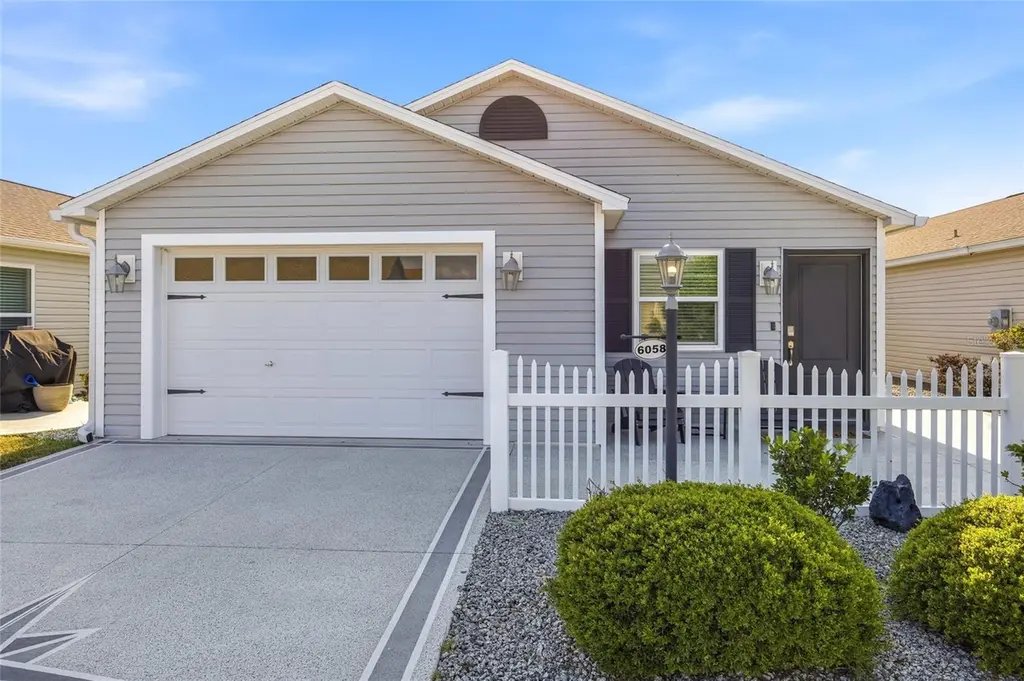
6058 Altman Ave · Wildwood, FL
Flood risk 1/10 · Minimal
- FEMA flood zone
- X (unshaded)
- Chance of flooding over 30 yrs
- 0.0%
- Est. flood insurance / yr
- $507 – $1,088
Fire risk 4/10 · Minor
- Est. fire insurance / yr
- $947 – $1,759
Heat risk 9/10 · Severe
- Hot days now (above 108°F)
- 7 days/yr
- Hot days in 30 yrs
- 23 days/yr
Wind risk 9/10 · Severe
- Chance of severe wind over 30 yrs
- 99.0%
Air-quality risk 2/10 · Minimal
- Unhealthy air days now
- 1 days/yr
- Unhealthy air days in 30 yrs
- 2 days/yr
Risk factors via First Street. Map © Google.
Why this score? — see what drove the C grade
The composite is a weighted blend of 9 inputs, each scored 0–100. Each bar is that input's sub-score; the figure is the points it added to the 100-point composite (weight × sub-score).
- Cash flow +18.4/30.0
- Appreciation +10.0/10.0
- DSCR +5.8/10.0
- 1% rule +5.4/10.0
- Schools +5.2/10.0
- ARV discount +4.9/15.0
- Livability +3.5/5.0
- Rent growth +2.5/5.0
- Condition / age +2.5/5.0
$324,700
🖨 Deal sheet (PDF) 📄 Offer letter ✓ Due diligence
Listing remarks
INVESTOR-READY opportunity in the highly sought-after Village of DeSoto in The Villages! This TURNKEY, fully furnished 2 bedroom, 2 bathroom patio villa is already producing income with a lease in place through April 2027, generating a total of over $30,000 in rental income for the new owner. SKIP the VACANCY risk and start collecting income from day one with an established tenant already in place! Designed for LOW-MAINTENANCE ownership, this well-maintained home features an open and functional floor plan, spacious bedrooms, a well-equipped kitchen, and comfortable living spaces that continue to make patio villas one of the most desirable rental options in The Villages. The BOND IS PAID,
Key facts
- Move in ready
- Bond is paid
- Fully furnished
Tags
Property features AI
Finance
- Other: Property sits on about 0.08 acres (approximately 334 sq meters)
- Financial info: Other annual assessment approximately $732; Lease restrictions apply
- HOA & community: Association fees totaling approximately $205 monthly (about $2,460 annually)
Exterior
- Parking: Attached garage (1 car) with approximate dimensions 18 x 24
- Utilities: Public water; Public sewer; Electricity connected
- Home design: Single family residence; Residential property; PUD zoning; One story; Faces east; CDD community; Senior community
- Construction: Vinyl siding; Shingle roof; Slab foundation; Built with approximately 1,627 total building area (public records)
- Exterior features: Exterior lighting; Rain gutters
Interior
- Kitchen: Dishwasher; Range; Microwave; Refrigerator
- Bedrooms: 2 bedrooms
- Flooring: Vinyl
- Bathrooms: 2 full bathrooms
- Heating & cooling: Electric heating; Central air conditioning
- Interior features: Ceiling fans; High ceilings; Open floor plan; Vaulted ceilings; Walk-in closet(s); Window treatments
- Laundry & utility: Washer; Dryer; Inside laundry in a laundry closet
Neighborhood map
What this means for you Summary
Snapshot
- This is a 2-bed/2.0-bath single-family listed at $325k.
Deal economics
- At list price, monthly cash flow is $306 ($4k/yr) — positive.
- The deal already cash-flows at list — no discount required.
- Meets the 1% rule at list price ($3k rent vs $325k).
- Recommended offer: $315k (3.0% below list) — sets the bar for market timing.
- Cap rate 7.4% vs local median 3.9% in Wildwood — top-decile yield for the area; either an underpriced asset or a hidden risk that comps aren't pricing in. Stress-test before assuming the spread holds.
Location & tenants
- Location reads 69/100 on livability (#471 in FL) — a middle-class / working-renter tenant base. Strengths: health & safety A+, cost of living A, crime A-; Watch: schools C-, amenities F, commute F.
- Sumter (rural): math 61% / reading 61% proficiency, ranked #11 of 73 in FL (top 15%) — acceptable for families but not a draw, mixed tenant base, ~2y average lease.
- Market conditions: 265 active listings in the ZIP; 3 comparable units currently listed for rent nearby; rentals at typical pace (median 22d on market — plan ~3-4 weeks tenant-placement turnaround); solid renter incomes; 3,961 units permitted in Sumter County in 2024 (248 in 5+ unit buildings).
- This rent runs 42% of the median local income ($97k/yr) — at the standard rent-burdened threshold; future hikes will face affordability resistance.
Forward outlook
- In year one you build about $35k of equity ($2k loan paydown + $32k appreciation (10.0% local appreciation)).
- Sumter County population projected at +45% by 2050 — long-run rental-demand tailwind backs the buy-and-hold thesis.
- At projected returns (10.0% appreciation + 3.0% rent growth), your $91k cash investment doubles in ~3 years — after that, you're playing with house money.
- By year 2, paydown + projected appreciation supports a ~$56k cash-out refi (75% LTV) — recoverable capital for the next deal without selling this one.
Negotiation context
- It's been on market 45 days — a 3% lower offer ($315k) is reasonable based on typical stale-listing flexibility.
- 3 sale attempts since 2y ago with the ask held roughly flat each time — persistent listings suggest the price (not the market) is what's stuck; bring a comps-based counter.
Risks & watch-outs
- Climate carrying-cost: severe wind risk, 99% chance of damaging wind over 30y; extreme-heat days projected 7→23/yr by 2055 (HVAC capex compounding) — expect insurance premiums to compound above CPI over the hold.
Questions for the listing agent
- It's been on market 45 days. Have you received any prior offers? Is the seller open to a 3% concession, seller financing, or rate buy-down credit?
- What does the HOA fee cover, when was the last increase, and are there any pending special assessments or reserve-fund shortfalls?
- Is there a deadline driving the sale (1031 exchange, divorce, estate, relocation)? That informs how much negotiation room exists.
- What's the average days-on-market for RENTAL listings here right now (not sales)? A rising rental-DOM trend means longer vacancies and softer asking-rent achievability than the comps imply.
- What's the recent tenant-quality profile in this submarket — average credit score on applications, eviction rate, late-payment / NSF rate, and stable-employment percentage? A property-management company in the area should have these aggregated.
- How much new for-sale + rental construction is in the pipeline within 1–3 miles? Heavy new supply typically softens prices + rents 12–24 months out; constrained supply supports both.
Investment metrics
- 1% rule
- 1.04% ✓
- Cap rate
- 7.42%
- Cash-on-cash
- 4.04%
- DSCR
- 1.18
- GRM
- 8.0
CMA / ARV
- ARV (on-the-fly)
- $306,952
- Comps found
- 12
Show comp detail 12 sales within ~0.75 mi
| Address | Dist | Beds/Ba | Sqft | Sold | Price | $/sf | Match |
|---|---|---|---|---|---|---|---|
| 2378 Hill St | 0.10mi | 2/2.0 | 1,159 (-8%) | 6mo | $299,000 | $258 | 77 |
| 5690 Craft Ct | 0.64mi | 2/2.0 | 1,314 (+4%) | 0mo | $310,000 | $236 | 63 |
| 2443 Dooley St | 0.50mi | 2/2.0 | 1,146 (-9%) | 2mo | $320,000 | $279 | 60 |
| 5859 Tupelo Ter | 0.35mi | 3/2.0 (+1) | 1,409 (+12%) | 1mo | $342,000 | $243 | 58 |
| 2306 Sheehan St | 0.74mi | 2/2.0 | 1,227 (-2%) | 5mo | $272,000 | $222 | 57 |
| 5627 Van Winkle Ter | 0.75mi | 2/2.0 | 1,227 (-2%) | 16mo | $290,000 | $236 | 48 |
| 5829 Tupelo Ter | 0.40mi | 3/2.0 (+1) | 1,409 (+12%) | 11mo | $355,000 | $252 | 47 |
| 2332 Sheehan St | 0.72mi | 2/2.0 | 1,227 (-2%) | 22mo | $299,000 | $244 | 44 |
| 5705 Craft Ct | 0.61mi | 3/2.0 (+1) | 1,426 (+13%) | 0mo | $280,000 | $196 | 44 |
| 2763 County Road 503 | 0.74mi | 3/2.0 (+1) | 1,216 (-3%) | 21mo | $247,000 | $203 | 38 |
| 5745 Rowe Pl | 0.52mi | 3/2.0 (+1) | 1,406 (+12%) | 20mo | $463,500 | $330 | 35 |
| 5748 Leigh Ln | 0.52mi | 3/2.0 (+1) | 1,424 (+13%) | 19mo | $428,000 | $301 | 33 |
Match score weights: distance 35% · size 25% · config 20% · recency 20%. Top-matched comps best support the ARV.
Projected returns pro-forma
10.0% appreciation · 3.0% rent growth · sell at horizon
- IRR
- 27.2%
- Equity multiple
- 3.16×
- Total profit
- $196,440
- Equity at exit
- $292,515
- IRR
- 23.8%
- Equity multiple
- 7.20×
- Total profit
- $563,395
- Equity at exit
- $630,821
Cash invested: $90,916 (down + closing). Projections, not guarantees.
Landlord ↔ Tenant lean methodology
- Overall (STATE)
- 87 Strongly Landlord-Friendly
- State Florida
- 87 Strongly Landlord-Friendly · R+3
- County
- — inherits STATE
- City
- — inherits STATE
ZIP-level market 32163
- Home prices YoY
- 9.8%
- Active inventory
- 265
- Price-to-rent
- 8.0×
Monthly cashflow live
- Estimated rent
- $3,365 medium interval (Pro) →
- Mortgage (P&I)
- −$1,703
- Tax from tax record
- −$309 /mo · $3,710/yr
- Insurance
- −$135
- HOA
- −$205
- Vacancy / Maint / Mgmt
- −$707
- Net cashflow
- $306
Break-even live
Sensitivity live
| Price | -10% $490 | -5% $398 | +0% $306 | +5% $214 | +10% $122 |
|---|---|---|---|---|---|
| Rent | -10% $40 | -5% $173 | +0% $306 | +5% $439 | +10% $572 |
| Rate | -1.0pp $469 | -0.5pp $388 | base $306 | +0.5pp $222 | +1.0pp $136 |
UW: 25.0% down · 7.5% · 30yr · 1.5% tax · 5.0% vac · 8.0% maint · 8.0% mgmt
Financing live
Cash to close
- Down payment
- $81,175
- Closing costs
- $9,741
- Reserves months
- —
- Total cash needed
- —
Loan-product check · same deal, 3 products live
Conventional
25% down · 7.5% · 30yr
- Down + closing
- —
- Monthly P&I
- —
- Monthly cashflow
- —
- DSCR
- —
- Eligible?
- —
Personal DTI + credit; lowest rate.
DSCR
20% down · 8.5% · 30yr
- Down + closing
- —
- Monthly P&I
- —
- Monthly cashflow
- —
- DSCR
- —
- Eligible?
- —
No personal income docs; deal must DSCR.
Hard money
10% down · 12.0% · 12mo
- Down + closing
- —
- Monthly P&I
- —
- Monthly cashflow
- —
- DSCR
- —
- Eligible?
- —
Short-term bridge; refi at stabilization.
Rent comps 3 comps
| Address | Beds | Baths | Sqft | Rent | $/sqft | DOM | Units | Dist |
|---|---|---|---|---|---|---|---|---|
| 2408 Woods Way The Villages, FL | 3.0 | 2.0 | 1419 | $2,900 | $2.04 | 21d | 1 | 0.38mi |
| 5828 Tupelo Ter Unit Posted to Internet Wildwood, FL | 2.0 | 2.0 | 1147 | $4,500 | $3.92 | 21d | 1 | 0.40mi |
| 1750 Debellis Ln Unit Posted To Internet Sumterville, FL | 3.0 | 2.0 | 1505 | $4,250 | $2.82 | 21d | 1 | 1.18mi |
HOA detail
- Monthly dues
- $205 · $2,460/yr
Listing history 23 events
-
2026-06-19days on market $324,700 Active 45 DOM
-
2026-06-18days on market $324,700 Active 44 DOM
-
2026-06-17days on market $324,700 Active 43 DOM
-
2026-06-16days on market $324,700 Active 42 DOM
-
2026-06-15days on market $324,700 Active 41 DOM
-
2026-06-14days on market $324,700 Active 39 DOM
-
2026-06-13days on market $324,700 Active 38 DOM
-
2026-06-10days on market $324,700 Active 36 DOM
-
2026-06-09days on market $324,700 Active 35 DOM
-
2026-06-08days on market $324,700 Active 34 DOM
-
2026-06-07days on market $324,700 Active 33 DOM
-
2026-06-02days on market $324,700 Active 28 DOM
-
2026-06-01days on market $324,700 Active 27 DOM
-
2026-05-31days on market $324,700 Active 26 DOM
-
2026-05-30days on market $324,700 Active 25 DOM
-
2026-05-05$324,700 Active
-
2024-05-10historical $2,000
-
2024-04-23$2,000
-
2024-03-26historical $3,000
-
2024-03-05$3,000
-
2023-04-24soldstatus $305,000
-
2021-06-15soldstatus $245,000
-
2019-11-20soldstatus $210,000
ⓘ Source: listings_history table (triggers on properties + properties_extension) + one-shot
backfill from property_details.listing_events for pre-trigger history.
Tax reassessment forecast FL · Resets to sale price
- Current annual tax
- $3,710 · $309/mo
- Projected year-2 tax
- $3,710 · $309/mo
- Expected delta
- $0/yr ($0/mo · 0.0%)
ⓘ Screening estimate from a state-policy table — verify with the county assessor before closing.
Climate risk First Street
- Flood 1/10 Low FEMA zone X (unshaded) · 0% chance over 30 yrs
- Wildfire 4/10 Moderate
- Heat 9/10 Extreme 7 d/yr ≥108°F today · 23 d/yr by 30 yrs out
- Wind 9/10 Extreme 99% chance of damaging wind over 30 yrs
- Air quality 2/10 Low 1 unhealthy d/yr today · 2 by 30 yrs out
Nearby sold comps map
Loading sold comps map…
Walkable amenities ~0.75 mi
Loading nearby amenities…
Taxation est. · year 1
- Rental income
- $40,376
- − Mortgage interest
- −$18,188
- − Property taxes
- −$3,710
- − Insurance
- −$1,624
- − Repairs & maintenance
- −$3,230
- − Management
- −$3,230
- − HOA
- −$2,460
- − Depreciation
- −$9,446
- Taxable loss
- −$1,511
- Est. tax savings @ 24.0%
- +$363
- After-tax cash flow
- $4,033/yr
For passive investors: Depreciation is non-cash, so a rental often shows a tax loss while cash-flowing — sheltering income. Rental losses are passive: they offset passive income freely, and up to $25,000/yr can offset ordinary (W-2) income if you actively participate and your MAGI is under $100k (phasing out to $0 by $150k); unused losses carry forward. On sale, claimed depreciation is recaptured at up to 25%, and gains may owe capital-gains tax (a 1031 exchange can defer both). Figures are a year-1 estimate at your 24.0% rate — not tax advice; consult a CPA.
Schools (NCES district)
- District
- Sumter
- NCES district ID
- 1201800
- Math proficiency
- 61% ▼ -4.00%
- Reading proficiency
- 61% ▼ -2.00%
- Median HH income
- $48,240
- Composite
- 51.74/100
- National rank
- #1682
- State rank
- #11 of 73 in FL
Livability — Wildwood
- Score
- 69/100
- State rank
- #471
- US rank
- #8500
Category grades
Schools grade is shown separately in the Schools card above.
Census & demographics
- Census place
- Wildwood, FL
- County
- Sumter County · 110,591 people
- City population
- 21,568
- Metro
- The Villages, FL
- Population (ZIP)
- 28,549
- Household income
- $96,775
- Rent vs Own
- Severe rent burden
- 307.0
Population outlook (Sumter County) Hauer SSP2
- Today (2025)
- 161,172 people
- By 2030
- 180,083 · +11.7%
- By 2040
- 209,892 · +30.2%
- By 2050
- 234,186 · +45.3%
- By 2075
- 284,602 · +76.6%
- By 2100
- 317,039 · +96.7%
Race, ethnicity, and origin ACS 2023
- Neighborhood character
- Predominantly White (95%)
- Race & ethnicity
- White 95% Two or more races 2% Hispanic / Latino 2% Asian 1%
- Common ancestry
- Romanian 6% Lithuanian 3% Iranian 3%
- Foreign-born
- 6% · Canada, Vietnam
- Languages at home
- 96% English-only · Spanish 2% Vietnamese 1% Other Indo-European 0%
Political lean MEDSL · Sumter
- 2024 margin
- Solid R (+37.6) · D 30.9% · R 68.6%
- 2008→2024 swing
- -10.6pp toward R · 2008: -27.0pp · 2024: -37.6pp
- All cycles
- 2024: R+37.6 2020: R+36.1 2016: R+39.2 2012: R+34.9 2008: R+27.0
Not yet ingested
- Civics
- —
Market trends
- HPI YoY
- ▲ 20.47%
- Current HPI
- 229.0075
- Rent YoY
- —
- Metro
- The Villages, FL
- State GDP YoY
- ▲ 3.28%
- F500 in state
- 36
Industry mix (Fortune 500 HQ in FL)
| Industry | F500 HQs | Revenue |
|---|---|---|
| Industrial Technology | 2 | $29B |
|
||
| Insurance | 2 | $17B |
|
||
| Retail | 1 | $60B |
|
||
| Technology Distribution | 1 | $58B |
|
||
| Homebuilding | 1 | $35B |
|
||
| Technology Manufacturing | 1 | $35B |
|
||
Price history
+54.6% since first listed8 events — show timeline
- 2026-05-05 Listed $324,700 Stellar MLS as Distributed by MLS Grid
- 2024-05-10 Rental Removed $2,000 Avail
- 2024-04-23 Listed for Rent $2,000 Avail
- 2024-03-26 Rental Removed $3,000 Avail
- 2024-03-05 Listed for Rent $3,000 Avail
- 2023-04-24 Sold (Public Records) $305,000 Public Records
- 2021-06-15 Sold (Public Records) $245,000 Public Records
- 2019-11-20 Sold (Public Records) $210,000 Public Records
Property tax history
+14.9%/yrLatest (2025): $3,710 · -0.1% YoY. Source: county tax records.
Cash-flow waterfall
monthlySold comps — $/sqft
last 12 mo · ≤1 miLoading sold comps…