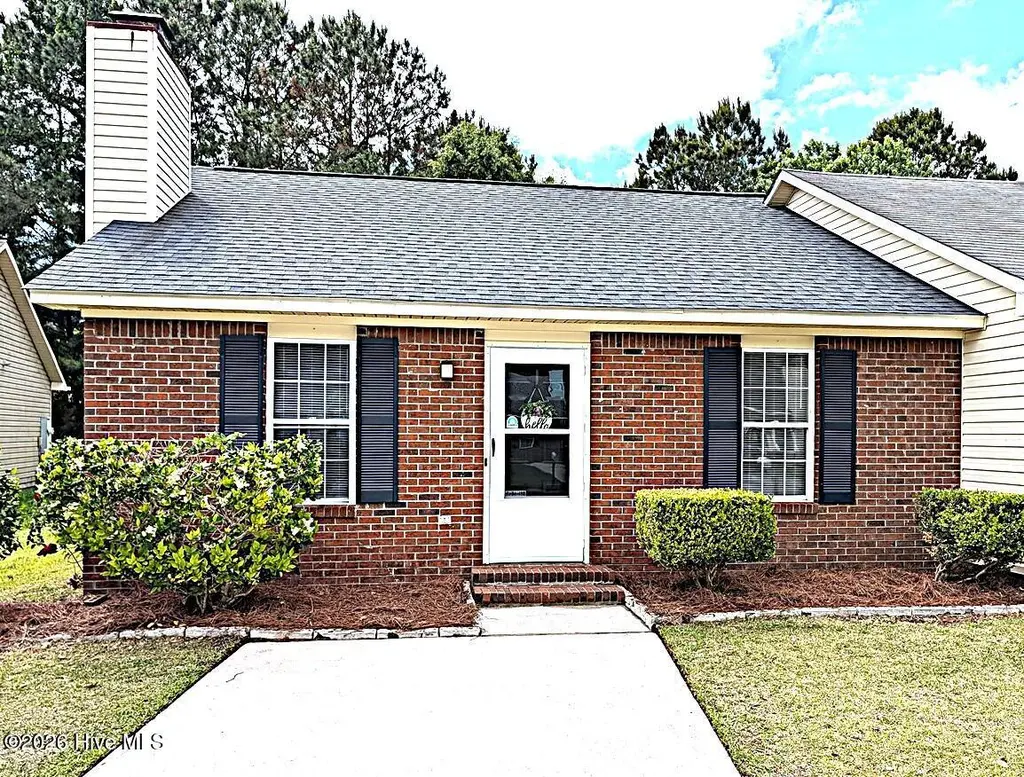
114 Live Oak Ct · Piney Green, NC
Flood risk 1/10 · Minimal
- FEMA flood zone
- X (unshaded)
- Chance of flooding over 30 yrs
- 0.0%
- Est. flood insurance / yr
- $507 – $1,088
Fire risk 6/10 · Moderate
- Est. fire insurance / yr
- $906 – $1,684
Heat risk 9/10 · Severe
- Hot days now (above 106°F)
- 7 days/yr
- Hot days in 30 yrs
- 19 days/yr
Wind risk 8/10 · Major
- Chance of severe wind over 30 yrs
- 99.0%
Air-quality risk 2/10 · Minimal
- Unhealthy air days now
- 1 days/yr
- Unhealthy air days in 30 yrs
- 3 days/yr
Risk factors via First Street. Map © Google.
Why this score? — see what drove the C- grade
The composite is a weighted blend of 9 inputs, each scored 0–100. Each bar is that input's sub-score; the figure is the points it added to the 100-point composite (weight × sub-score).
- Cash flow +17.5/30.0
- Appreciation +9.1/10.0
- DSCR +5.5/10.0
- ARV discount +4.2/15.0
- Schools +3.9/10.0
- 1% rule +3.5/10.0
- Livability +3.0/5.0
- Rent growth +2.9/5.0
- Condition / age +2.5/5.0
$159,900
🖨 Deal sheet (PDF) 📄 Offer letter ✓ Due diligence
Listing remarks
Well maintained and updated property close to Camp Lejeune. No city taxes and no HOA! A few of the updates are new roof October 2019, New HVAC and electrical panel Jan 23, 2026. New LVP December 2021. In 2021 new six panel doors installed, new kitchen countertops, new vanities, new dishwasher and fully painted. New doors were just put on the kitchen cabinets with new hardware, new fridge and new stove with new vent hood. Paint touched up and trim painted. New bathroom vanity lights, kitchen lights and exterior lights. Not much hasn't been updated in this property.
Key facts
- New hvac
- New six panel doors
- New lvp
Tags
Property features AI
Finance
- HOA & community: No association amenities
Exterior
- Parking: Off-street paved parking
- Utilities: Public water; Sewer connected; Water connected; Cable available
- Home design: Duplex; Townhouse (residential); Single-story, entry level on 1
- Construction: Brick veneer, vinyl siding, and frame construction; Slab foundation; Built as one-story
- Exterior features: Patio; Chain-link fencing in backyard; Shingle roof; Has a view; Cul-de-sac lot; City street and state road frontage
Interior
- Kitchen: Refrigerator; Range; Dishwasher
- Bedrooms: Total of 4 rooms (includes bedrooms and living areas)
- Bathrooms: 2 full bathrooms
- Heating & cooling: Heat pump for heating and cooling; Fireplace insert; Electric heating
- Interior features: Master bedroom on main level; Vaulted ceilings; Unfurnished
- Laundry & utility: Electric water heater
Neighborhood map
What this means for you Summary
Snapshot
- This is a 2-bed/2.0-bath townhouse listed at $160k.
Deal economics
- At list price, monthly cash flow is $122 ($1k/yr) — positive.
- The deal already cash-flows at list — no discount required.
- To meet the 1% rule (rent ≥ 1% of price), the offer needs to be $136k (14.7% below list).
- Recommended offer: $136k (14.7% below list) — sets the bar for 1% rule.
- Cap rate 7.2% vs local median 3.6% in Piney Green — top-decile yield for the area; either an underpriced asset or a hidden risk that comps aren't pricing in. Stress-test before assuming the spread holds.
Location & tenants
- Location reads 60/100 on livability (#524 in NC) — a middle-class / working-renter tenant base. Strengths: cost of living A+, housing A+; Watch: crime D+, employment D+, amenities F.
- Onslow County Schools (other): math 42% / reading 49% proficiency, ranked #84 of 178 in NC (top 47%) — families likely to look elsewhere, expect single-tenant / working-renter base with shorter leases.
- Zoned schools: Hunters Creek Elementary (math 27% / reading 35%, grade F, #954 of 1,410 statewide, top 68%, 653 students, 67% FRL); Hunters Creek Middle (math 32% / reading 44%, grade F, #251 of 475 statewide, top 54%, 922 students, 55% FRL); White Oak High (math 57% / reading 54%, grade C, #265 of 535 statewide, top 50%, 1,207 students, 49% FRL) — zoned schools average 57% FRL vs 37% district-wide (20 pts higher); higher-poverty schools than district average — tighter screening recommended.
- Market conditions: Rents rising (+1.4%/yr); 31 active listings in the ZIP; 8 comparable units currently listed for rent nearby; rentals at typical pace (median 23d on market — plan ~3-4 weeks tenant-placement turnaround); 1,246 units permitted in Onslow County in 2024 (0 in 5+ unit buildings).
- This rent runs 31% of the median local income ($52k/yr) — at the standard rent-burdened threshold; future hikes will face affordability resistance.
Forward outlook
- In year one you build about $14k of equity ($1k loan paydown + $13k appreciation (8.2% local appreciation)).
- At projected returns (8.2% appreciation + 1.4% rent growth), your $45k cash investment doubles in ~3 years — after that, you're playing with house money.
- By year 3, paydown + projected appreciation supports a ~$35k cash-out refi (75% LTV) — recoverable capital for the next deal without selling this one.
Negotiation context
- Only 1 days on market — expect competitive offers; lowballing is unlikely to land.
Risks & watch-outs
- Climate carrying-cost: severe wind risk, 99% chance of damaging wind over 30y; major wildfire risk; extreme-heat days projected 7→19/yr by 2055 (HVAC capex compounding) — expect insurance premiums to compound above CPI over the hold.
Questions for the listing agent
- Is there a deadline driving the sale (1031 exchange, divorce, estate, relocation)? That informs how much negotiation room exists.
- Schools are F-rated, which usually means shorter tenancies and higher turnover. Who's the typical renter profile here, and what's been the actual vacancy rate?
- Crime grade is D in this area — have there been break-ins, vandalism, or insurance claims at this property in the last 3 years? What carrier currently insures it and at what premium?
- What's the average days-on-market for RENTAL listings here right now (not sales)? A rising rental-DOM trend means longer vacancies and softer asking-rent achievability than the comps imply.
- What's the recent tenant-quality profile in this submarket — average credit score on applications, eviction rate, late-payment / NSF rate, and stable-employment percentage? A property-management company in the area should have these aggregated.
- How much new for-sale + rental construction is in the pipeline within 1–3 miles? Heavy new supply typically softens prices + rents 12–24 months out; constrained supply supports both.
Investment metrics
- 1% rule
- 0.85% ✗
- Cap rate
- 7.21%
- Cash-on-cash
- 3.28%
- DSCR
- 1.15
- GRM
- 9.8
CMA / ARV
- ARV (on-the-fly)
- $149,090
- Comps found
- 12
Show comp detail 12 sales within ~0.75 mi
| Address | Dist | Beds/Ba | Sqft | Sold | Price | $/sf | Match |
|---|---|---|---|---|---|---|---|
| 114 Live Oak Ct | 0.00mi | 2/2.0 | 877 (0%) | 1mo | $160,000 | $182 | 99 |
| 106 Glenside Ct | 0.11mi | 2/2.0 | 877 (0%) | 2mo | $149,900 | $171 | 93 |
| 207 Live Oak Ct | 0.08mi | 2/2.0 | 894 (+2%) | 8mo | $159,900 | $179 | 87 |
| 2507 Willow Crest Ct | 0.11mi | 2/2.0 | 945 (+8%) | 3mo | $147,500 | $156 | 79 |
| 2713 Brookfield Dr | 0.09mi | 2/2.0 | 947 (+8%) | 4mo | $132,000 | $139 | 79 |
| 2133 Rolling Ridge Dr | 0.11mi | 2/2.0 | 941 (+7%) | 6mo | $160,000 | $170 | 78 |
| 2500 Willow Crest Ct | 0.15mi | 2/2.0 | 944 (+8%) | 7mo | $159,900 | $169 | 75 |
| 1940 Heather Loop Loop | 0.26mi | 2/2.0 | 941 (+7%) | 5mo | $155,000 | $165 | 71 |
| 1947 Rolling Ridge Dr | 0.26mi | 2/2.0 | 940 (+7%) | 8mo | $157,500 | $168 | 69 |
| 1928 Greenstone Ct | 0.30mi | 2/2.0 | 941 (+7%) | 7mo | $161,000 | $171 | 68 |
| 1091 W Pueblo Dr | 0.64mi | 2/2.0 | 882 (+1%) | 8mo | $153,000 | $173 | 62 |
| 1113 Pueblo Dr | 0.63mi | 2/2.5 | 992 (+13%) | 7mo | $130,000 | $131 | 41 |
Match score weights: distance 35% · size 25% · config 20% · recency 20%. Top-matched comps best support the ARV.
Projected returns pro-forma
8.15% appreciation · 1.43% rent growth · sell at horizon
- IRR
- 22.2%
- Equity multiple
- 2.63×
- Total profit
- $72,961
- Equity at exit
- $123,076
- IRR
- 19.9%
- Equity multiple
- 5.51×
- Total profit
- $201,700
- Equity at exit
- $245,841
Cash invested: $44,772 (down + closing). Projections, not guarantees.
Landlord ↔ Tenant lean methodology
- Overall (STATE)
- 85 Strongly Landlord-Friendly
- State North Carolina
- 85 Strongly Landlord-Friendly · R+3
- County
- — inherits STATE
- City
- — inherits STATE
ZIP-level market 28544
- Home prices YoY
- 4.2%
- Rents YoY
- 1.4%
- Active inventory
- 31
- Price-to-rent
- 9.8×
Monthly cashflow live
- Estimated rent
- $1,364 high interval (Pro) →
- Mortgage (P&I)
- −$839
- Tax from tax record
- −$50 /mo · $601/yr
- Insurance
- −$67
- HOA
- −$0
- Vacancy / Maint / Mgmt
- −$286
- Net cashflow
- $122
Break-even live
Sensitivity live
| Price | -10% $213 | -5% $167 | +0% $122 | +5% $77 | +10% $32 |
|---|---|---|---|---|---|
| Rent | -10% $14 | -5% $68 | +0% $122 | +5% $176 | +10% $230 |
| Rate | -1.0pp $203 | -0.5pp $163 | base $122 | +0.5pp $81 | +1.0pp $39 |
UW: 25.0% down · 7.5% · 30yr · 1.5% tax · 5.0% vac · 8.0% maint · 8.0% mgmt
Financing live
Cash to close
- Down payment
- $39,975
- Closing costs
- $4,797
- Reserves months
- —
- Total cash needed
- —
Loan-product check · same deal, 3 products live
Conventional
25% down · 7.5% · 30yr
- Down + closing
- —
- Monthly P&I
- —
- Monthly cashflow
- —
- DSCR
- —
- Eligible?
- —
Personal DTI + credit; lowest rate.
DSCR
20% down · 8.5% · 30yr
- Down + closing
- —
- Monthly P&I
- —
- Monthly cashflow
- —
- DSCR
- —
- Eligible?
- —
No personal income docs; deal must DSCR.
Hard money
10% down · 12.0% · 12mo
- Down + closing
- —
- Monthly P&I
- —
- Monthly cashflow
- —
- DSCR
- —
- Eligible?
- —
Short-term bridge; refi at stabilization.
Rent comps 8 comps
| Address | Beds | Baths | Sqft | Rent | $/sqft | DOM | Units | Dist |
|---|---|---|---|---|---|---|---|---|
| 2910 Norbrick St Midway Park, NC | 3.0 | 2.0 | 1011 | $1,500 | $1.48 | 23d | 1 | 0.11mi |
| 2033 Brandymill Ln Jacksonville, NC | 2.0 | 2.5 | 992 | $1,300 | $1.31 | 23d | 1 | 0.55mi |
| 1110 Pueblo Dr Jacksonville, NC | 2.0 | 2.5 | 992 | $1,250 | $1.26 | 23d | 1 | 0.57mi |
| 981 W Pueblo Dr Jacksonville, NC | 2.0 | 2.0 | 882 | $1,250 | $1.42 | 23d | 1 | 0.64mi |
| 977 W Pueblo Dr Jacksonville, NC | 2.0 | 2.5 | 992 | $1,195 | $1.20 | 23d | 1 | 0.64mi |
| 209 Mesa Ln Jacksonville, NC | 2.0 | 2.5 | 992 | $1,350 | $1.36 | 23d | 1 | 0.78mi |
| 1000 Yorktown Ln Jacksonville, NC | 1.0 | 1.0 | 936 | $1,300 | $1.39 | 23d | 1 | 1.01mi |
| 134 Littleton St Midway Park, NC | 2.0 | 1.0 | 840 | $950 | $1.13 | 15d | 1 | 1.35mi |
Listing history 2 events
-
2026-04-28status Pending
-
2026-04-27$159,900 Active
ⓘ Source: listings_history table (triggers on properties + properties_extension) + one-shot
backfill from property_details.listing_events for pre-trigger history.
Tax reassessment forecast NC · Resets to sale price
- Current annual tax
- $601 · $50/mo
- Projected year-2 tax
- $1,311 · $109/mo
- Expected delta
- +$710/yr (+$59/mo · 118.0%)
ⓘ Screening estimate from a state-policy table — verify with the county assessor before closing.
Climate risk First Street
- Flood 1/10 Low FEMA zone X (unshaded) · 0% chance over 30 yrs
- Wildfire 6/10 Major
- Heat 9/10 Extreme 7 d/yr ≥106°F today · 19 d/yr by 30 yrs out
- Wind 8/10 Severe 99% chance of damaging wind over 30 yrs
- Air quality 2/10 Low 1 unhealthy d/yr today · 3 by 30 yrs out
Nearby sold comps map
Loading sold comps map…
Walkable amenities ~0.75 mi
Loading nearby amenities…
Taxation est. · year 1
- Rental income
- $16,367
- − Mortgage interest
- −$8,957
- − Property taxes
- −$601
- − Insurance
- −$800
- − Repairs & maintenance
- −$1,309
- − Management
- −$1,309
- − Depreciation
- −$4,652
- Taxable loss
- −$1,261
- Est. tax savings @ 24.0%
- +$303
- After-tax cash flow
- $1,769/yr
For passive investors: Depreciation is non-cash, so a rental often shows a tax loss while cash-flowing — sheltering income. Rental losses are passive: they offset passive income freely, and up to $25,000/yr can offset ordinary (W-2) income if you actively participate and your MAGI is under $100k (phasing out to $0 by $150k); unused losses carry forward. On sale, claimed depreciation is recaptured at up to 25%, and gains may owe capital-gains tax (a 1031 exchange can defer both). Figures are a year-1 estimate at your 24.0% rate — not tax advice; consult a CPA.
Schools (NCES district)
- District
- Onslow County Schools
- NCES district ID
- 3703450
- Math proficiency
- 42% ▲ 6.00%
- Reading proficiency
- 49% ▲ 5.00%
- Median HH income
- $46,076
- Composite
- 38.66/100
- National rank
- #4148
- State rank
- #84 of 178 in NC
Livability — Piney Green
- Score
- 60/100
- State rank
- #524
- US rank
- #19401
Category grades
Schools grade is shown separately in the Schools card above.
Census & demographics
- Census place
- Piney Green, NC
- County
- Onslow County · 164,453 people
- Metro
- Jacksonville, NC
- Population (ZIP)
- 4,386
- Household income
- $52,354
- Rent vs Own
- Severe rent burden
- 291.0
Population outlook (Onslow County) Hauer SSP2
- Today (2025)
- 189,789 people
- By 2030
- 194,463 · +2.5%
- By 2040
- 193,629 · +2.0%
- By 2050
- 193,248 · +1.8%
- By 2075
- 196,995 · +3.8%
- By 2100
- 201,513 · +6.2%
Race, ethnicity, and origin ACS 2023
- Neighborhood character
- Highly diverse neighborhood (Simpson 0.73)
- Race & ethnicity
- White 44% Two or more races 20% Black 20% Hispanic / Latino 20%
- Hispanic origin (detail)
- Mexican 8%
- Common ancestry
- Serbian 3% Romanian 3% Scandinavian 2%
- Foreign-born
- 5% · Canada, China
- Languages at home
- 87% English-only · Spanish 11% Other Asian/Pacific 1%
Political lean MEDSL · Onslow
- 2024 margin
- Solid R (+35.9) · D 31.5% · R 67.5% · Other 1.0%
- 2008→2024 swing
- -14.5pp toward R · 2008: -21.5pp · 2024: -35.9pp
- All cycles
- 2024: R+35.9 2020: R+30.2 2016: R+34.6 2012: R+27.0 2008: R+21.5
Not yet ingested
- Civics
- —
Market trends
- HPI YoY
- ▲ 8.15%
- Current HPI
- 203.4839
- Rent YoY
- ▲ 1.43%
- Metro
- Jacksonville, NC
- State GDP YoY
- ▲ 3.28%
- F500 in state
- 26
Industry mix (Fortune 500 HQ in NC)
| Industry | F500 HQs | Revenue |
|---|---|---|
| Financial Services | 2 | $213B |
|
||
| Retail | 2 | $95B |
|
||
| Industrial Conglomerate | 1 | $38B |
|
||
| Metals / Steel | 1 | $35B |
|
||
| Utilities | 1 | $30B |
|
||
| Industrial Machinery | 1 | $19B |
|
||
Price history
2 events — show timeline
- 2026-04-28 Pending — Hive MLS
- 2026-04-27 Listed $159,900 Hive MLS
Property tax history
+1.5%/yrLatest (2025): $601 · +0.0% YoY. Source: county tax records.
Cash-flow waterfall
monthlySold comps — $/sqft
last 12 mo · ≤1 miLoading sold comps…